Monitor Tomcat Java application with OpenTelemetry and SigNoz
OpenTelemetry is a vendor-agnostic instrumentation library. In this article, let's explore how to auto-instrument a Tomcat Java application using OpenTelemetry Java JAR agent.
After capturing telemetry data with OpenTelemetry, we will use SigNoz, an open-source full-stack observability tool, to visualize the data.
Steps to get started with OpenTelemetry for Tomcat Java application:
- Installing SigNoz
- Installing sample Tomcat Java application
- Auto Instrumentation with OpenTelemetry Java agent
- Getting metrics and traces for Tomcat application in SigNoz
Installing SigNoz
You can get started with SigNoz using just three commands at your terminal.
git clone -b main https://github.com/SigNoz/signoz.git
cd signoz/deploy/
./install.sh
For detailed instructions, you can visit our documentation.
We have installed SigNoz on a Ubuntu VM in Azure cloud. You can access SigNoz UI at http://IP_of_SigNoz:3301. You can access SigNoz UI at port: 3301 of any host that you choose. In case of local host just use: http://localhost:3301
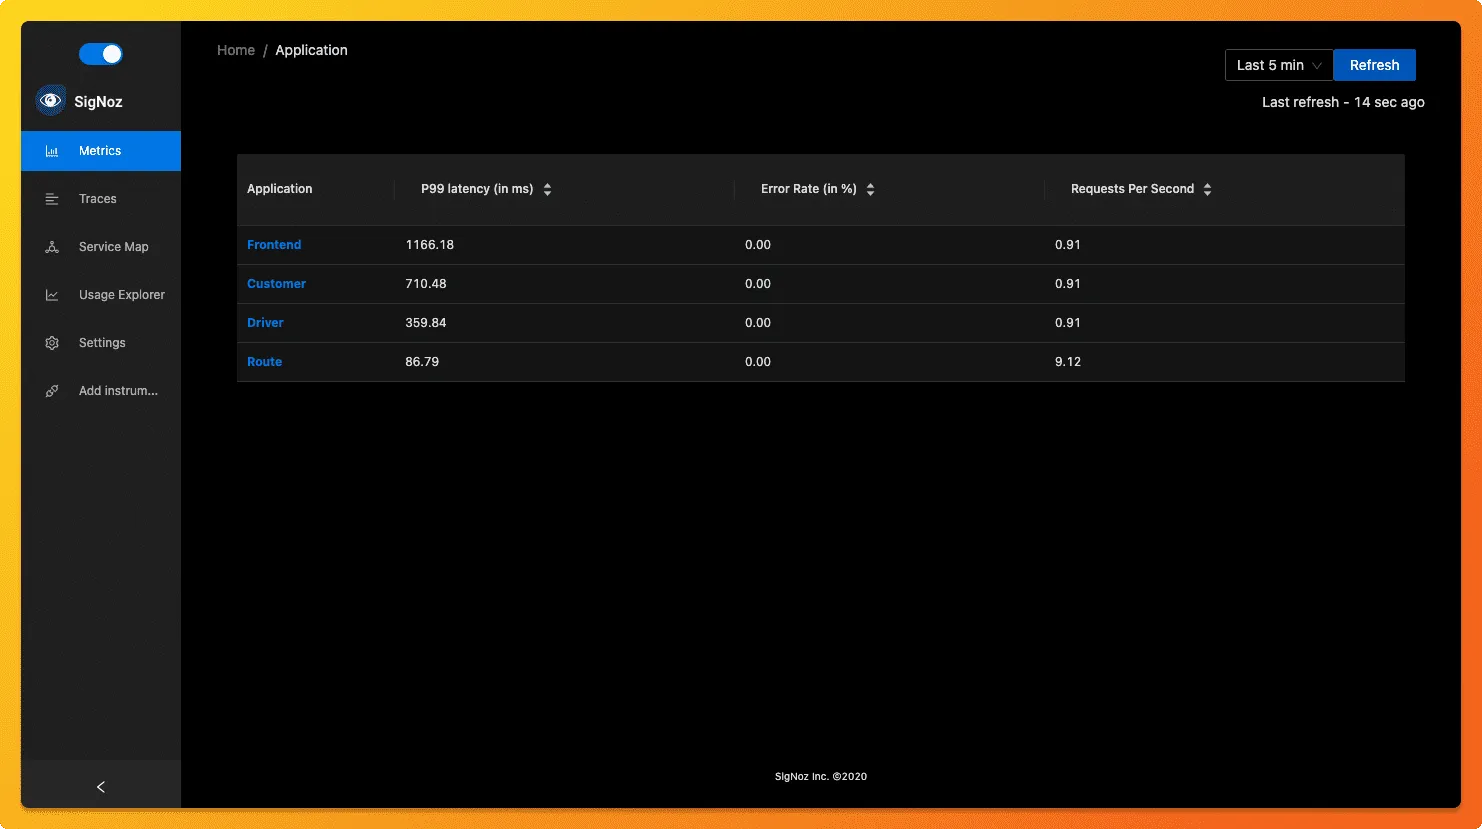
The application list shown in the dashboard is from a sample app called HOT R.O.D that comes bundled with the SigNoz installation package.
Installing sample Tomcat Java application
Prerequisites:
Make sure you have Tomcat installed on your system. If not, then you can download it from Apache Tomcat website. For this tutorial I have used Tomcat 10.0.8.
Steps to install sample Tomcat Java application:
Download an example app packaged as a war file provided at Apache Tomcat official website - Sample Tomcat app

The easiest way to run the sample app is to move it to webapps folder inside the Tomcat directory.
cd Tomcat/webapps
cp ~/Downloads/sample.war .
Once you have copied the file in the webapps folder, get back to the Tomcat folder and run the app using the following command.
cd ..
bin/startup.sh
Check if the sample app is running at: http://localhost:8080/sample/ . The sample should open up like below.

By clicking on the links shown on the page, you can see that it makes dummy calls to a page as part of the Hello World application.
Auto Instrumentation with OpenTelemetry Java agent
OpenTelemetry has a very handy Java JAR agent that can be attached to any Java 8+ application for instrumenting Java applications.. The JAR agent can detect a number of popular libraries and frameworks and instrument it right out of the box. You don't need to add any code for that.
Download the latest Java JAR agent.
For the Tomcat application, you need to setup a few environment variables. You need to create and add a new file
setenv.shin your Tomcat bin folder. The./startup.shcommand which is used to run the Java app will check forsetenv.shfile and run the commands accordingly.In
setenv.shfile, paste the following environment variables using a code editor:export CATALINA_OPTS="$CATALINA_OPTS -javaagent:/path/opentelemetry-javaagent.jar"
export OTEL_EXPORTER_OTLP_ENDPOINT=<IP of SigNoz Backend>:4317
export OTEL_RESOURCE_ATTRIBUTES=service.name=<app_name>In the
CATALINA_OPTSenvironment variable, you need to replacepathwith the path of the folder location where you have saved the OpenTelemetry Java agent downloaded in step 1.The
OTEL_EXPORTER_OTLP_ENDPOINTspecifies the endpoint for SigNoz's backend. In place of IP of SigNoz backend, you need to put the IP of host machine where SigNoz is installed. Also, remember to allow incoming requests to port 4317 of the machine where SigNoz backend is hosted.OTEL_RESOURCE_ATTRIBUTESis used to specify the service name of the service being monitored. So the final environment variables will look like below. Note that:export CATALINA_OPTS="$CATALINA_OPTS -javaagent:/Users/cruxaki/Downloads/opentelemetry-javaagent.jar"
export OTEL_EXPORTER_OTLP_ENDPOINT=http://40.76.59.122:4317
export OTEL_RESOURCE_ATTRIBUTES=service.name=Tomcat-SigNozMake sure that you have saved this file as
setenv.shand in your Tomcat bin folder, because when starting up, Catalina checks this file for environment variables.Now we need to restart our Tomcat Java app with the OpenTelemetry Java agent attached to it. Make sure you're at your Tomcat home folder and then restart the Tomcat server using following commands:
bin/shutdown.sh
bin/startup.sh
Check out the sample Tomcat app again at http://localhost:8080/sample/ and play around with it to generate some load. It might take 1-2 minutes before it starts showing up in the SigNoz dashboard.
Below you can find your
Tomcat-SigNozapp in the list of applications being monitored.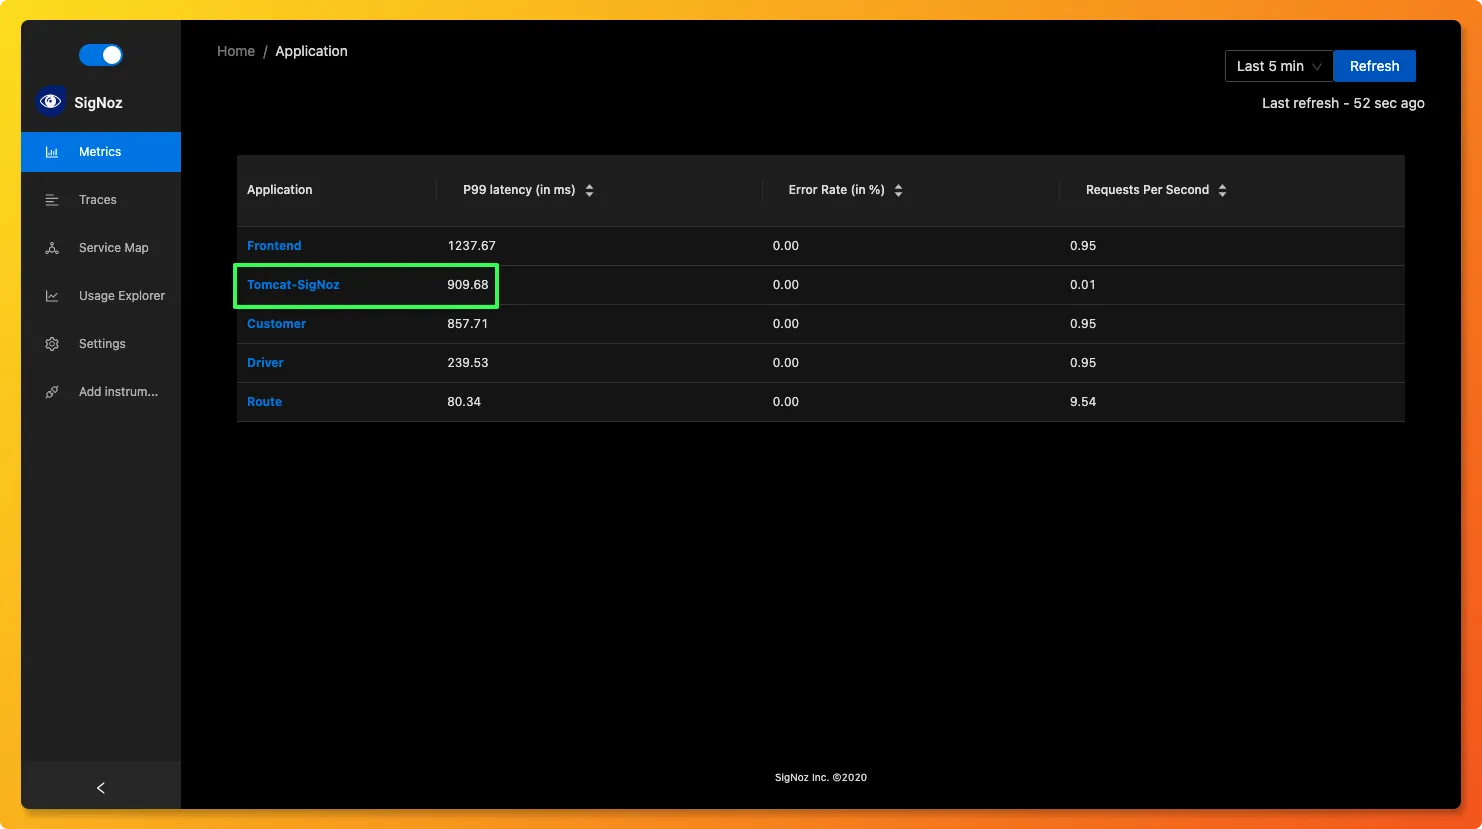
Tomcat-SigNoz shows up in the list of applications monitored by SigNoz
Metrics and Traces of the Tomcat Java Application
SigNoz makes it easy to visualize metrics and traces captured through OpenTelemetry instrumentation.
SigNoz comes with out of box RED metrics charts and visualization. RED metrics stands for:
- Rate of requests
- Error rate of requests
- Duration taken by requests
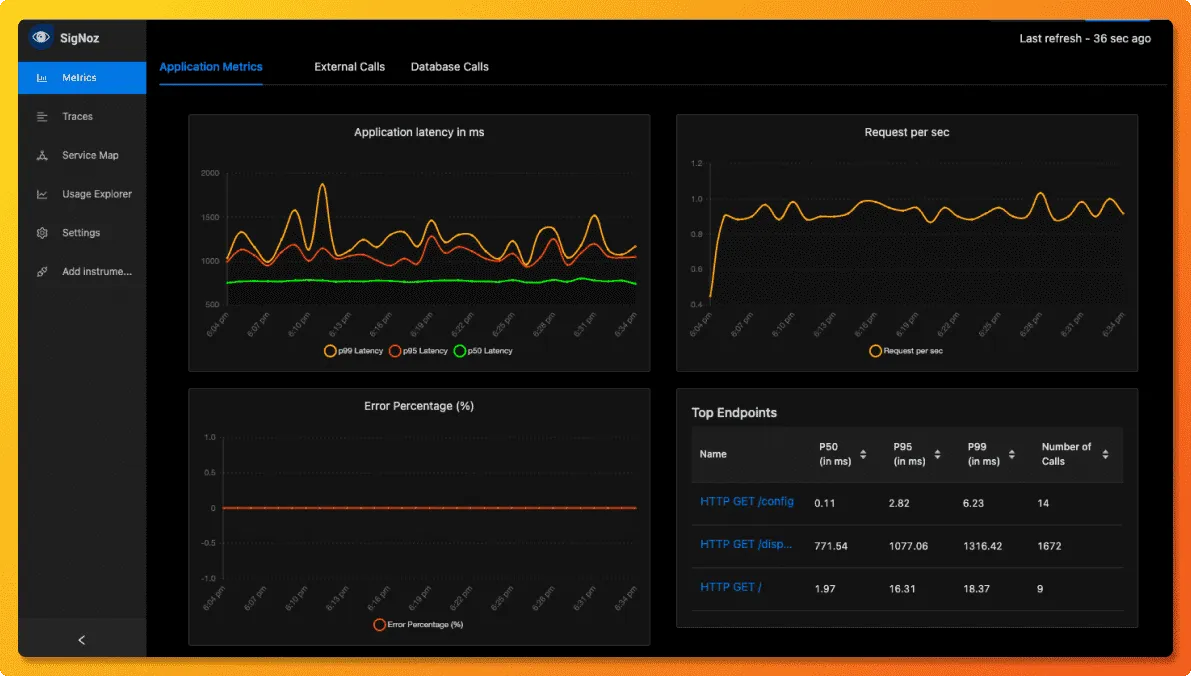
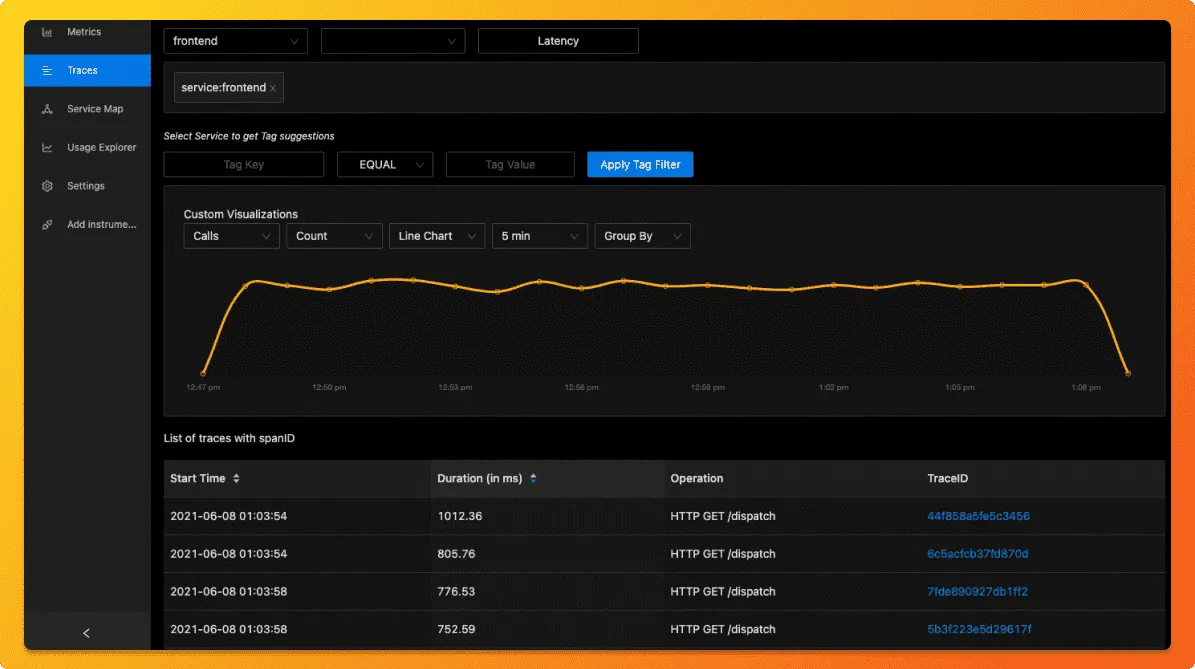
You can then choose a particular timestamp where latency is high to drill down to traces around that timestamp.
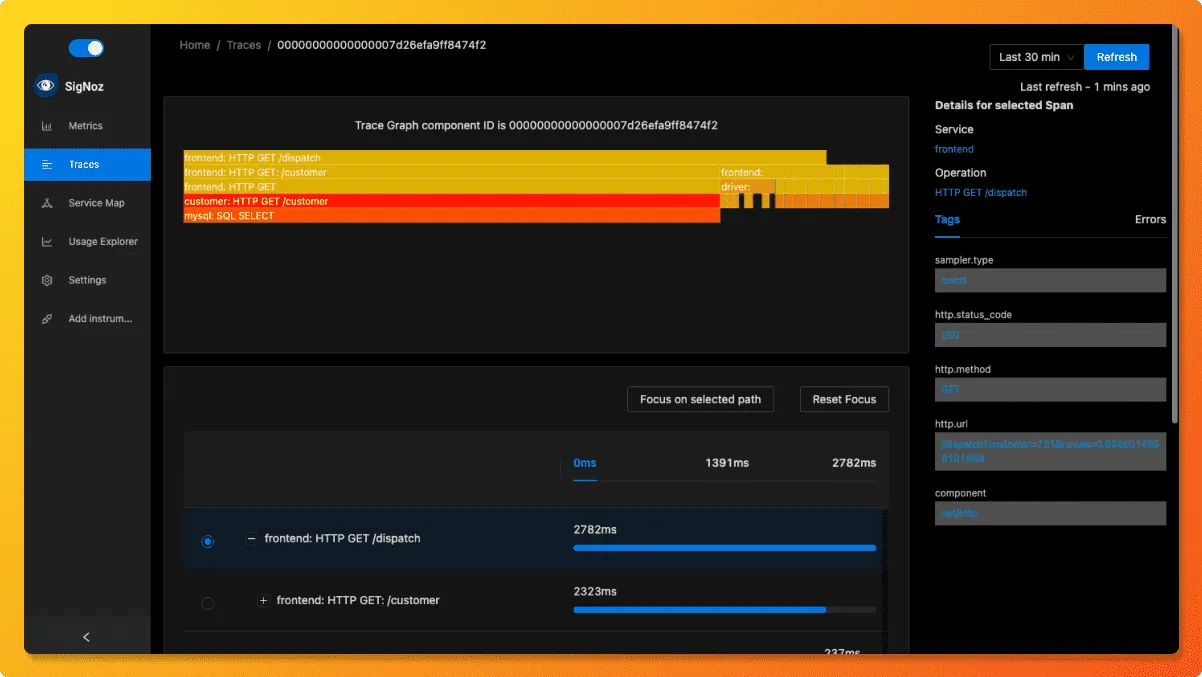
You can use flamegraphs to identify the issue causing the latency.
Conclusion
OpenTelemetry makes it very convenient to instrument your Spring Boot application. You can then use an open-source APM tool like SigNoz to analyze the performance of your app. As SigNoz offers a full-stack observability tool, you don't have to use multiple tools for your monitoring needs.
You can try out SigNoz by visiting its GitHub repo 👇

If you are someone who understands more from video, then you can watch the tutorial on how to monitor your Tomcat Java Application with OpenTelemetry and SigNoz below👇

If you face any issues while trying out SigNoz, feel free to write to us at: support@signoz.io
If you want to read more about SigNoz 👇
Golang Application Performance Monitoring with SigNoz
Monitor your Spring Boot application with OpenTelemetry and SigNoz

