Navigate the User Interface
The layout of the application is comprised of sections, panes, dashboards, graphs, entities, and navigation elements. The following sections describe each of these elements.
Sections
A section provides access to all the functionalities you need to perform a specific activity. For example, the Metrics section provides an overview of all your applications. The following example screenshot shows the four applications that come with the Hot R.O.D. demo application:

Panes
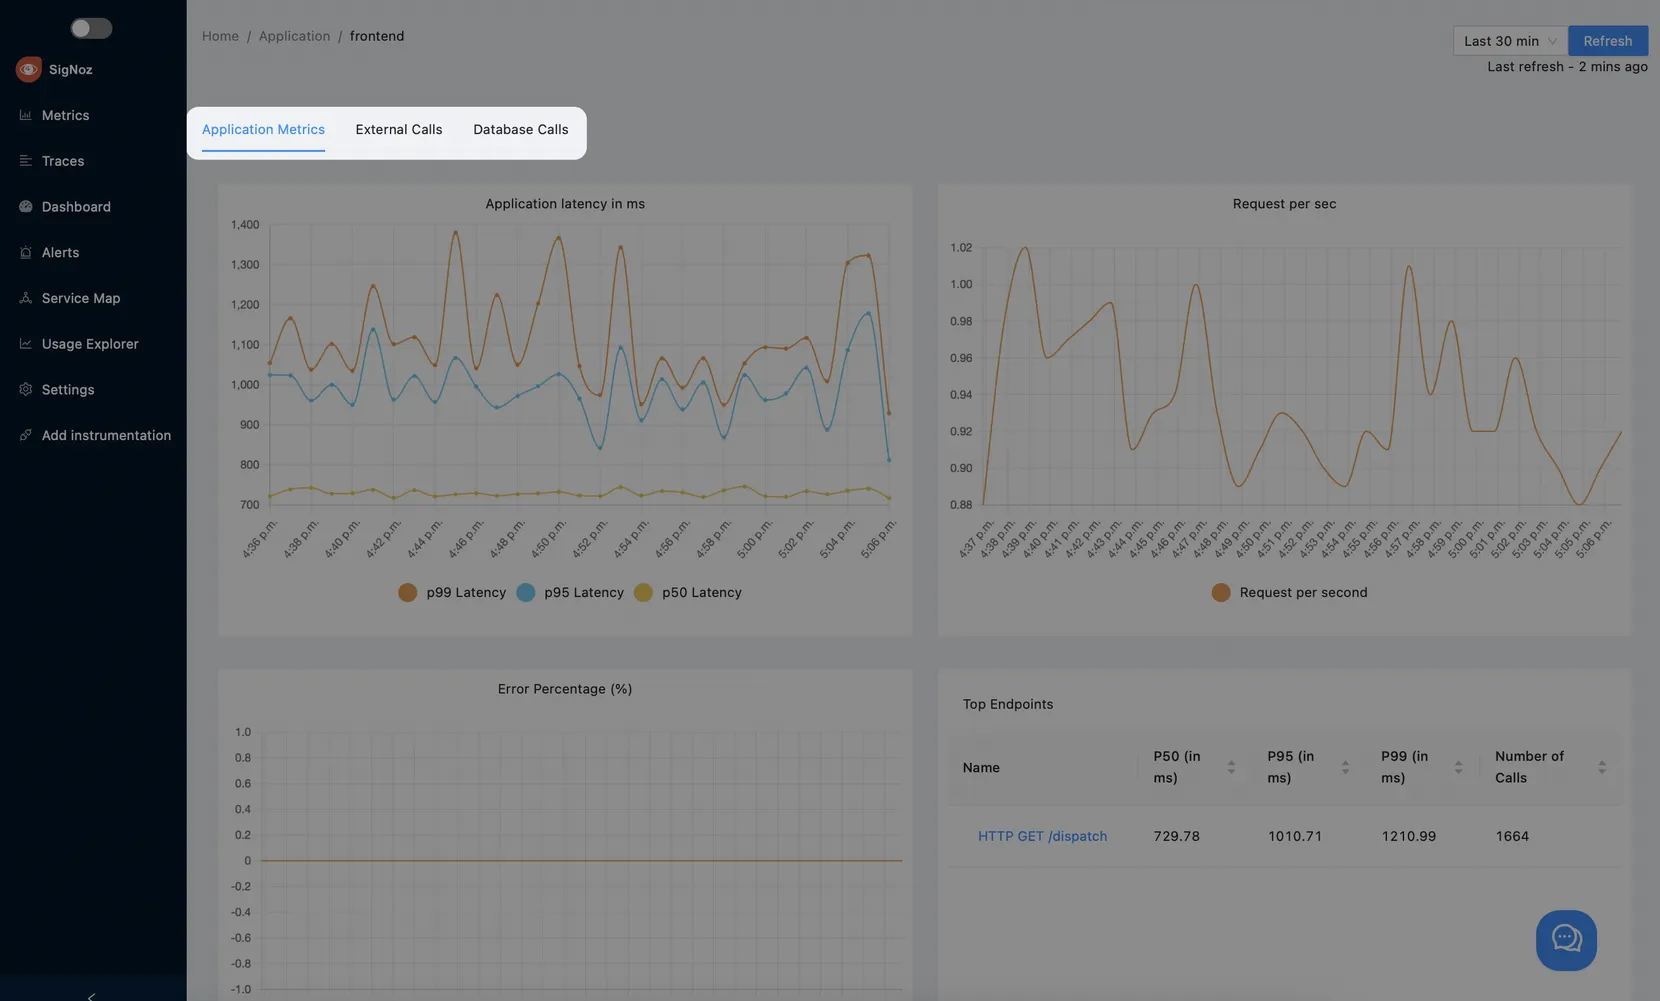
A pane is a subdivision of a section dedicated to a set of functionalities. For example, the Application Details section contains three separate panes:
- Application Metrics
- External Calls
- Database Calls
Dashboards
A dashboard is a set of one or more graphs. In the Dashboard section, you can create, update, and delete dashboards:

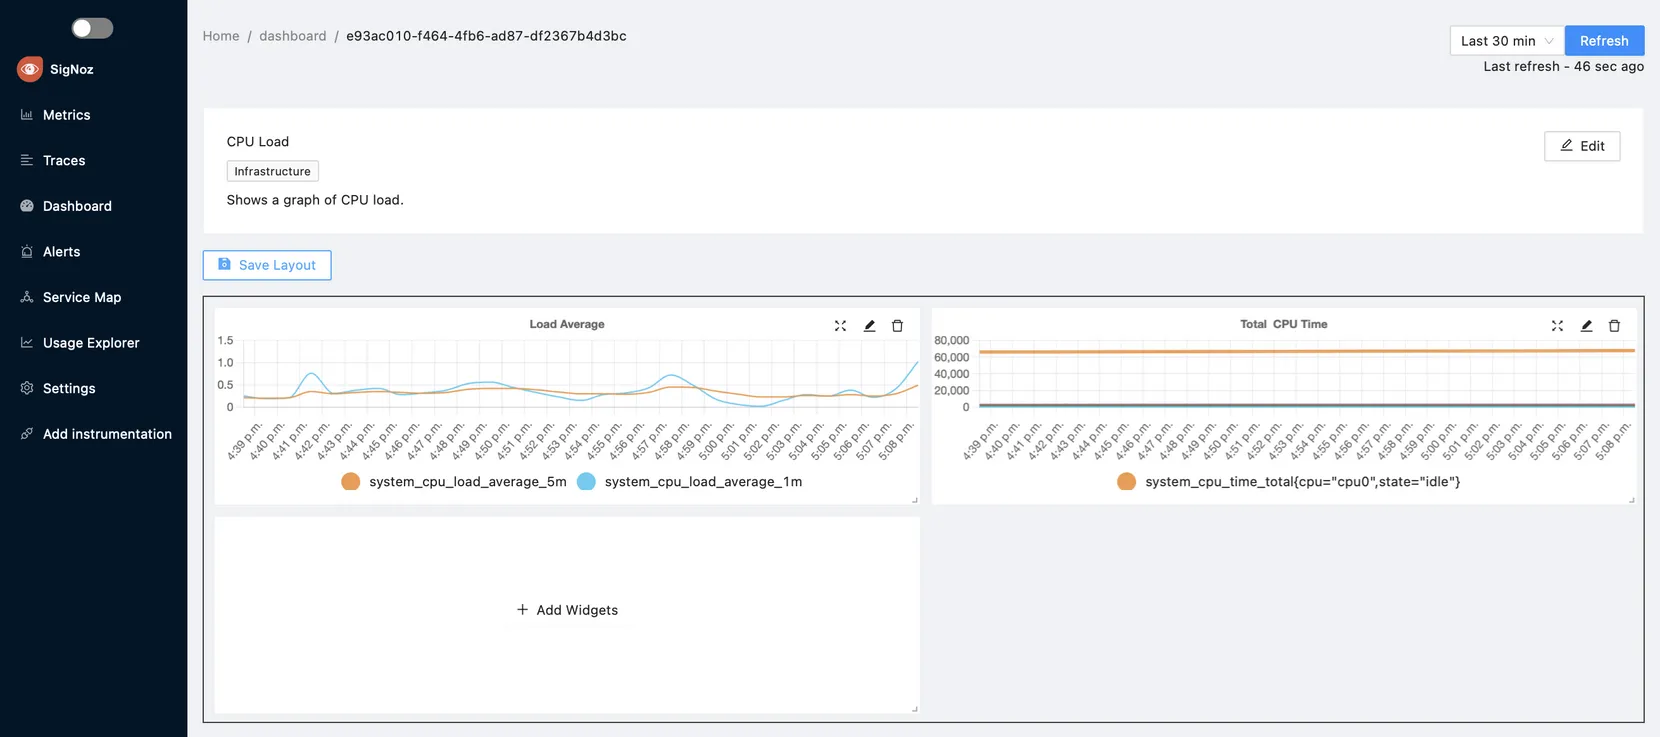
The following example screenshot shows a dashboard named CPU Load containing two graphs - Load Average and Total CPU Time:
Predefined and Custom Graphs
In SigNoz, a graph can either display a metric over a time interval or only the most recent value.
SigNoz supports two types of graphs:
- Predefined graphs that you can find in the Metrics section. You can't modify any of these graphs.
- Custom graphs are graphs you create, update, and remove in the Dashboard section.
Common Operations
This section describes the common operations that you can perform on a graph.
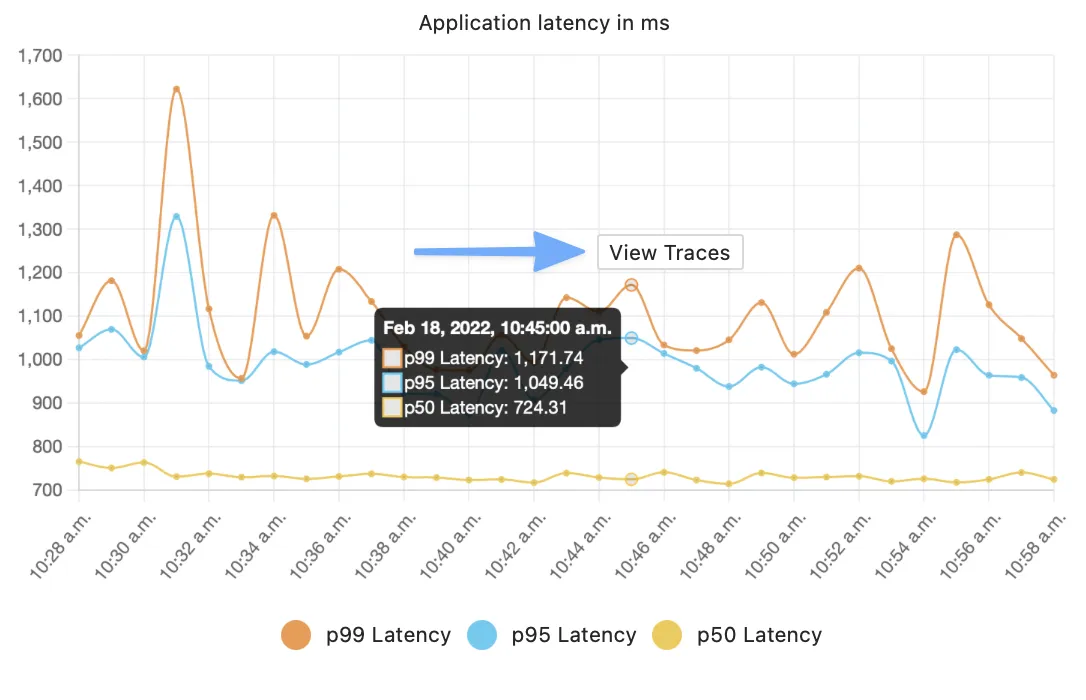
You can hover over a graph to see the actual values at a specific point in time:
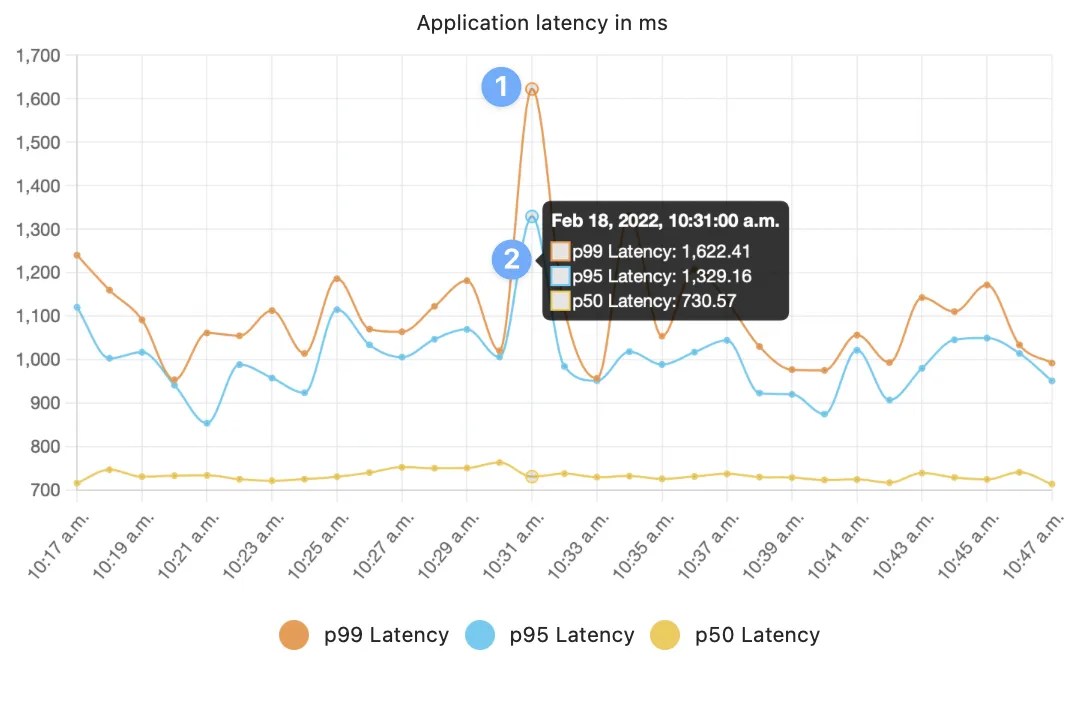
If your graph shows multiple data series, depending on what you want to highlight, you can enable or disable a specific data series by clicking it at the bottom of the chart. The following example disables the
p95latency: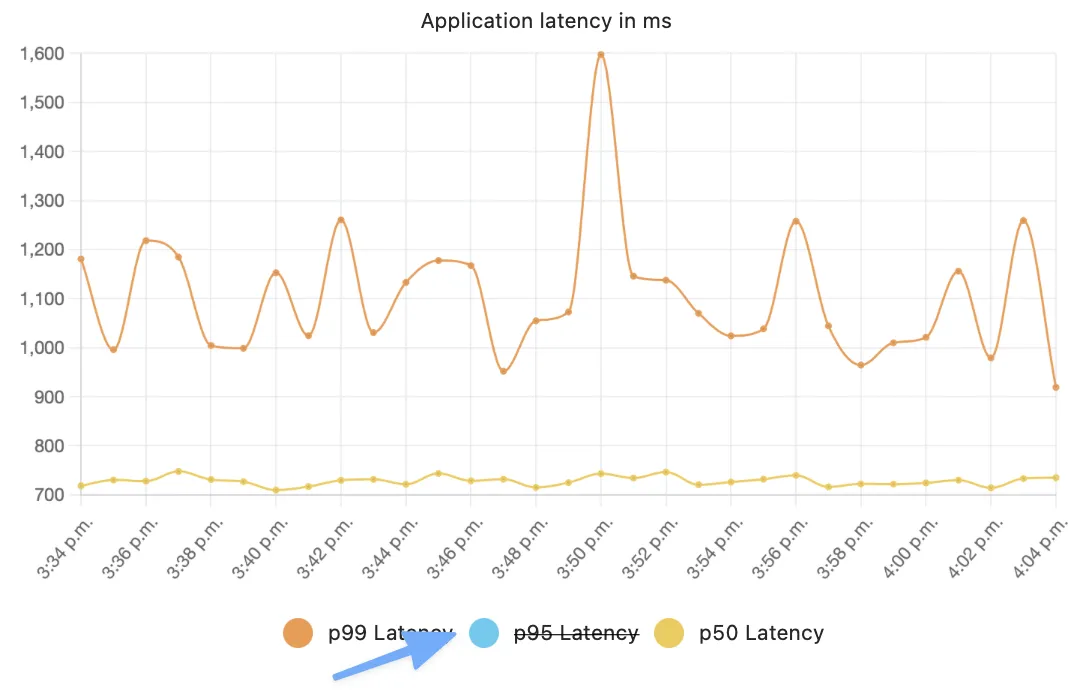 info
infoWhen you enable or disable a specific data series, the system could automatically change the scale of the vertical (value) axis.
If your graph shows application-related metrics, you can click a point on the graph and then select View Traces to open the Traces page for that specific point in time:
Entities
An entity represents a specific type of data, such as an alert. Each entity consists of a series of properties. For example, an alert is defined by a name, expression, period, and labels.
Navigation Elements
The following illustration shows the Metrics section and the primary navigation elements:
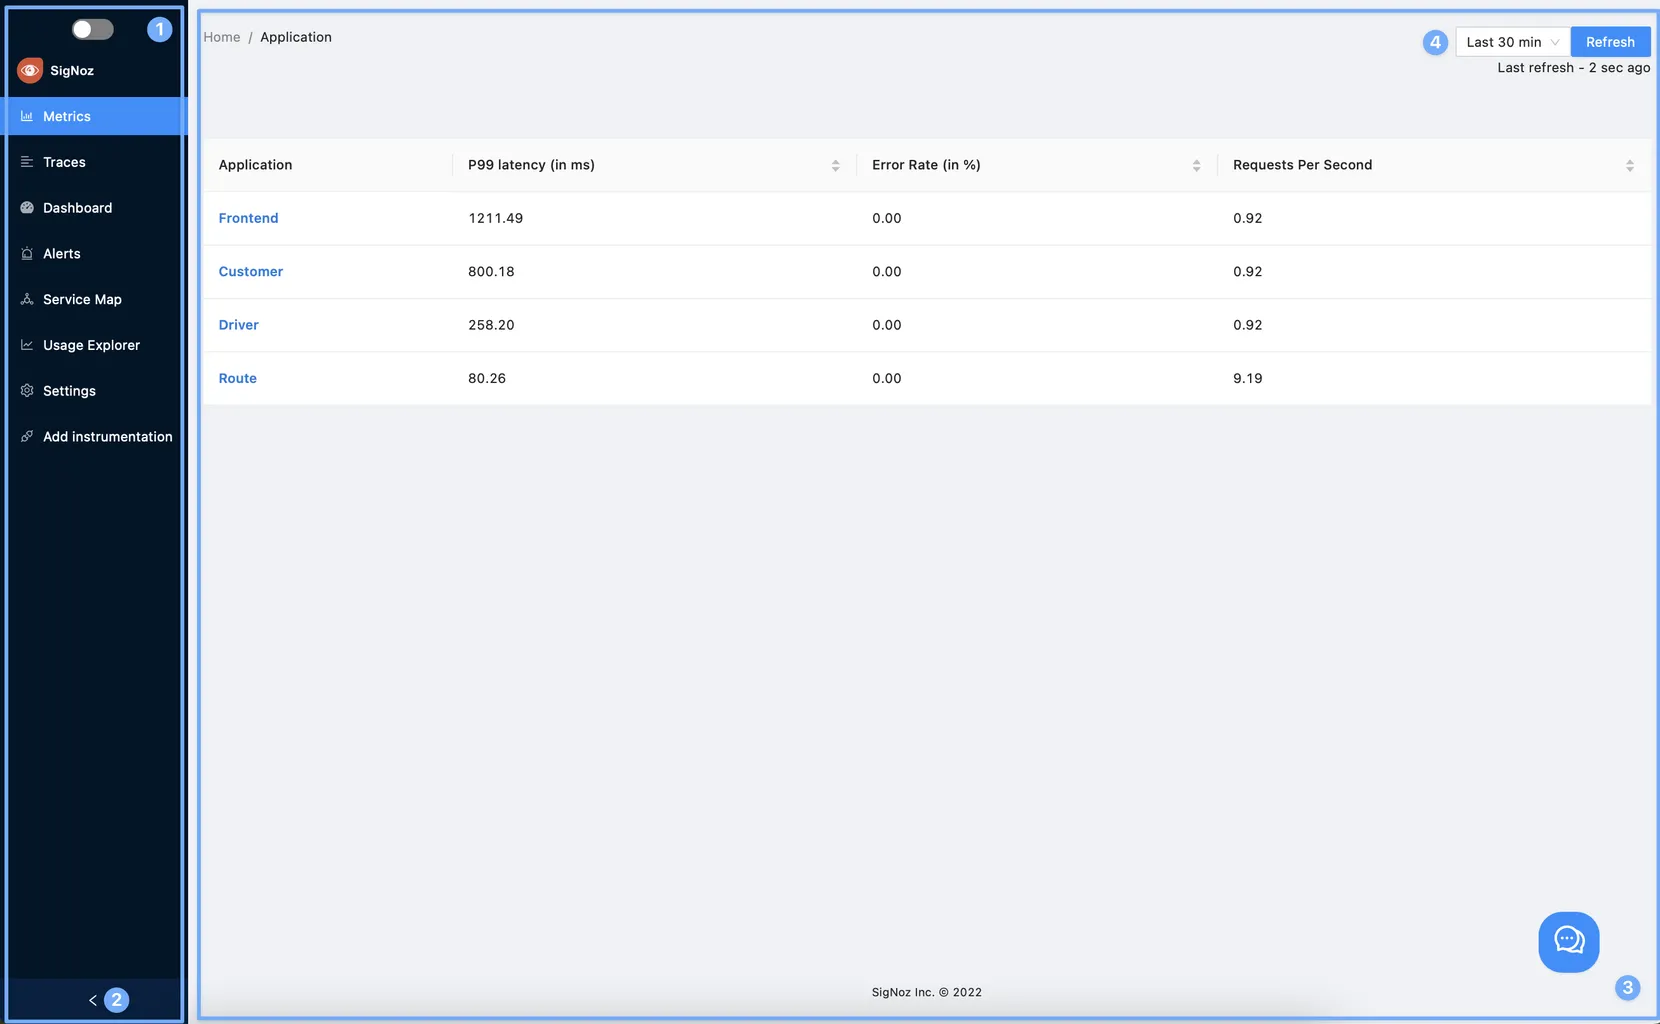
Legend:
- Sidebar: Lists all the sections. Select a section to open it. The current section is highlighted in blue.
- Expand/Collapse button: Select this button to collapse the sidebar, allowing more room for the main part of the page. If the sidebar is already collapsed, select this button to expand it again.
- Main body: This example shows the Metrics section.
- Global Time Period: With SigNoz, you can specify the time range for which you want to view data by setting the global time period. SigNoz allows you to either indicate a specific time range such as the last five minutes or specify a start and end date by selecting Custom from the drop-down menu:
 info
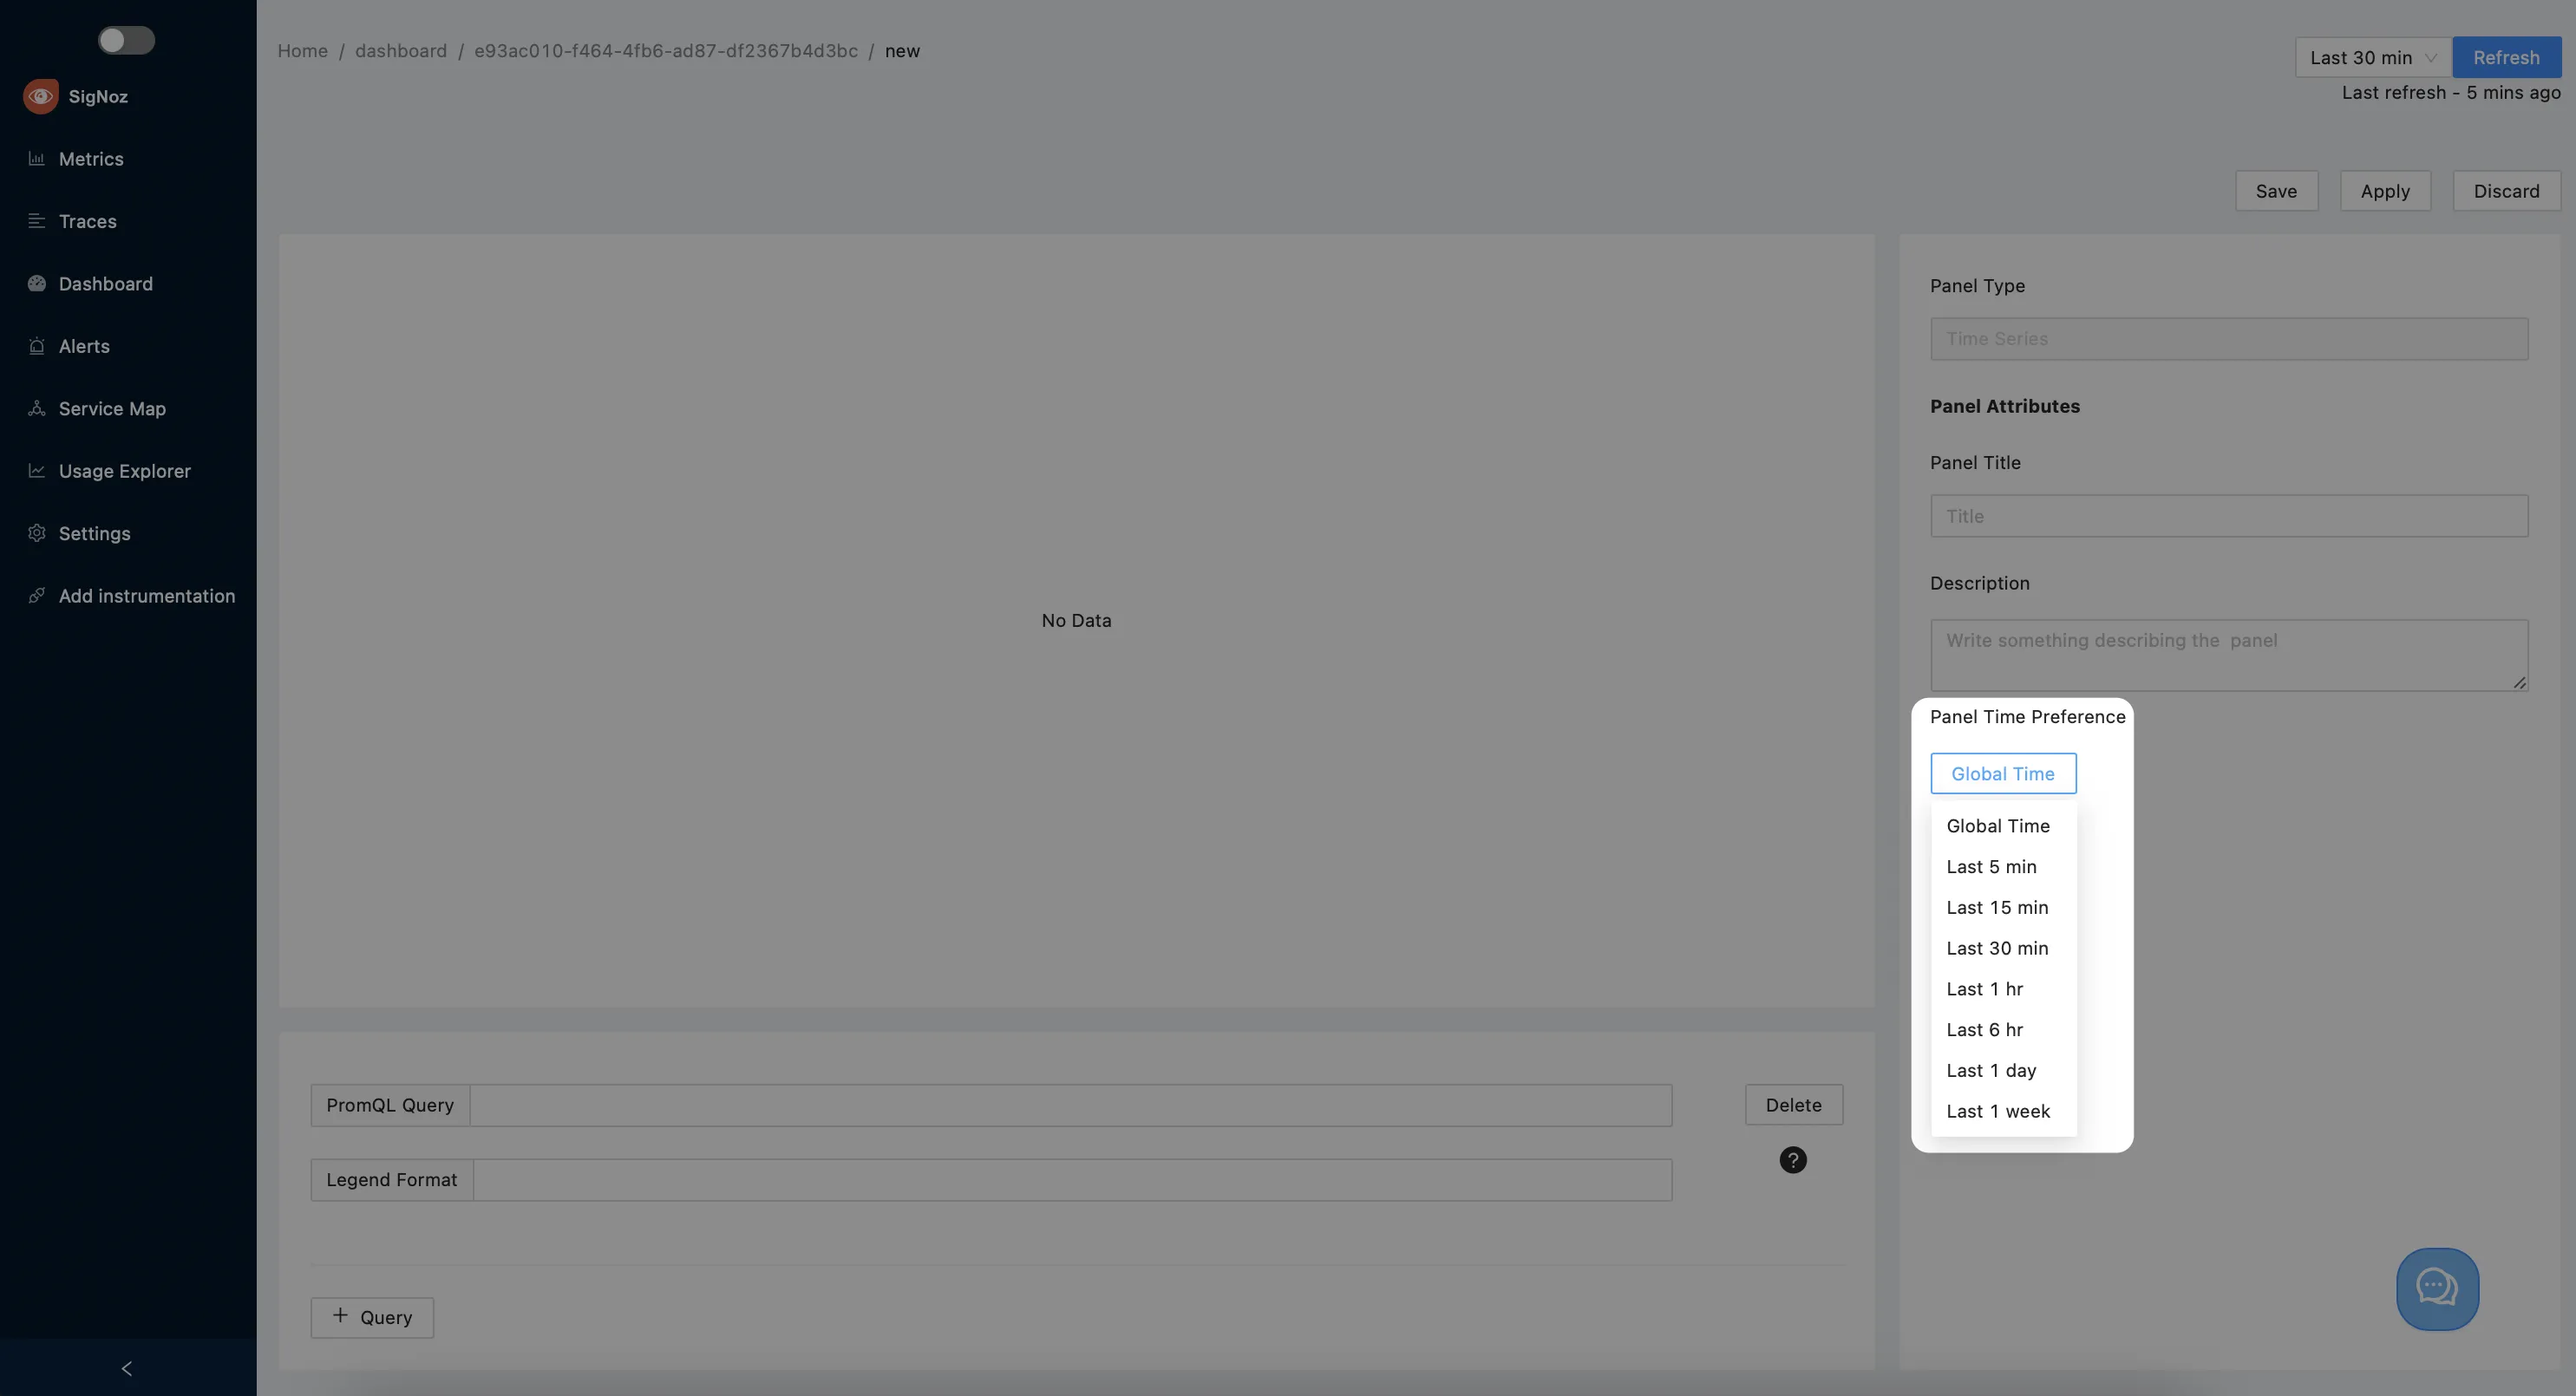
infoOn some pages, you can override the global time period. For example, when creating a custom graph, you can use the drop-down list under Panel Time Preferences to override the global time period:
