OpenTelemetry Operator Usage
Overview
In this tutorial, we would introduce OpenTelemetry Operator which makes it very easy to set up opentelemetry collector and instrument workloads deployed on Kubernetes.
A Kubernetes operator is a method of packaging, deploying, and managing a Kubernetes application. OpenTelemetry Operator helps a lot in managing OpenTelemetry collectors and enables auto-instrumentation.
Prerequisite
- Must have a K8s cluster up and running
- Must have
kubectlaccess to your cluster - Must have SigNoz running. You can follow the installation guide to install SigNoz.
- If you don’t already have a SigNoz Cloud account, you can sign up here.
- Make sure to install
cert-manager - Suggestion: Make sure Golang is installed for telemetrygen
Set up OpenTelemetry Operator
To install the operator in the existing K8s cluster:
kubectl apply -f https://github.com/open-telemetry/opentelemetry-operator/releases/download/v0.88.0/opentelemetry-operator.yaml
Once the opentelemetry-operator deployment is ready, we can proceed with creation of
OpenTelemetry Collector (otelcol) instance and autoinstrumentation.
Deployment Modes
There are 3 deployment modes available for OpenTelemetry Operator:
- Daemonset
- Sidecar
- Deployment (default mode)
The CustomResource of the OpenTelemetryCollector kind exposes a property named
.Spec.Mode, which can be used to specify whether the collector should run as a
DaemonSet, Sidecar, or Deployment (default).
Independent Deployment
To create simple instance of otelcol with Deployment mode, follow the instructions below:
kubectl apply -f - <<EOF
apiVersion: opentelemetry.io/v1alpha1
kind: OpenTelemetryCollector
metadata:
  name: simplest
spec:
  mode: deployment
  config: |
    receivers:
      otlp:
        protocols:
          grpc:
          http:
    processors:
      batch:
    exporters:
      logging:
    service:
      pipelines:
        traces:
          receivers: [otlp]
          processors: [batch]
          exporters: [logging]
EOF
The above simplest otelcol example receives OTLP traces data using gRPC and HTTP protocols,
batches the data and logs it to the console.
Follow the steps below to set up telemetrygen and send sample traces to the sample collector:
- To install
telemetrygenbinary:go install github.com/open-telemetry/opentelemetry-collector-contrib/cmd/telemetrygen@latest - To forward gRPC port of the OTLP service:
kubectl port-forward service/simplest-collector 4317 - In another terminal, execute the command below to send trace data
using
telemetrygen:telemetrygen traces --traces 1 --otlp-endpoint localhost:4317 --otlp-insecure
To view logs of simplest collector:
kubectl logs -l app.kubernetes.io/name=simplest-collector
Output should include the following:
2022-09-05T06:25:50.178Z INFO loggingexporter/logging_exporter.go:43 TracesExporter {"#spans": 2}
At last make sure to clean up the otelcol instance:
kubectl delete otelcol/simplest
Across the Nodes - DaemonSet
Similarly, OpenTelemetry Collector instance can be deployed with DaemonSet mode,
which ensures that all (or some) nodes run copy of the collector pod.
In case of DaemonSet, only Spec.Mode property would be updated to daemonset.
While config from the previous example of otelcol YAML can either be kept as it
is or updated as per the need.
DaemonSet is suitable for tasks such as log collection daemons, storage daemons,
and node monitoring daemons.
Sidecar Injection
A sidecar with the OpenTelemetry Collector can be injected into pod-based
workloads by setting the pod annotation sidecar.opentelemetry.io/inject
to either "true", or to the name of a concrete OpenTelemetryCollector
from the same namespace.
Here is an example to create a Sidecar with jaeger as input and logs
output to console:
kubectl apply -f - <<EOF
apiVersion: opentelemetry.io/v1alpha1
kind: OpenTelemetryCollector
metadata:
  name: my-sidecar
spec:
  mode: sidecar
  config: |
    receivers:
      jaeger:
        protocols:
          thrift_compact:
    processors:
    exporters:
      logging:
    service:
      pipelines:
        traces:
          receivers: [jaeger]
          processors: []
          exporters: [logging]
EOF
Next, let us create a Pod using jaeger example image and set
sidecar.opentelemetry.io/inject annotations to "true":
kubectl apply -f - <<EOF
apiVersion: v1
kind: Pod
metadata:
  name: myapp
  annotations:
    sidecar.opentelemetry.io/inject: "true"
spec:
  containers:
  - name: myapp
    image: jaegertracing/vertx-create-span:operator-e2e-tests
    ports:
      - containerPort: 8080
        protocol: TCP
EOF
To forward port 8080 of the myapp pod:
kubectl port-forward pod/myapp 8080:8080
In another terminal, let's send a HTTP request using curl:
curl http://localhost:8080
To log output of the Sidecar:
kubectl logs pod/myapp -c otc-container
Output should look something like this:
2022-09-05T16:51:37.753Z    info    service/collector.go:128    Everything is ready. Begin running and processing data.
2022-09-05T17:07:37.319Z    INFO    loggingexporter/logging_exporter.go:43  TracesExporter  {"#spans": 4}
2022-09-05T17:07:37.322Z    INFO    loggingexporter/logging_exporter.go:43  TracesExporter  {"#spans": 9}
At last, make sure to clean up: Sidecar and myapp pod:
To remove Sidecar collector named my-sidecar:
kubectl delete otelcol/my-sidecar
To remove myapp pod:
kubectl delete pod/myapp
OpenTelemetry Auto-instrumentation Injection
The OpenTelemetry operator can inject and configure OpenTelemetry auto-instrumentation libraries.
Instrumentation Resource Configuration
At the moment the instrumentation is supported for Java, NodeJS, Python, and DotNet languages. The instrumentation is enabled when the following annotation is applied to a workload or a namespace.
instrumentation.opentelemetry.io/inject-java: "true"— for Javainstrumentation.opentelemetry.io/inject-nodejs: "true"— for NodeJSinstrumentation.opentelemetry.io/inject-python: "true"— for Pythoninstrumentation.opentelemetry.io/inject-dotnet: "true"— for DotNetinstrumentation.opentelemetry.io/inject-sdk: "true"- for OpenTelemetry SDK environment variables only
The possible values for the annotation can be:
"true"- inject and Instrumentation resource from the namespace."my-instrumentation"- name of Instrumentation CR instance in the current namespace."my-other-namespace/my-instrumentation"- name and namespace of Instrumentation CR instance in another namespace."false"- do not inject.
Before using auto-instrumentation, we would need to configure an Instrumentation
resource with the configuration for the SDK and instrumentation.
Instrumentation consists of following properties:
exporter.endpoint- (optional) The address where telemetry data is to be sent in OTLP format.propagators- Enables all data sources to share an underlying context mechanism for storing state and accessing data across the lifespan of a transaction.sampler- Mechanism to control the noise and overhead introduced by reducing the number of samples of traces collected and sent to the backend. OpenTelemetry provides two types: StaticSampler and TraceIDRatioBased.Language properties i.e.
java,nodejs,pythonanddotnet- custom images to be used for auto-instrumentation with respect to the languages as set in the pod annotation.
Inject OpenTelemetry SDK Environment Variables OpenTelemetry
You can configure the OpenTelemetry SDK for applications which can't currently
be autoinstrumented by using inject-sdk in place of (e.g.) inject-python or
inject-java.
This will inject environment variables like OTEL_RESOURCE_ATTRIBUTES,
OTEL_TRACES_SAMPLER, and OTEL_EXPORTER_OTLP_ENDPOINT, that you can configure in the
Instrumentation, but will not actually provide the SDK.
Using Sidecar
To create a Sidecar which has OTLP receivers as input and as output
send telemetry data to SigNoz Collector as well logs to console.
Select the type of SigNoz instance you are running: SigNoz Cloud or Self-Hosted.
- SigNoz Cloud
- Self-Host
kubectl apply -f - <<EOF
apiVersion: opentelemetry.io/v1alpha1
kind: OpenTelemetryCollector
metadata:
  name: my-sidecar
spec:
  mode: sidecar
  config: |
    receivers:
      otlp:
        protocols:
          http:
          grpc:
    processors:
      batch:
    exporters:
      logging:
      otlp:
        endpoint: "ingest.{region}.signoz.cloud:443"
        tls:
          insecure: false
        headers:
          "signoz-access-token": "<SIGNOZ_INGESTION_KEY>"
    service:
      pipelines:
        traces:
          receivers: [otlp]
          processors: [batch]
          exporters: [logging, otlp]
        metrics:
          receivers: [otlp]
          processors: [batch]
          exporters: [logging, otlp]
EOF
Notes:
Replace
SIGNOZ_INGESTION_KEYwith the one provided by SigNoz.Replace
{region}with the region of your SigNoz Cloud instance. Refer to the table below for the region-specific endpoints:Region Endpoint US ingest.us.signoz.cloud:443 IN ingest.in.signoz.cloud:443 EU ingest.eu.signoz.cloud:443
kubectl apply -f - <<EOF
apiVersion: opentelemetry.io/v1alpha1
kind: OpenTelemetryCollector
metadata:
  name: my-sidecar
spec:
  mode: sidecar
  config: |
    receivers:
      otlp:
        protocols:
          http:
          grpc:
    processors:
      batch:
    exporters:
      logging:
      otlp:
        endpoint: http://my-release-signoz-otel-collector.platform.svc.cluster.local:4317
        tls:
          insecure: true
    service:
      pipelines:
        traces:
          receivers: [otlp]
          processors: [batch]
          exporters: [logging, otlp]
        metrics:
          receivers: [otlp]
          processors: [batch]
          exporters: [logging, otlp]
EOF
If you have SigNoz running in other Kubernetes (K8s) cluster or in a Virtual Machine (VM),
you should update the endpoint property to point at the appropriate OTLP address.
To create an instance of Instrumentation:
kubectl apply -f - <<EOF
apiVersion: opentelemetry.io/v1alpha1
kind: Instrumentation
metadata:
  name: my-instrumentation
spec:
  propagators:
    - tracecontext
    - baggage
    - b3
  sampler:
    type: parentbased_always_on
  java:
    image: ghcr.io/open-telemetry/opentelemetry-operator/autoinstrumentation-java:latest
  nodejs:
    image: ghcr.io/open-telemetry/opentelemetry-operator/autoinstrumentation-nodejs:latest
  python:
    image: ghcr.io/open-telemetry/opentelemetry-operator/autoinstrumentation-python:latest
  dotnet:
    image: ghcr.io/open-telemetry/opentelemetry-operator/autoinstrumentation-dotnet:latest
EOF
Now, we would have to set the pod annotations instrumentation.opentelemetry.io/inject-java
and sidecar.opentelemetry.io/inject to "true", for setting up auto-instrumentation of
workload deployed in the K8s. It would sends OTLP data to Sidecar which would in turn relay
it to SigNoz collector.
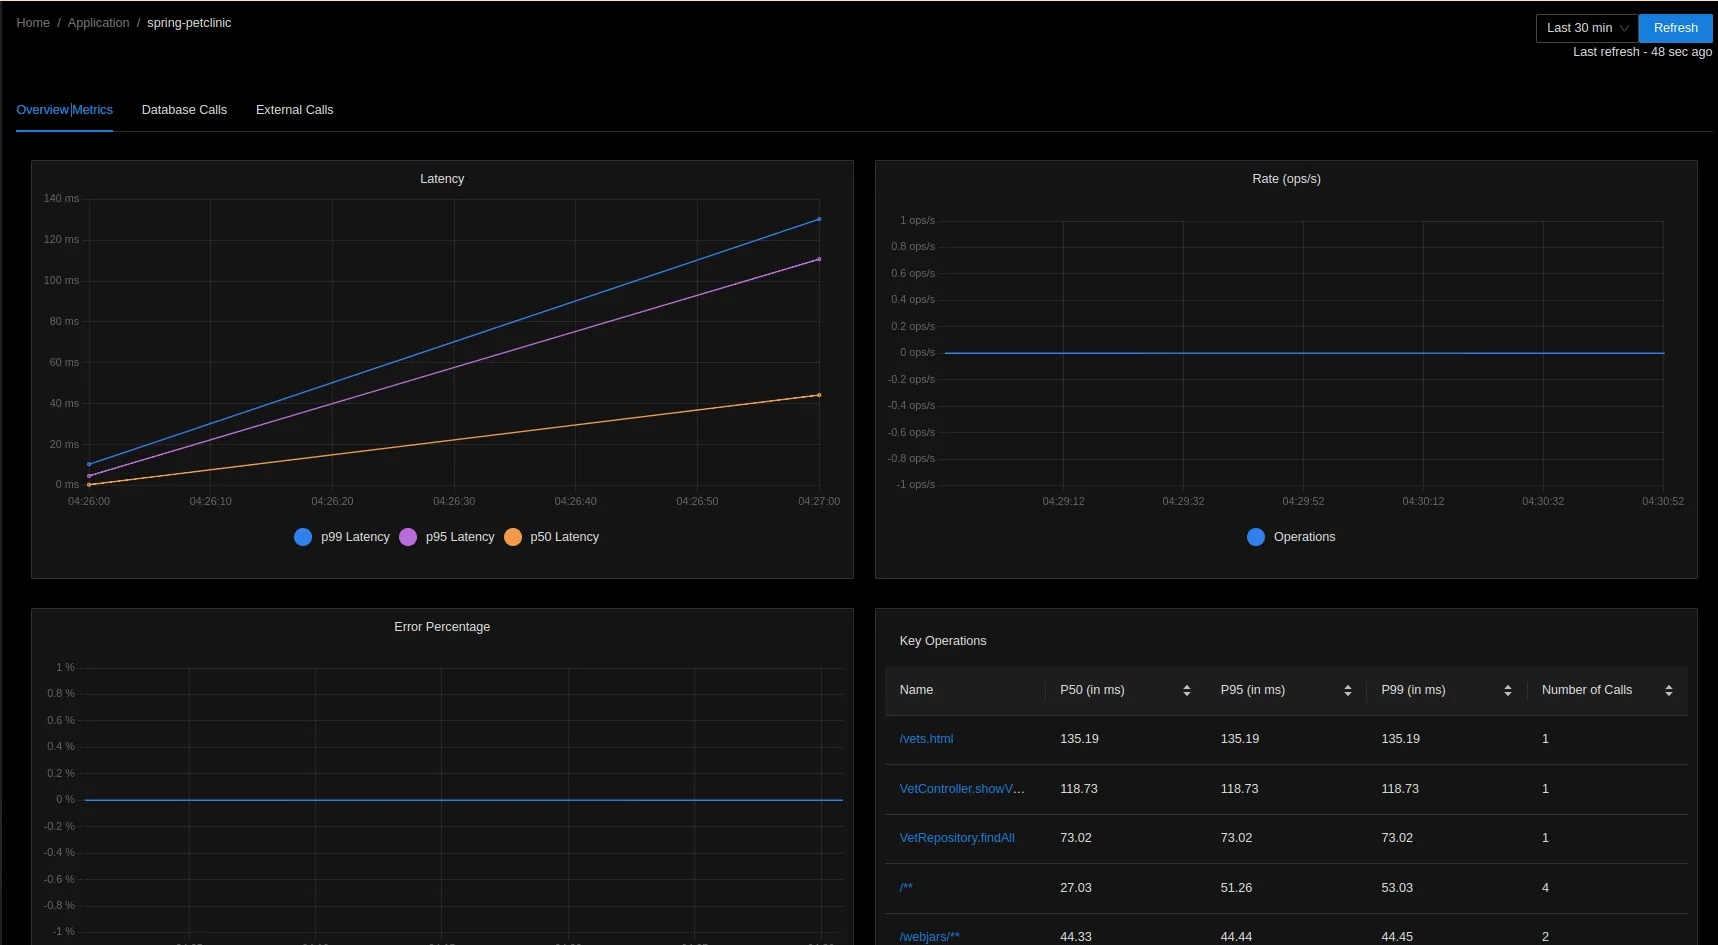
Here is an example of pet clinic with auto-instrumentation:
kubectl apply -f - <<EOF
apiVersion: apps/v1
kind: Deployment
metadata:
  name: spring-petclinic
spec:
  selector:
    matchLabels:
      app: spring-petclinic
  replicas: 1
  template:
    metadata:
      labels:
        app: spring-petclinic
      annotations:
        sidecar.opentelemetry.io/inject: "true"
        instrumentation.opentelemetry.io/inject-java: "true"
    spec:
      containers:
      - name: app
        image: ghcr.io/pavolloffay/spring-petclinic:latest
EOF
We can enable auto-instrumentation to the deployed workloads by simply adding
instrumentation.opentelemetry.io/inject-{language} pod annotations.
To obtain name of the Pet Clinic pod:
export POD_NAME=$(kubectl get pod -l app=spring-petclinic -o jsonpath="{.items[0].metadata.name}")
To forward port 8080 of the Pet Clinic pod:
kubectl port-forward ${POD_NAME} 8080:8080
Now, let's use Pet Clinic UI for a while in browser to generate telemetry data: http://localhost:8080.

At last, we can clean it all up:
To remove spring-petclinic deployment:
kubectl delete deployment/spring-petclinic
To remove OpenTelemetry Instrumentation:
kubectl delete instrumentation/my-instrumentation
To remove Sidecar instance of otelcol:
kubectl delete otelcol/my-sidecar
Auto-instrumentation without Sidecar
To create an instance of Instrumentation which sends OTLP data to SigNoz endpoint:
Select the type of SigNoz instance you are running: SigNoz Cloud or Self-Hosted.
- SigNoz Cloud
- Self-Host
- K8s-Infra Helm Chart
kubectl apply -f - <<EOF
apiVersion: opentelemetry.io/v1alpha1
kind: Instrumentation
metadata:
  name: my-instrumentation
spec:
  exporter:
    endpoint: https://ingest.{region}.signoz.cloud:443
  env:
    - name: OTEL_EXPORTER_OTLP_HEADERS
      value: signoz-access-token=<SIGNOZ_INGESTION_KEY>
    - name: OTEL_EXPORTER_OTLP_INSECURE
      value: "false"
  propagators:
    - tracecontext
    - baggage
    - b3
  sampler:
    type: parentbased_traceidratio
    argument: "0.25"
  java:
    image: ghcr.io/open-telemetry/opentelemetry-operator/autoinstrumentation-java:latest
  nodejs:
    image: ghcr.io/open-telemetry/opentelemetry-operator/autoinstrumentation-nodejs:latest
  python:
    image: ghcr.io/open-telemetry/opentelemetry-operator/autoinstrumentation-python:latest
  dotnet:
    image: ghcr.io/open-telemetry/opentelemetry-operator/autoinstrumentation-dotnet:latest
EOF
Notes:
Replace
SIGNOZ_INGESTION_KEYwith the one provided by SigNoz.Replace
{region}with the region of your SigNoz Cloud instance. Refer to the table below for the region-specific endpoints:Region Endpoint US ingest.us.signoz.cloud:443 IN ingest.in.signoz.cloud:443 EU ingest.eu.signoz.cloud:443
kubectl apply -f - <<EOF
apiVersion: opentelemetry.io/v1alpha1
kind: Instrumentation
metadata:
  name: my-instrumentation
spec:
  exporter:
    endpoint: http://my-release-signoz-otel-collector.platform.svc.cluster.local:4317
  propagators:
    - tracecontext
    - baggage
    - b3
  sampler:
    type: parentbased_traceidratio
    argument: "0.25"
  java:
    image: ghcr.io/open-telemetry/opentelemetry-operator/autoinstrumentation-java:latest
  nodejs:
    image: ghcr.io/open-telemetry/opentelemetry-operator/autoinstrumentation-nodejs:latest
  python:
    image: ghcr.io/open-telemetry/opentelemetry-operator/autoinstrumentation-python:latest
  dotnet:
    image: ghcr.io/open-telemetry/opentelemetry-operator/autoinstrumentation-dotnet:latest
EOF
If you have SigNoz running in other Kubernetes (K8s) cluster or in a Virtual Machine (VM),
you should update the endpoint property to point at the appropriate OTLP address.
kubectl apply -f - <<EOF
apiVersion: opentelemetry.io/v1alpha1
kind: Instrumentation
metadata:
  name: my-instrumentation
spec:
  exporter:
    endpoint: http://\$(OTEL_HOST_IP):4317
  env:
    - name: OTEL_HOST_IP
      valueFrom:
        fieldRef:
          fieldPath: status.hostIP
  propagators:
    - tracecontext
    - baggage
    - b3
  sampler:
    type: parentbased_traceidratio
    argument: "0.25"
  java:
    image: ghcr.io/open-telemetry/opentelemetry-operator/autoinstrumentation-java:latest
  nodejs:
    image: ghcr.io/open-telemetry/opentelemetry-operator/autoinstrumentation-nodejs:latest
  python:
    image: ghcr.io/open-telemetry/opentelemetry-operator/autoinstrumentation-python:latest
  dotnet:
    image: ghcr.io/open-telemetry/opentelemetry-operator/autoinstrumentation-dotnet:latest
EOF
In the above example, we will use downward API of Kubernetes to get host IP of otel-agent
DaemonSet of K8s-Infra Helm Chart and use it as OTEL_HOST_IP environment variable.
Using this, we can send telemetry data to otel-agent which would in turn relay it to
any desired collector endpoint as per the configuration of otel-agent.
We would just have set the pod annotation instrumentation.opentelemetry.io/inject-java
to "true" for our Java Springboot workload deployed in K8s.
Here is an example of pet clinic with auto-instrumentation:
kubectl apply -f - <<EOF
apiVersion: apps/v1
kind: Deployment
metadata:
  name: spring-petclinic
spec:
  selector:
    matchLabels:
      app: spring-petclinic
  replicas: 1
  template:
    metadata:
      labels:
        app: spring-petclinic
      annotations:
        instrumentation.opentelemetry.io/inject-java: "true"
    spec:
      containers:
      - name: app
        image: ghcr.io/pavolloffay/spring-petclinic:latest
EOF
We can enable auto-instrumentation to the deployed workloads by simply adding
instrumentation.opentelemetry.io/inject-{language} pod annotations.
To obtain name of the Pet Clinic pod:
export POD_NAME=$(kubectl get pod -l app=spring-petclinic -o jsonpath="{.items[0].metadata.name}")
To forward port 8080 of the Pet Clinic pod:
kubectl port-forward ${POD_NAME} 8080:8080
Now, let's use Pet Clinic UI for a while in browser to generate telemetry data: http://localhost:8080.

At last, we can clean it all up:
To remove spring-petclinic deployment:
kubectl delete deployment/spring-petclinic
To remove OpenTelemetry Instrumentation:
kubectl delete instrumentation/my-instrumentation