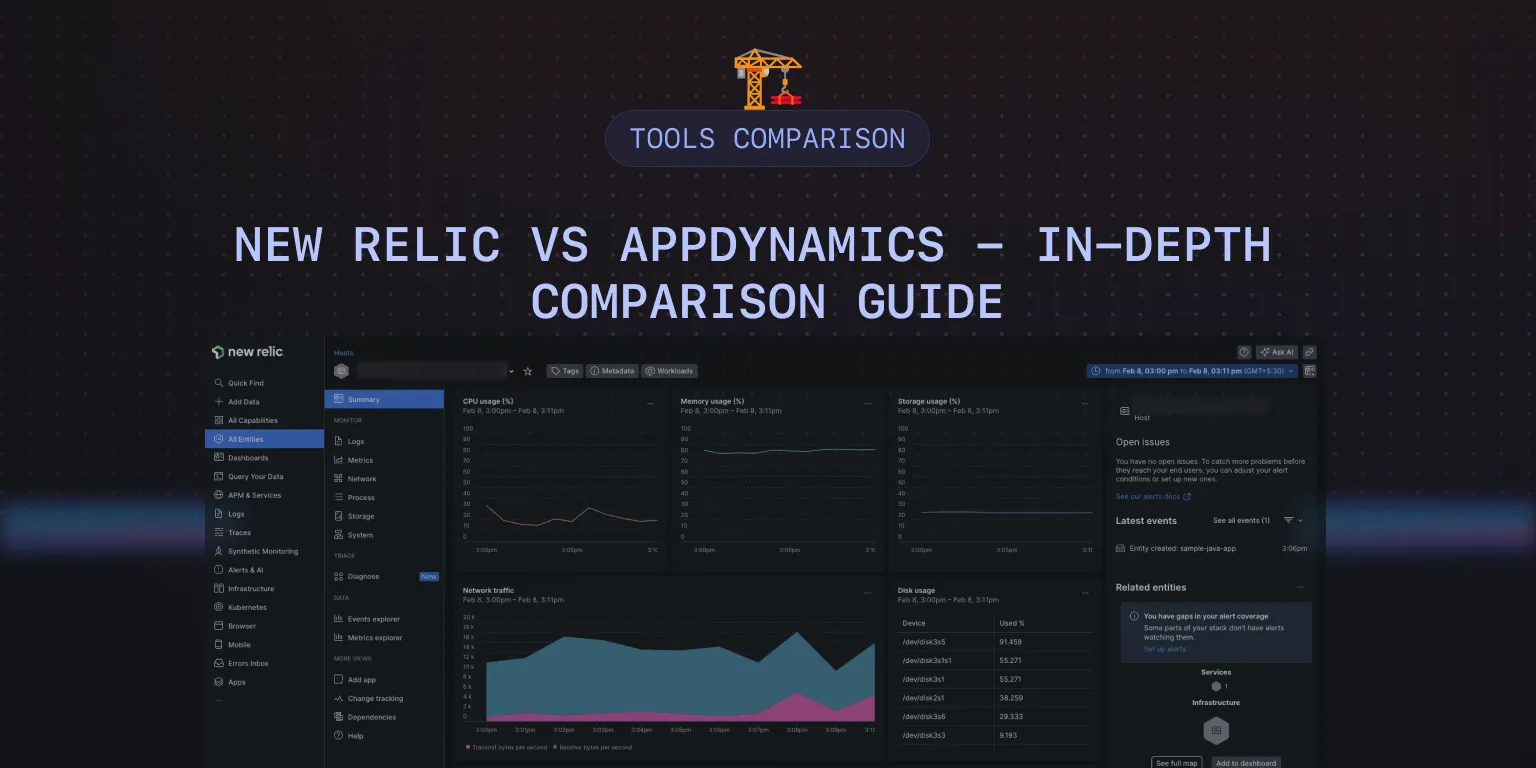
New Relic vs AppDynamics - In-Depth Comparison Guide [2024]
Both New Relic and AppDynamics are observability and monitoring tools that provide insights into the performance and health of applications, infrastructure, and services.
New Relic is a cloud-based observability platform that provides real-time analytics, distributed tracing, and application performance monitoring (APM) capabilities. AppDynamics, on the other hand, is a full-stack application performance management (APM) solution that offers deep insights into application performance, user experience, and business performance.

One thing to note between both tools is that New Relic is better suited for small to medium-sized businesses while AppDynamics is well-suited for large enterprises.
New Relic vs AppDynamics: At a glance
| Features | New Relic | AppDynamics |
|---|---|---|
| APM | ✅ | ✅ |
| Log management | ✅ | ✅ |
| Application Security | 🟡 | ✅ |
| Infrastructure Monitoring | ✅ | ✅ |
| Network Monitoring | ✅ | ✅ |
| Real-User Monitoring | 🟡 | ✅ |
| Synthetic Monitoring | 🟡 | ✅ |
| Open-Telemetry Support | ✅ | ✅ |
| SLA Monitoring | ✅ | 🟡 |
| Free Forever Plan | ✅ | ❌ |
✅ - Available
❌ - Not Available
🟡 - Limited
What is New Relic?
New Relic is a cloud-based full-stack observability platform that provides real-time insights into the performance and behavior of systems. It offers a comprehensive suite of tools for monitoring, alerting, and troubleshooting, aiming to eliminate silos for data, tools, and teams.

Key features of New Relic
- Application Performance Monitoring (APM)
New Relic provides robust APM capabilities, offering real-time insights into application performance and user experience. It enables teams to quickly identify and resolve performance issues. - Real User Monitoring (RUM)
New Relic's RUM feature captures detailed insights into user interactions, providing real-time analytics for understanding and optimizing the user experience. - Dashboards and Visualizations
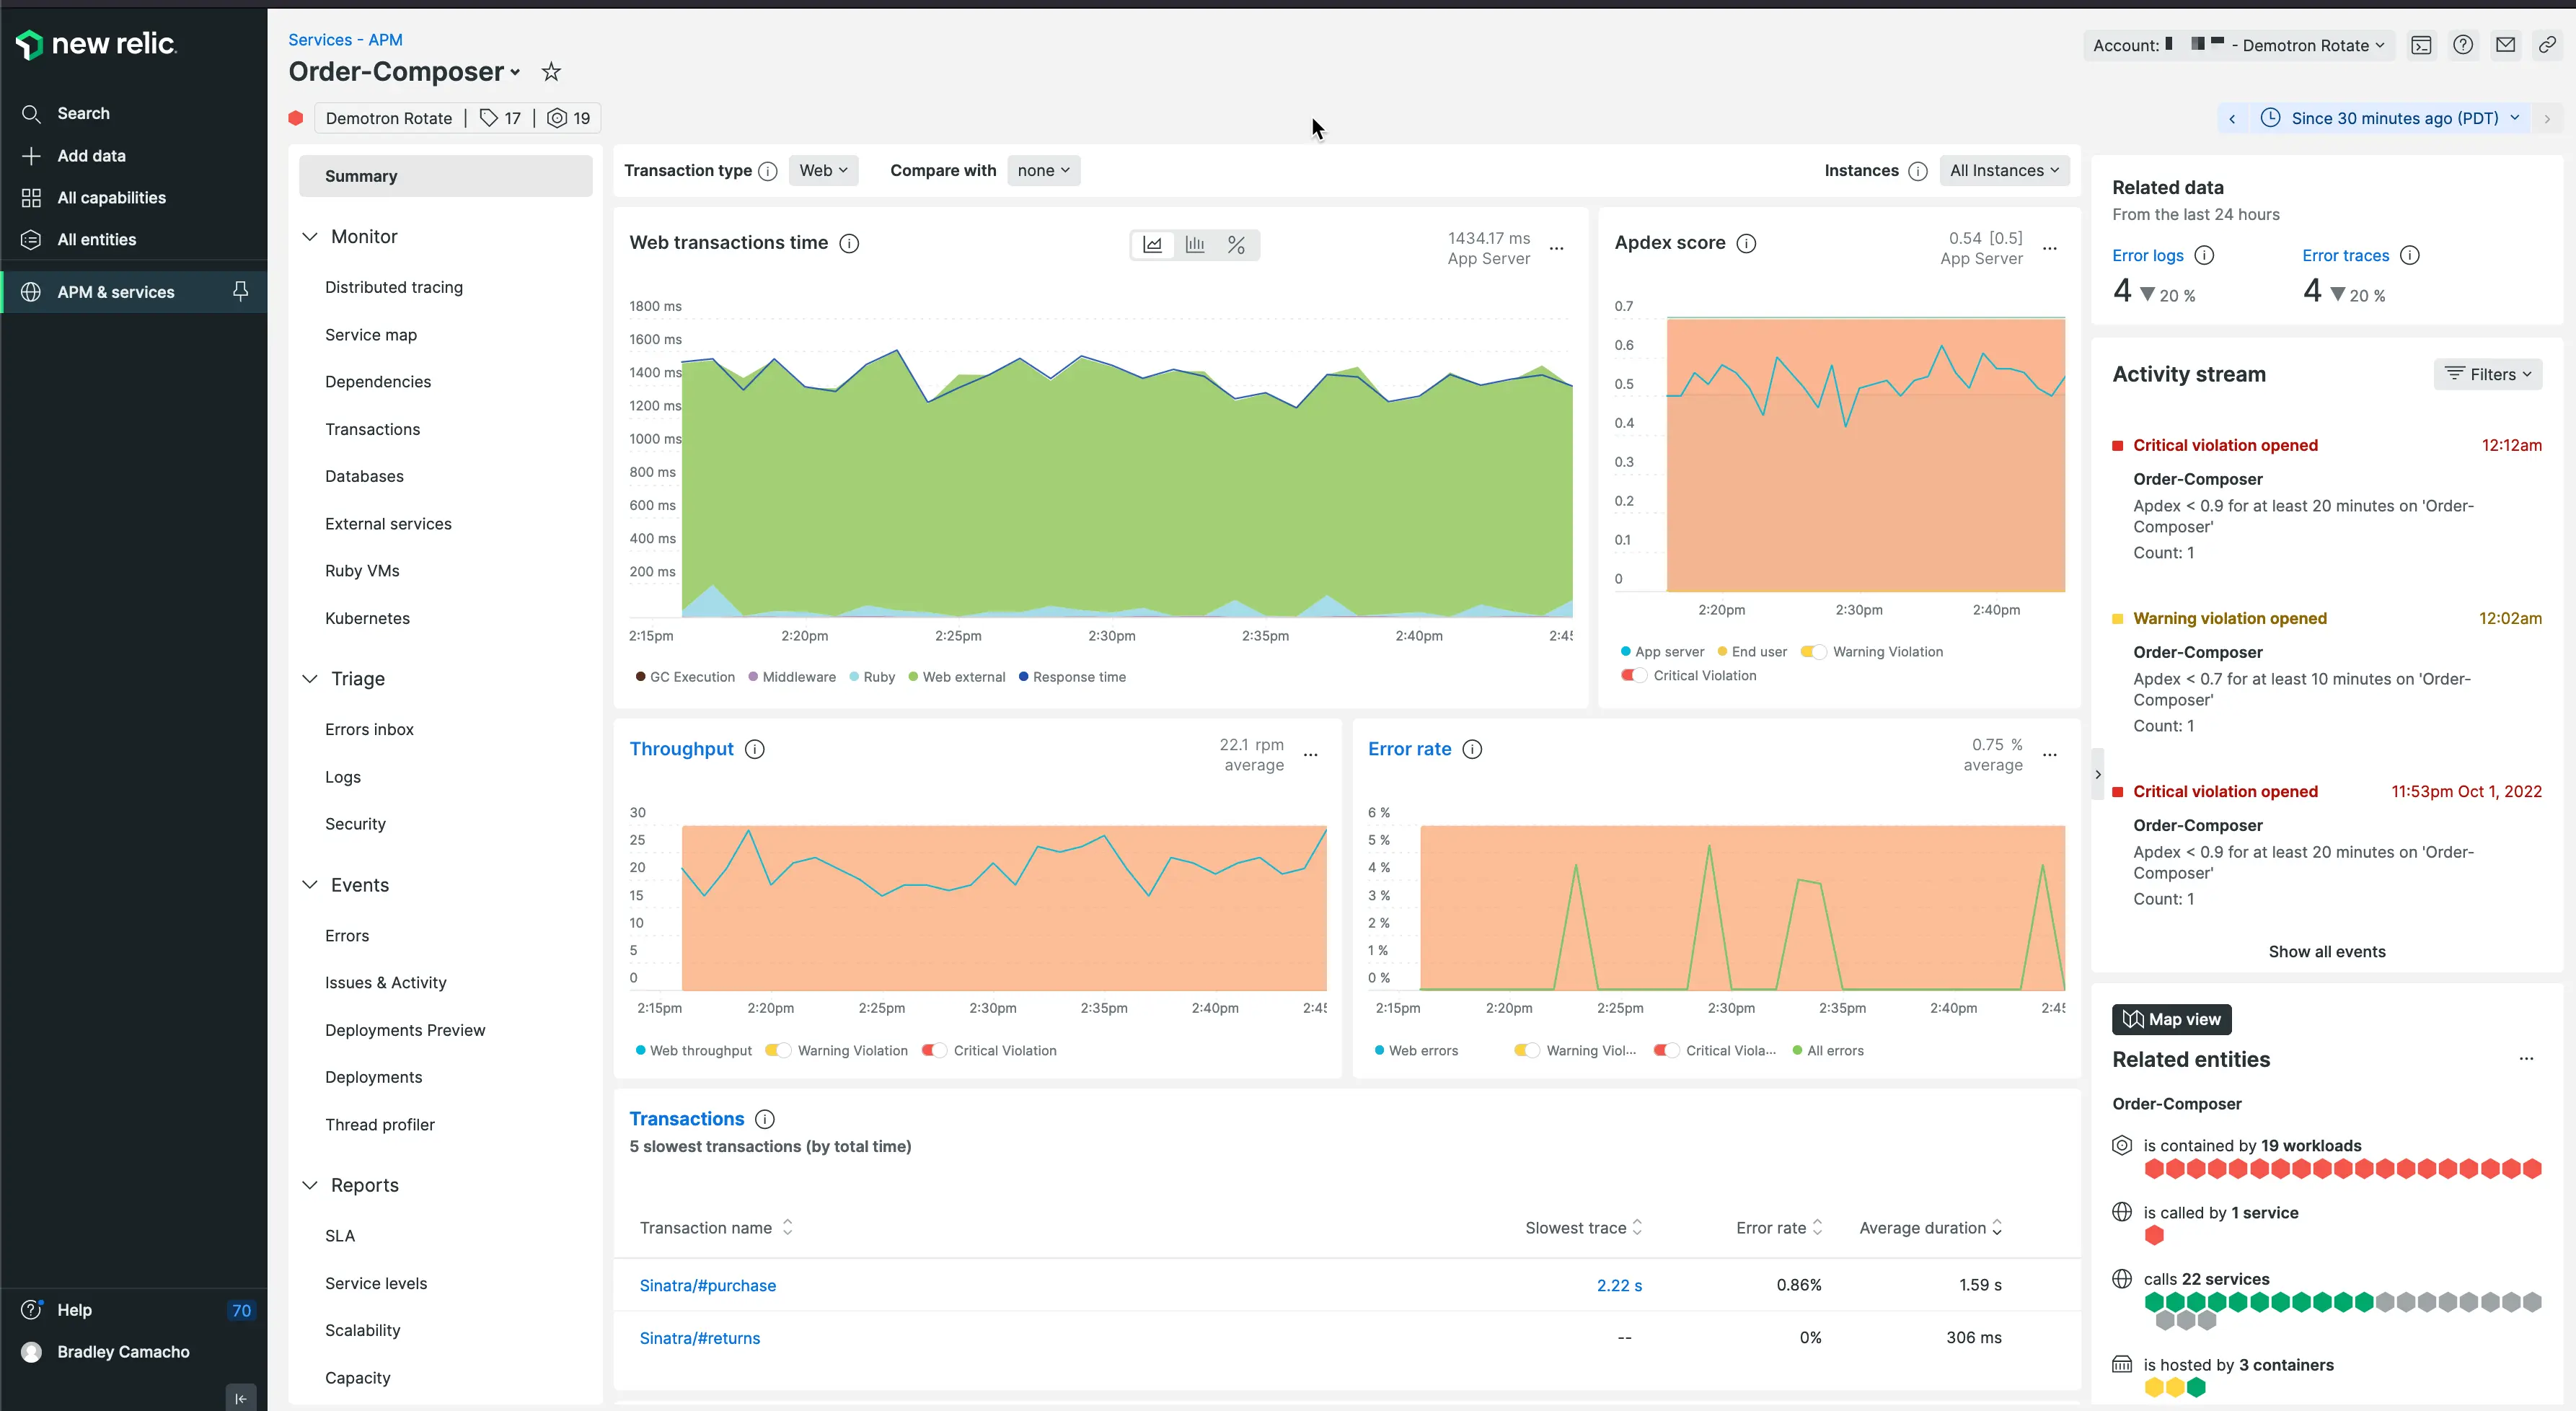
New Relic has an intuitive UI and comes with pre-configured monitoring dashboards. It also allows for the creation of custom dashboards to monitor important metrics. Additionally, it offers a range of visualization options for understanding and analyzing application data efficiently. - Incident Alerting
New Relic’s incident alerting feature quickly notifies teams about performance anomalies, allowing for immediate resolution.
What is AppDynamics?
AppDynamics is a comprehensive full-stack observability and monitoring platform used by organizations to ensure the optimal performance and reliability of their software applications. It provides a wide range of tools for performance management and IT Operations analytics, offering visibility across all infrastructure components, including networks, servers, and containers. It also supports application performance monitoring, database monitoring, SAP monitoring, and end-user monitoring, enabling businesses to identify performance bottlenecks, monitor production environments, and understand user experiences with their products. AppDynamics is optimized for production environments to ensure minimal performance overhead.

Key Features of AppDynamics
- End-User Monitoring
AppDynamics end-user monitoring feature offers visibility into how users interact with applications from various devices, browsers, and locations for optimizing application performance accordingly. - Dashboards and Visualizations
AppDynamics also allows for the creation of custom dashboards, but it allows for more customization and - Application Performance Monitoring
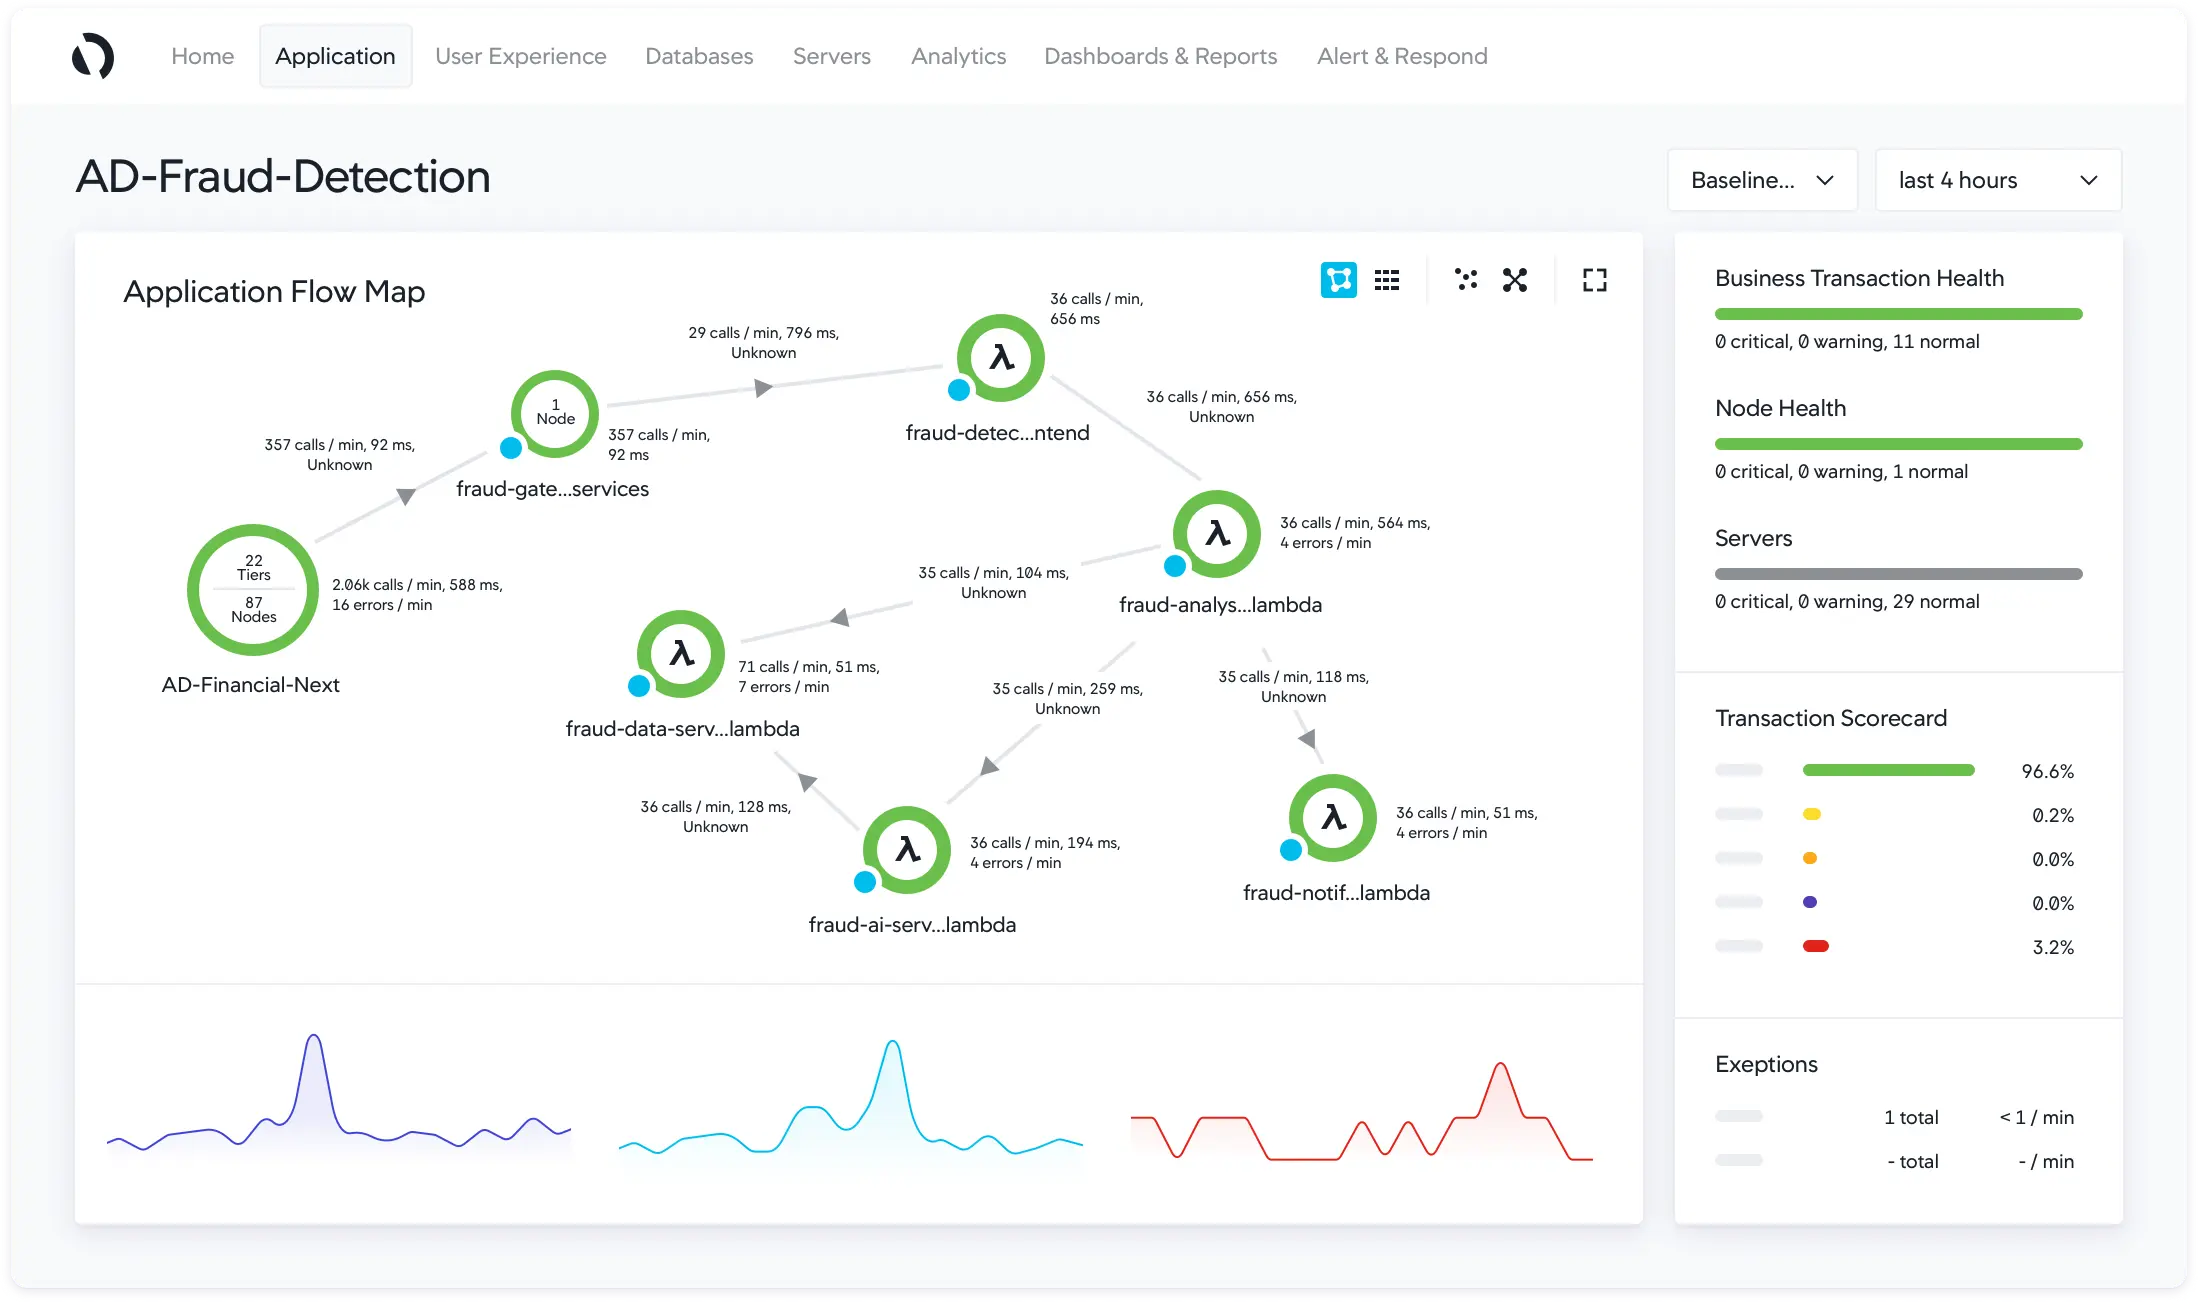
AppDynamics enables real-time monitoring of both business and application performance. It includes an auto-discovery feature that automatically identifies and displays the status of connected devices and applications. This feature uses color-coding to visually indicate the health status of each component, allowing for quick identification of any faults or issues. - Synthetic monitoring
AppDynamics' Synthetic Monitoring feature is designed to actively test applications by simulating user behavior, thereby establishing baselines and measuring performance in a controlled environment.
New Relic vs AppDynamics: Key Differences
- Application Security
New Relic offers features focused on application security such as real-time threat detection, application security monitoring, and compliance reporting. On the other hand, AppDynamics provides robust application security features including runtime application self-protection (RASP), code-level security insights, and advanced anomaly detection to identify and mitigate security threats in real-time. - Pricing
New Relic utilizes a user-based pricing model where the cost is determined by the number of users or licenses purchased. This is quite expensive but is generally considered more affordable in contrast to AppDynamics. New Relic provides a free forever plan with 100 GB of free data ingest per month for users looking to test the platform. AppDynamics uses an SKU pricing model which is based on licensed units per CPU Core, with different packages available to cater to various needs, including Infrastructure Monitoring, Premium, and Enterprise packages. The pricing can immediately get expensive considering the cost of monitoring a large number of CPU Cores. AppDynamics doesn’t provide a free forever plan like New Relic but it offers a free 15-day trial period for users to explore the platform before committing to a purchase. - Synthetic monitoring
AppDynamics does synthetic monitoring better than New Relic this is because New Relic collects data from real users only while AppDynamics collects data from both real users and synthetic users. This dual data collection method enhances the accuracy and reliability of performance insights, identifying and addressing potential issues before they impact end users.
New Relic vs AppDynamics: Final Verdict
If you are wondering when to choose New Relic over AppDynamics or vice versa, we have provided a use-case-based guide to help you understand what each tool provides better than the other:
- For large enterprise end-to-end monitoring needs, choose AppDynamics.
- For small and medium-sized businesses requiring application performance monitoring, choose New Relic.
- If you want a more cost-effective tool, choose New Relic.
- For deep visibility into your systems and services, choose AppDynamics.
SigNoz: A New Relic and AppDynamics alternative
SigNoz is a good alternative to consider when looking for a New Relic and AppDynamics alternative. It is an open-source, full-stack APM tool designed to cater to the needs of businesses looking for a flexible, cost-effective, and vendor-agnostic solution for application performance monitoring.
Here are some things you can do with SigNoz:
- Visualise Traces, Metrics, and Logs in a single pane of glass
- Monitor application metrics like p99 latency, error rates for your services, external API calls, and individual endpoints.
- Find the root cause of the problem by going to the exact traces which are causing the problem and see detailed flamegraphs of individual request traces.
- Run aggregates on trace data to get business-relevant metrics
- Filter and query logs, build dashboards and alerts based on attributes in logs
- Monitor infrastructure metrics such as CPU utilization or memory usage
- Record exceptions automatically in Python, Java, Ruby, and Javascript
- Easy to set alerts with DIY query builder
Getting Started with SigNoz
SigNoz cloud is the easiest way to run SigNoz. Sign up for a free account and get 30 days of unlimited access to all features.
You can also install and self-host SigNoz yourself since it is open-source. With 16,000+ GitHub stars, open-source SigNoz is loved by developers. Find the instructions to self-host SigNoz.
Further Reading:


