Datadog vs Dynatrace - In-Depth Comparison 2024 [Hands-On Testing]
Datadog and Dynatrace are popular tools when it comes to monitoring and observability. In this article I have compared Datadog and Dynatrace across different aspects like getting started, infrastructure monitoring, log monitoring, pricing, etc.
💡 This article is my personal take based on the experience I had when integrating Datadog and Dynatrace. Some takeaways are subjective based on my personal preference
Datadog vs Dynatrace: Overview
Here’s a comparison of the main features between Datadog and Dynatrace.
| Feature | Datadog | Dynatrace |
|---|---|---|
| Infrastructure monitoring | ✅ | ✅ |
| APM | ✅ | ✅ |
| Log monitoring | ✅ | ✅ |
| Real-User monitoring | ✅ | ✅ |
| SLA Monitoring | ✅ | ✅ |
| OpenTelemetry support | 🟡 | ✅ |
| Free tier | ❌ | ❌ |
| On premise | ❌ | ✅ |
| Cloud SIEM | ✅ | 🟡 |
| Workflow Automation | ✅ | ✅ |
| AIOps | ✅ | ✅ |
| Access control | ✅ | ✅ |
✅ - Available
❌ - Not Available
🟡 - Limited
Datadog vs Dynatrace: Testing Environment
In this hands-on test, I used a Python application that was connected to a MongoDB database. In order to have a level playing field, I did not want to host them on my own machine. Instead, I opted for t2.micro EC2 instances from AWS. These come with 1 vCPU and 1 GiB of RAM. For storage, I opted for 8 GB.
I created 2 EC2 instances (one for testing Datadog, the other for Dynatrace). Next, I installed MongoDB and had my Python application running in both. After a round of basic testing to see if everything was working fine, it was time to collect some metrics.`
Sign up Process
Datadog
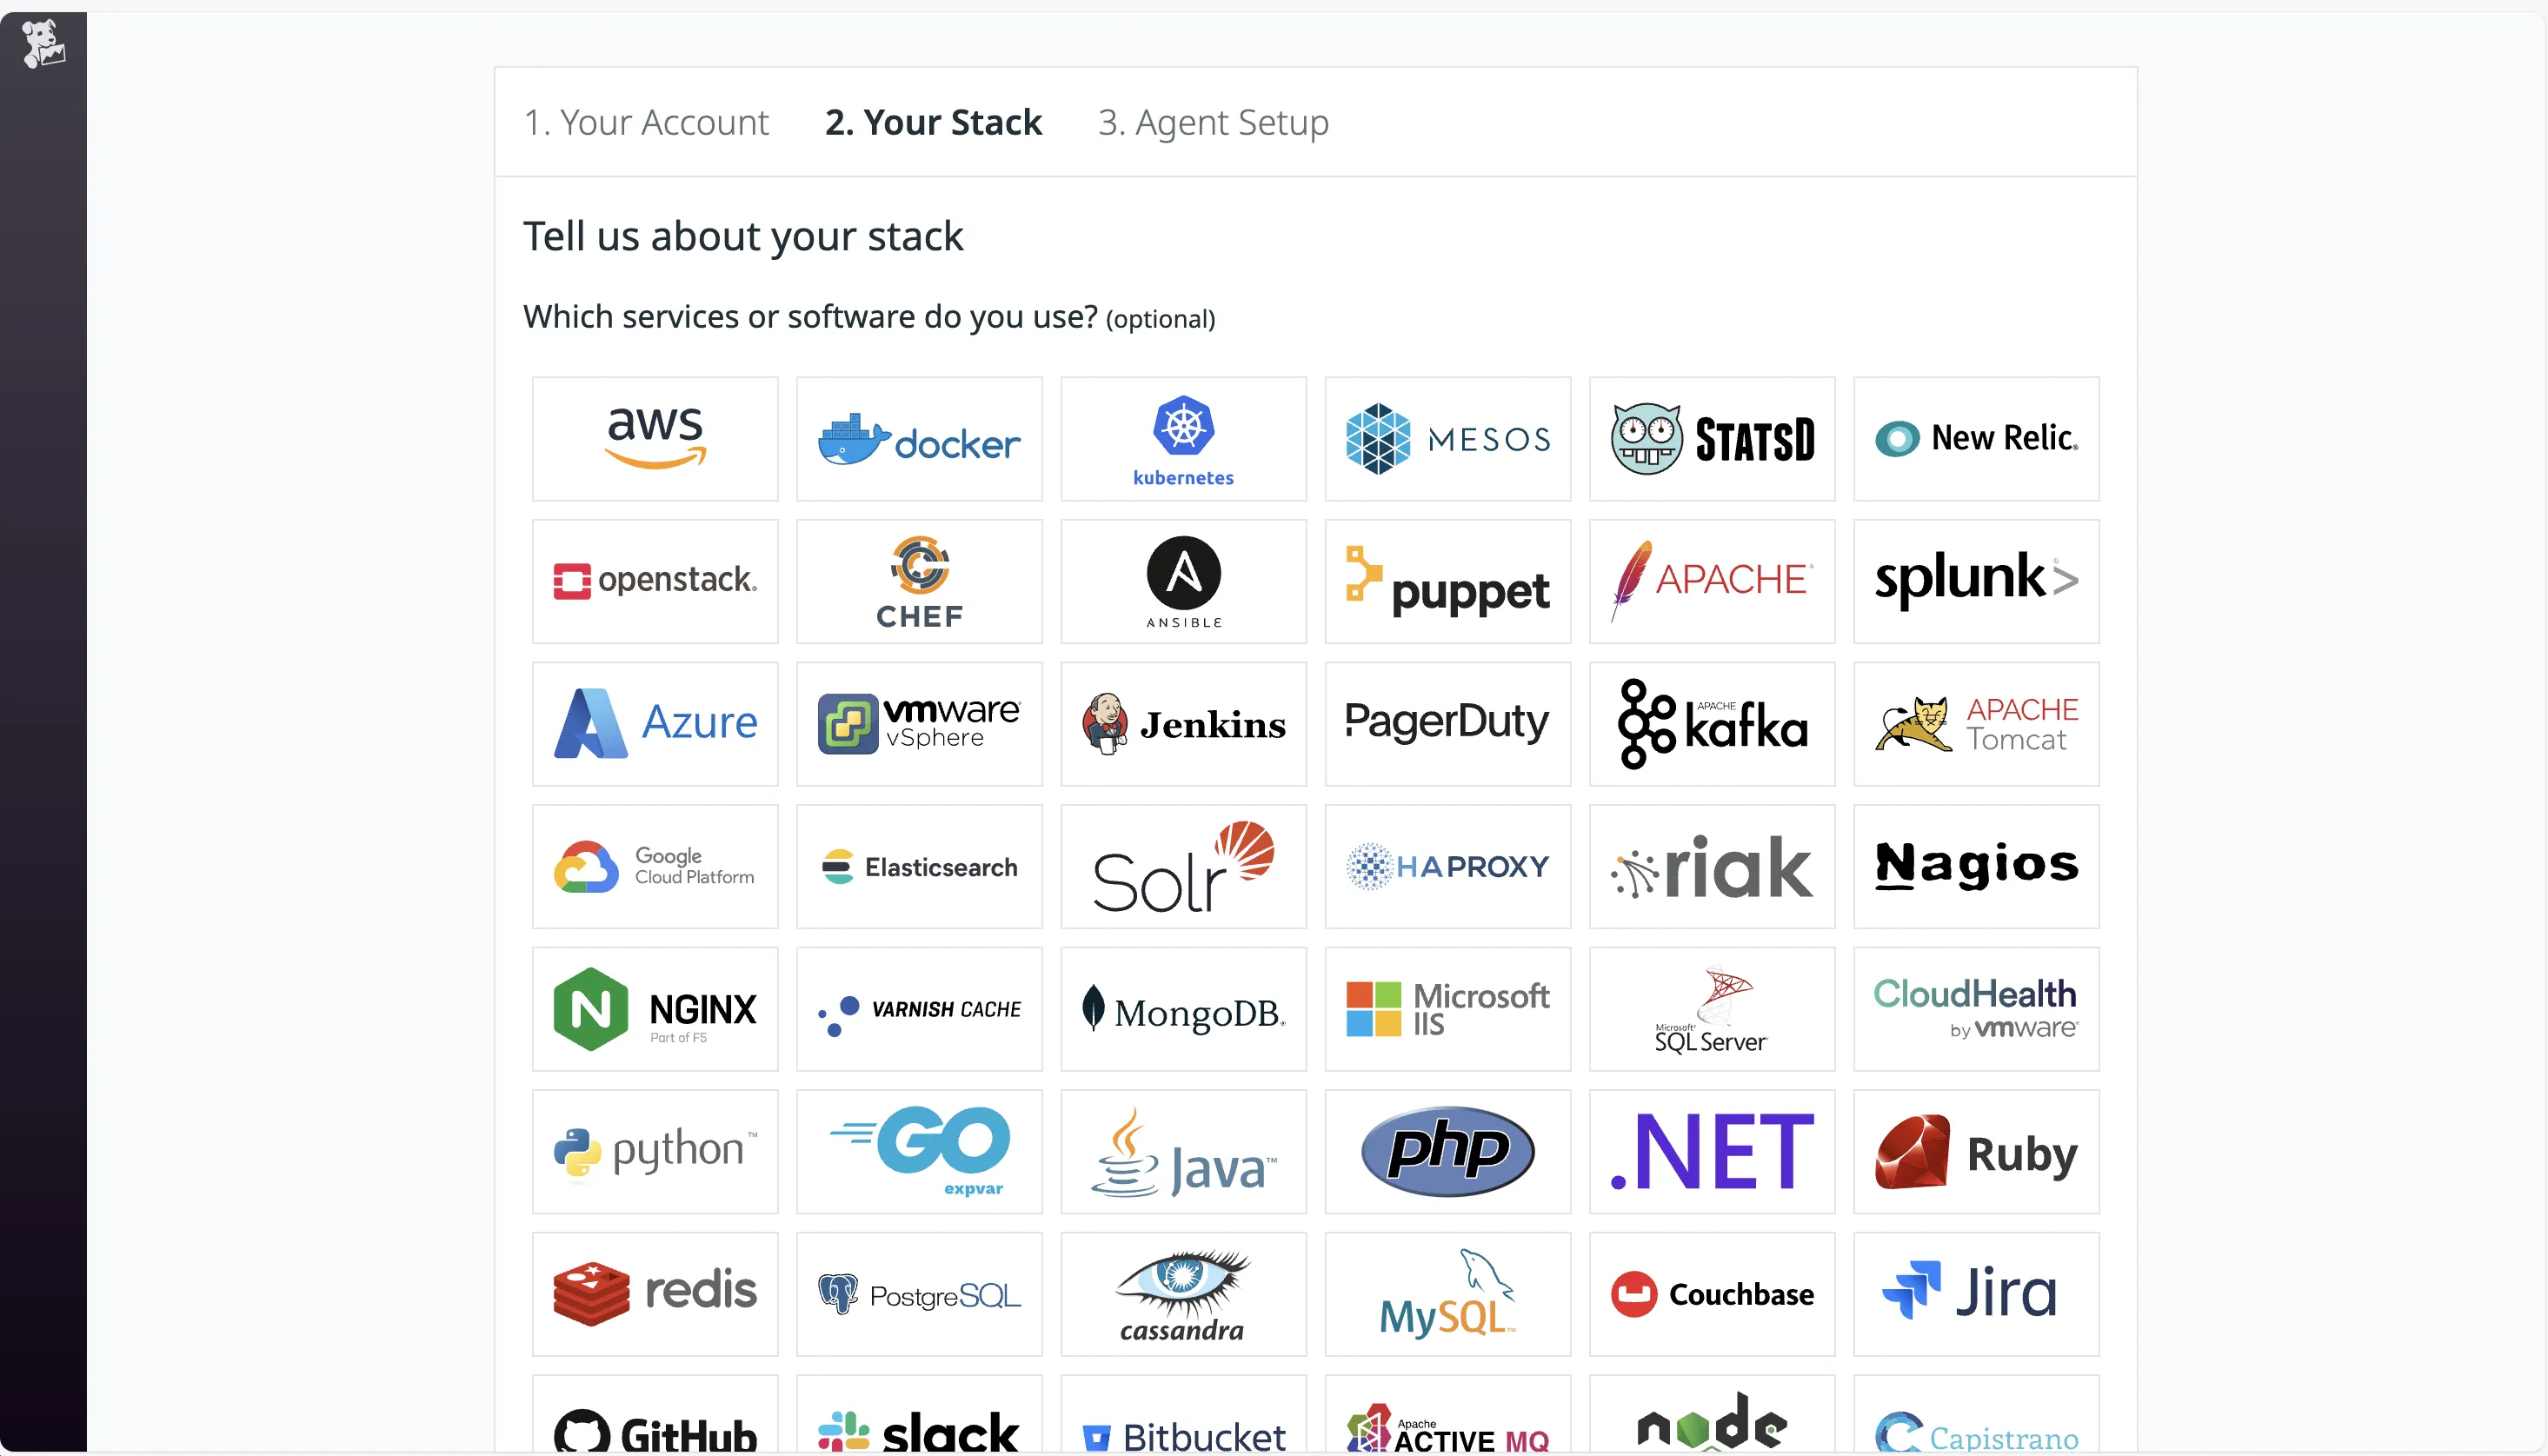
Going to the Datadog website, I was prompted to create an account by providing my email and other details. There was no need to provide credit card details. After verifying my email with the security code sent, my account was created, and I was taken to the next page. This asked me about my tech stack. I found this easy to follow, and you get the option to skip this.
Proceeding from here, it took me directly to the Agent Setup page. I’ll talk about this process shortly.
Dynatrace
Dynatrace has a similar signup process. I provided my email and other details. Once verified, my account was created. There was no prompt to enter my billing details.
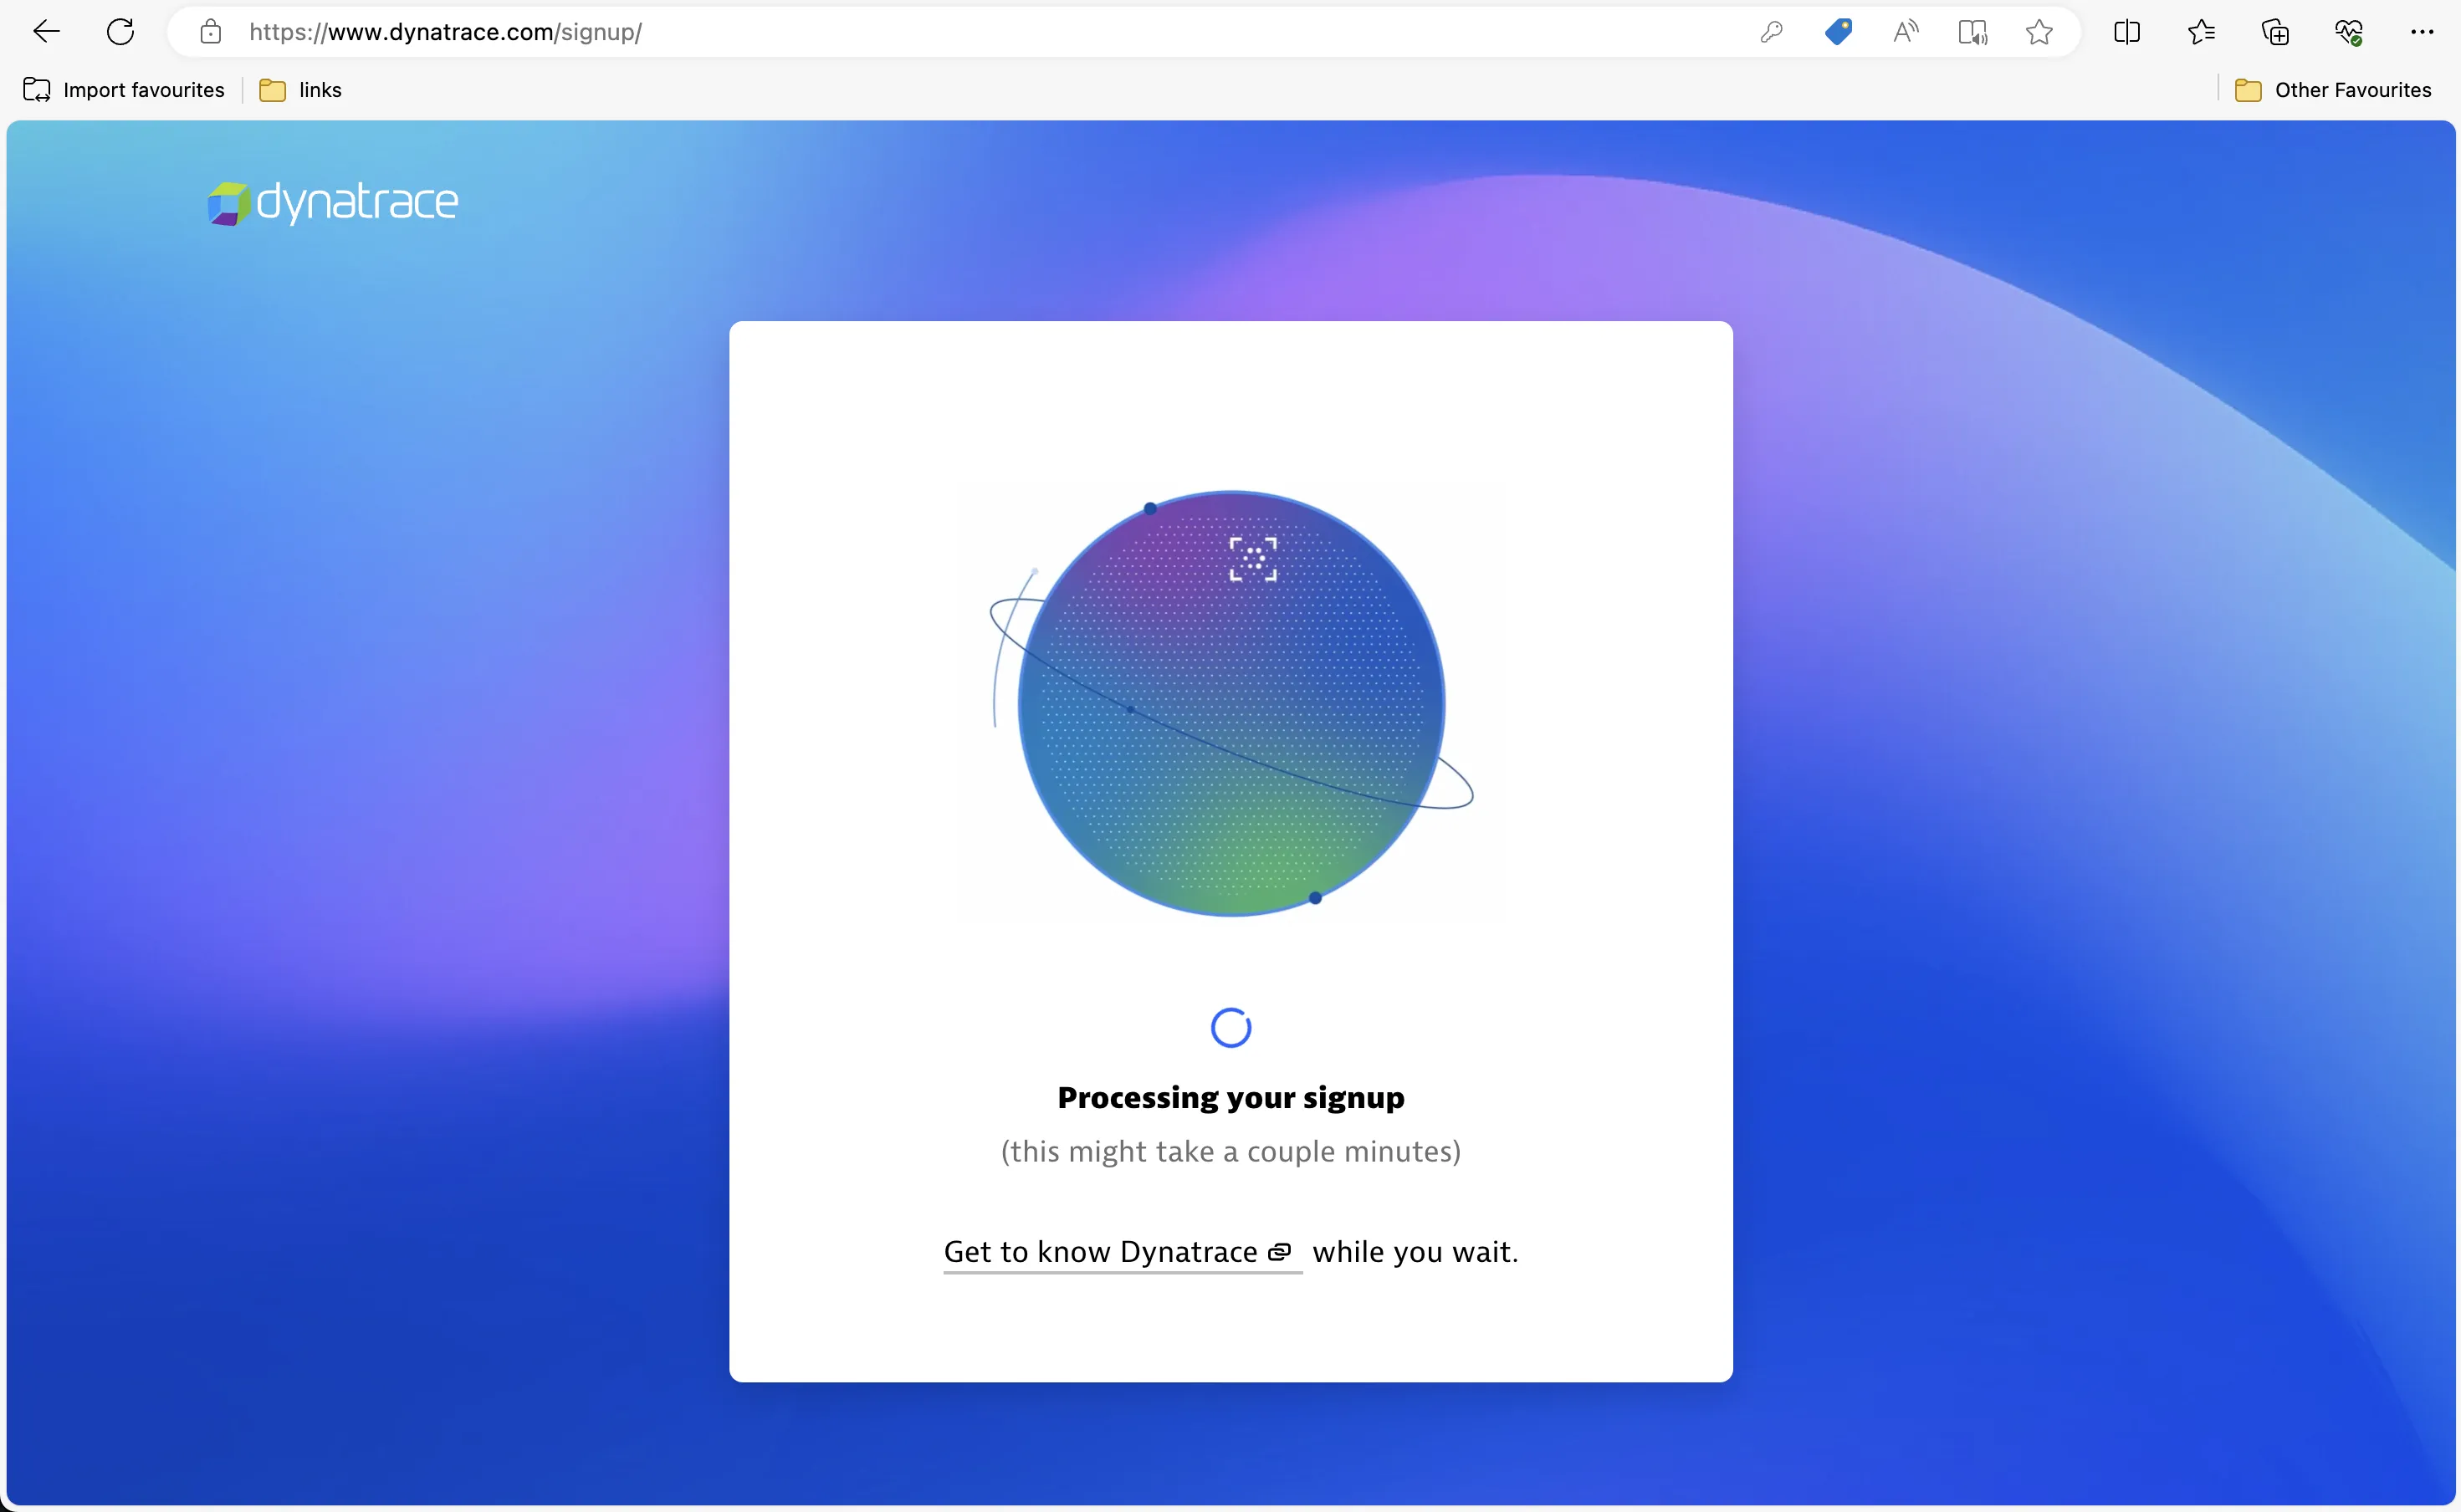
One thing to note about Dynatrace is that unlike Datadog, the account creation isn’t instant. It takes a while for the signup process to complete. I was presented with a “Processing your signup” page, and that took about 4 minutes to get done.
Once completed, I was taken to the landing page. But I didn’t find the UI very intuitive. Moreover, the Dynatrace Hub takes a very long time to load. Once the Hub was loaded, it showed direct integration with AWS. But that needs IAM role for access and would monitor my entire AWS account. That wasn’t my plan. And it took quite some time for me to figure out how to proceed from there. More on that later.
Agent Installation
Datadog
As part of the sign-up process, I was taken to the Agent Installation page. I selected Amazon Linux on the left, and it gave me the required command to run.
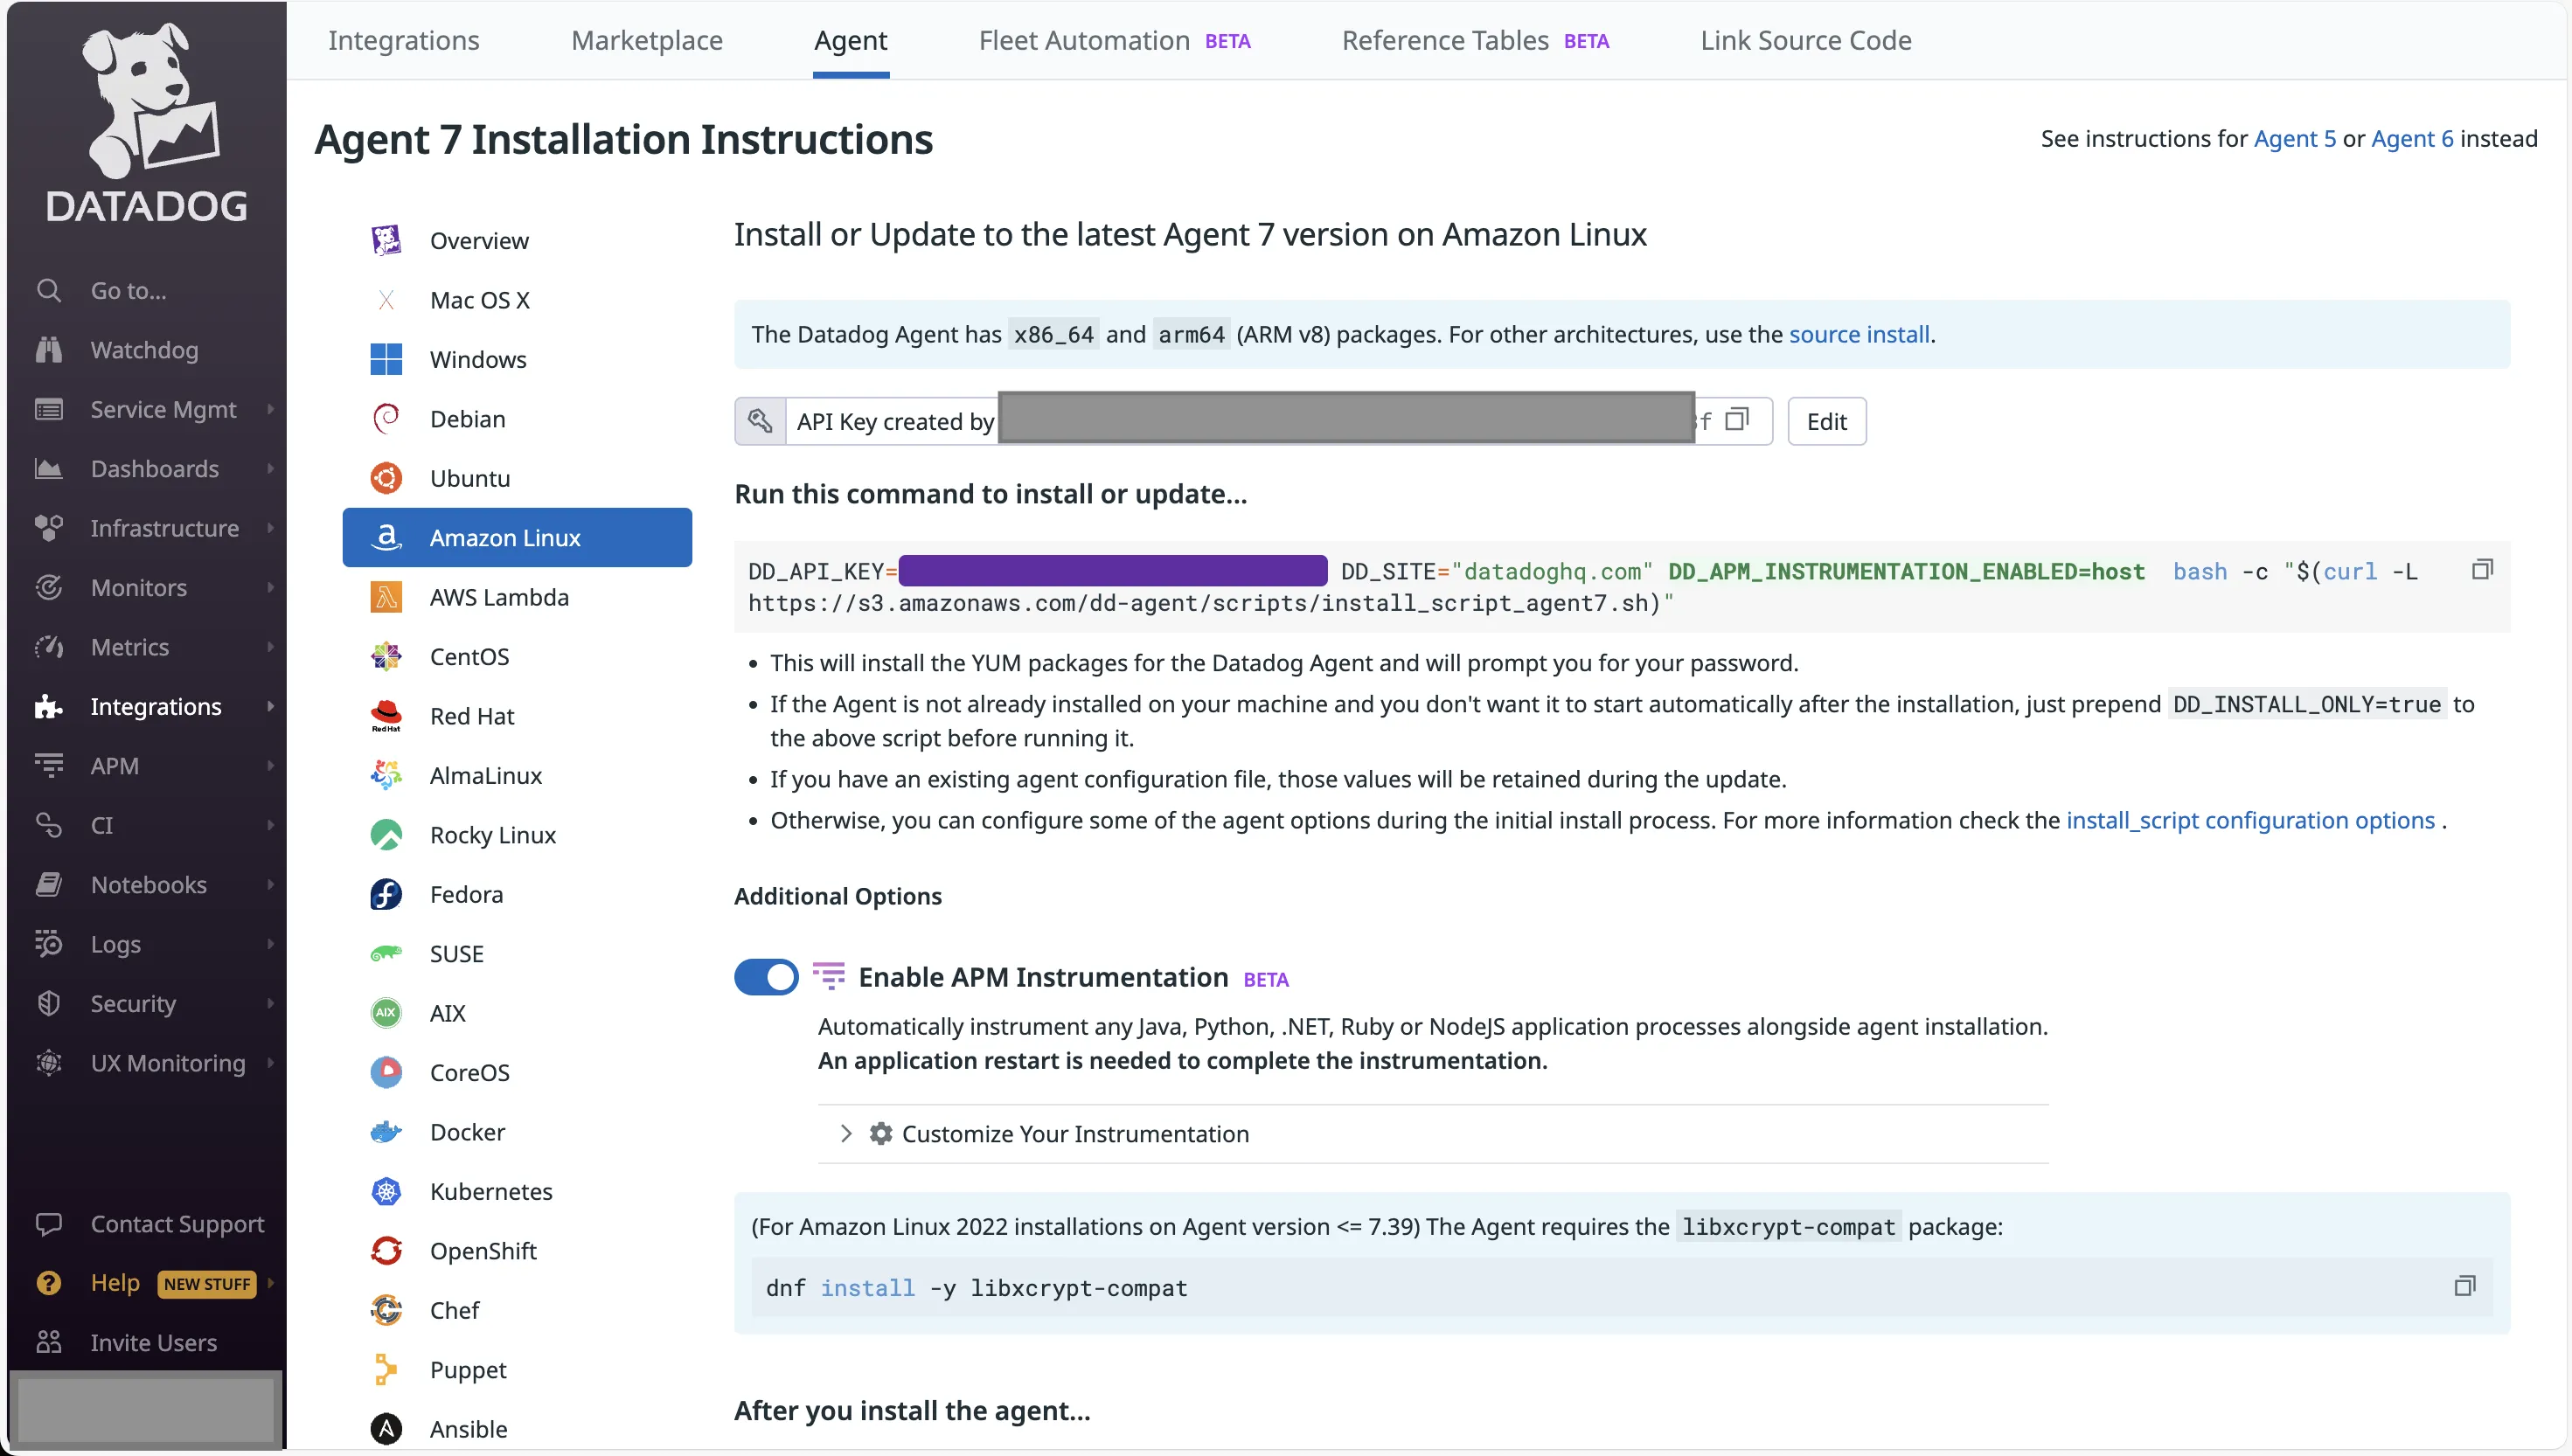
I went to my Datadog EC2 and ran the command. After downloading and installing the necessary packages, the Datadog Agent was up and running on my machine. That was easy.
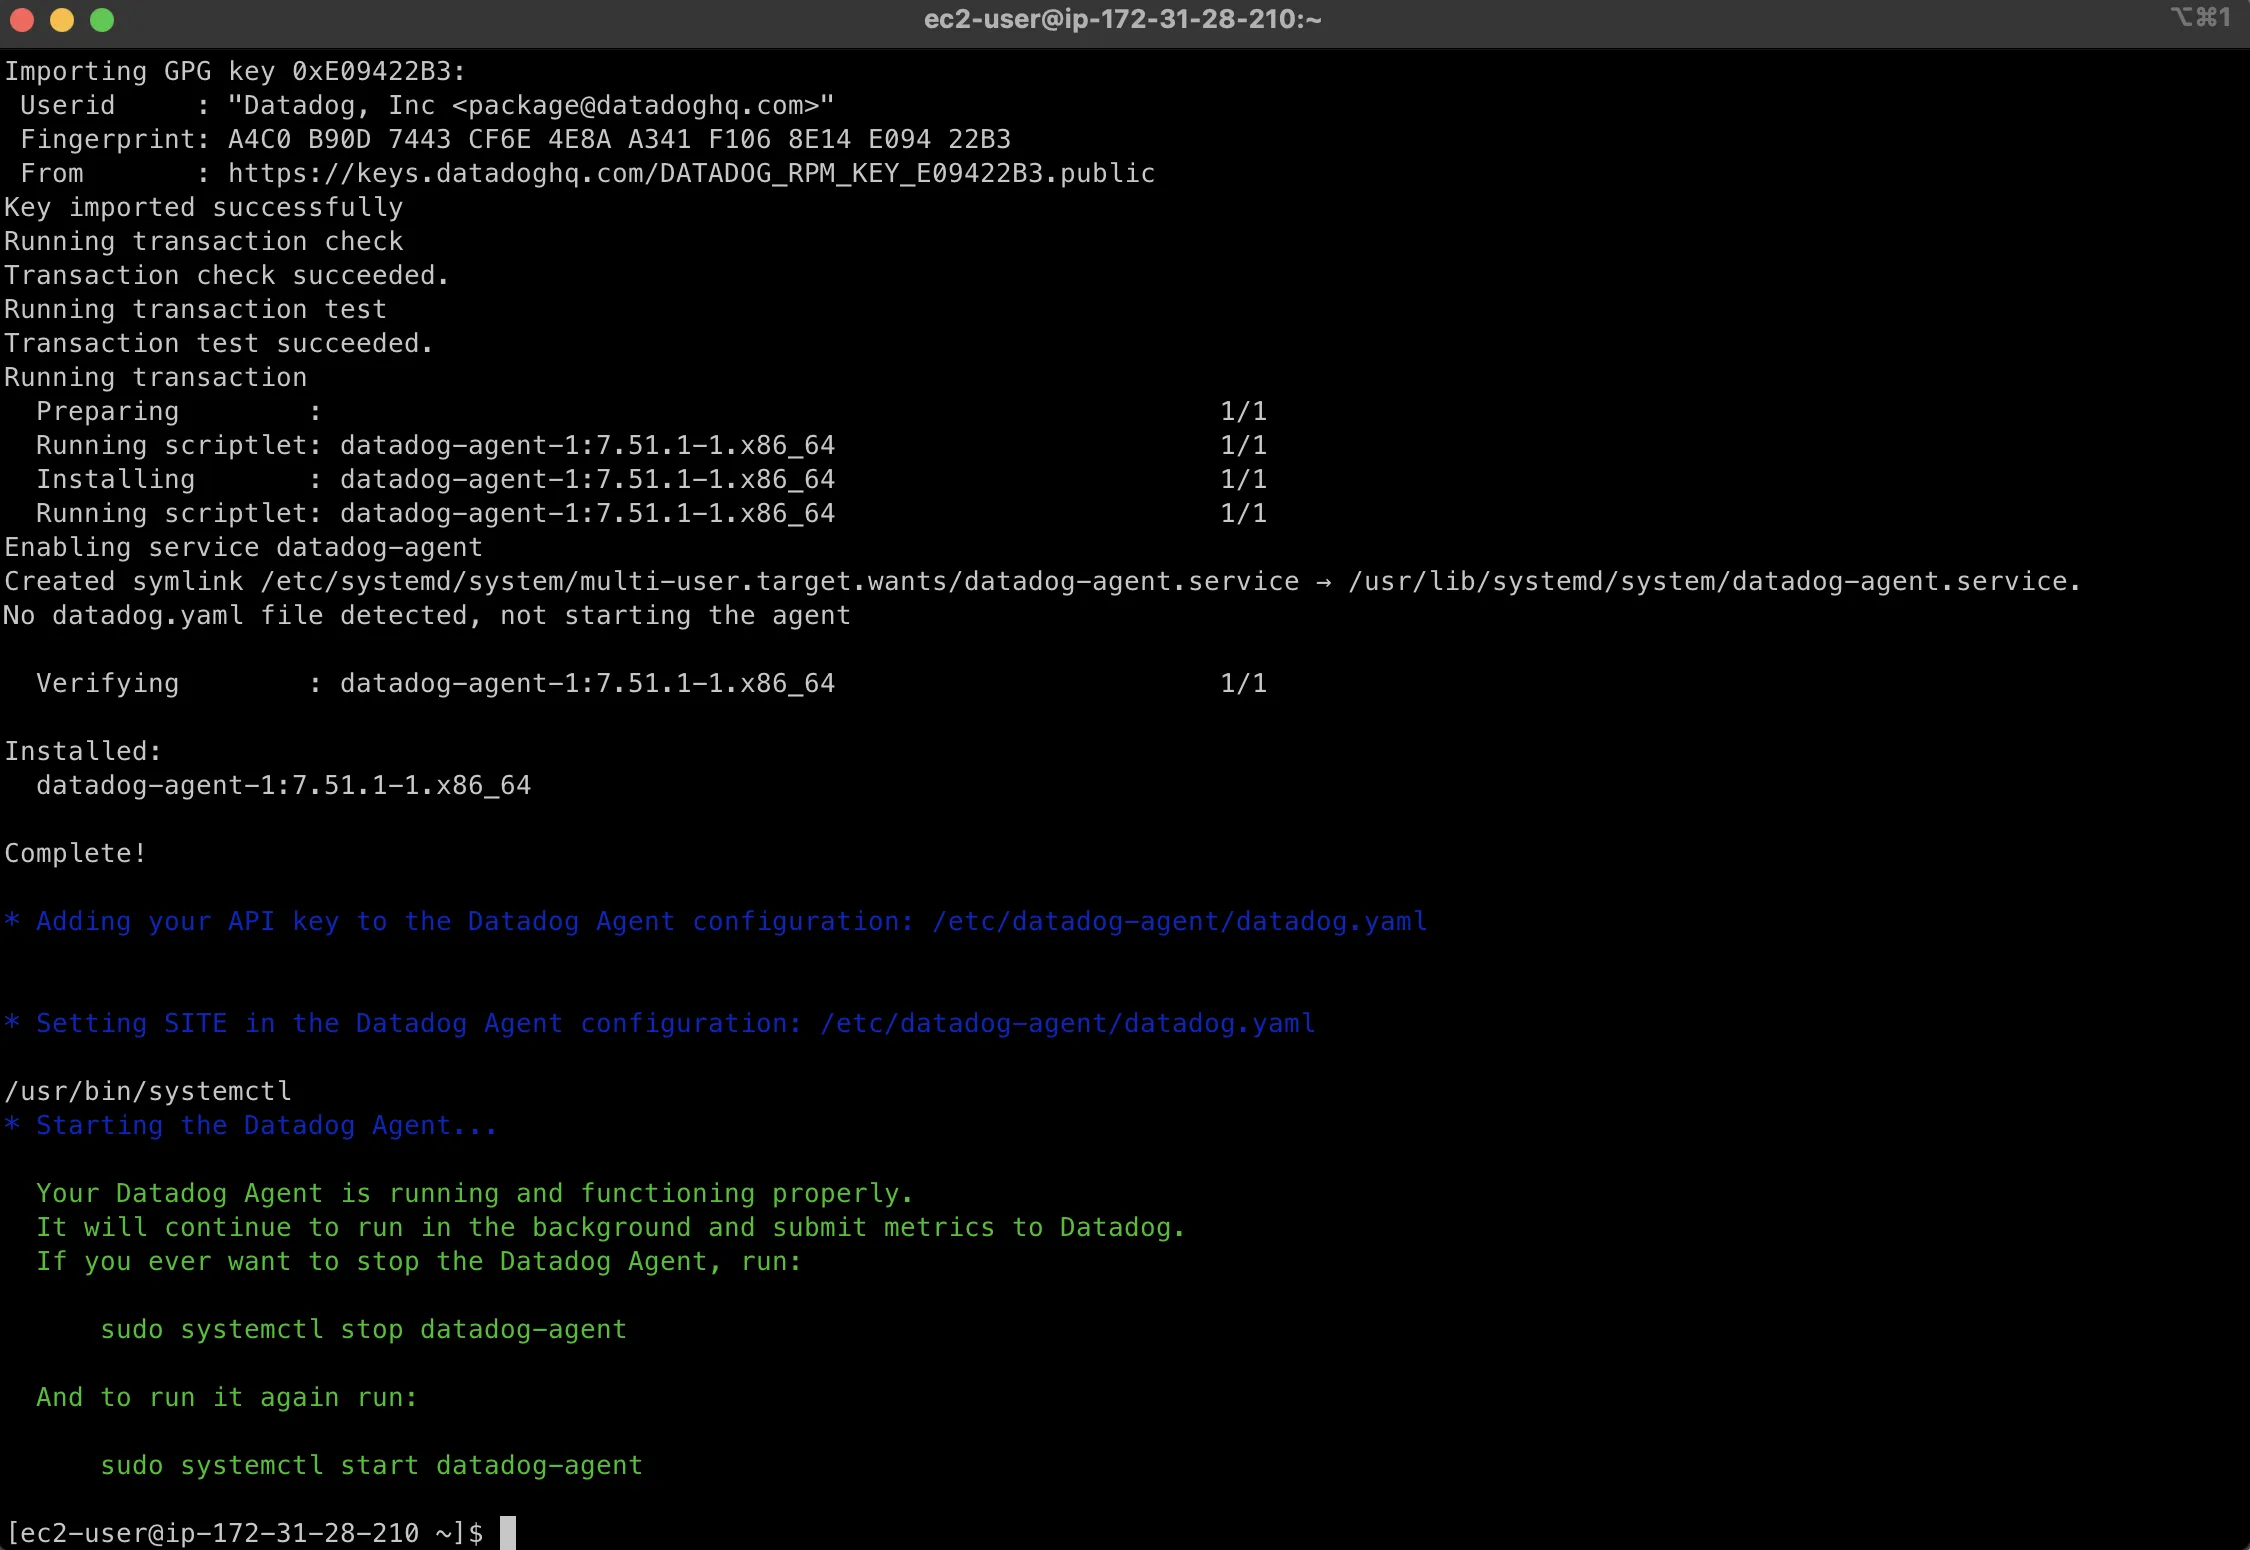
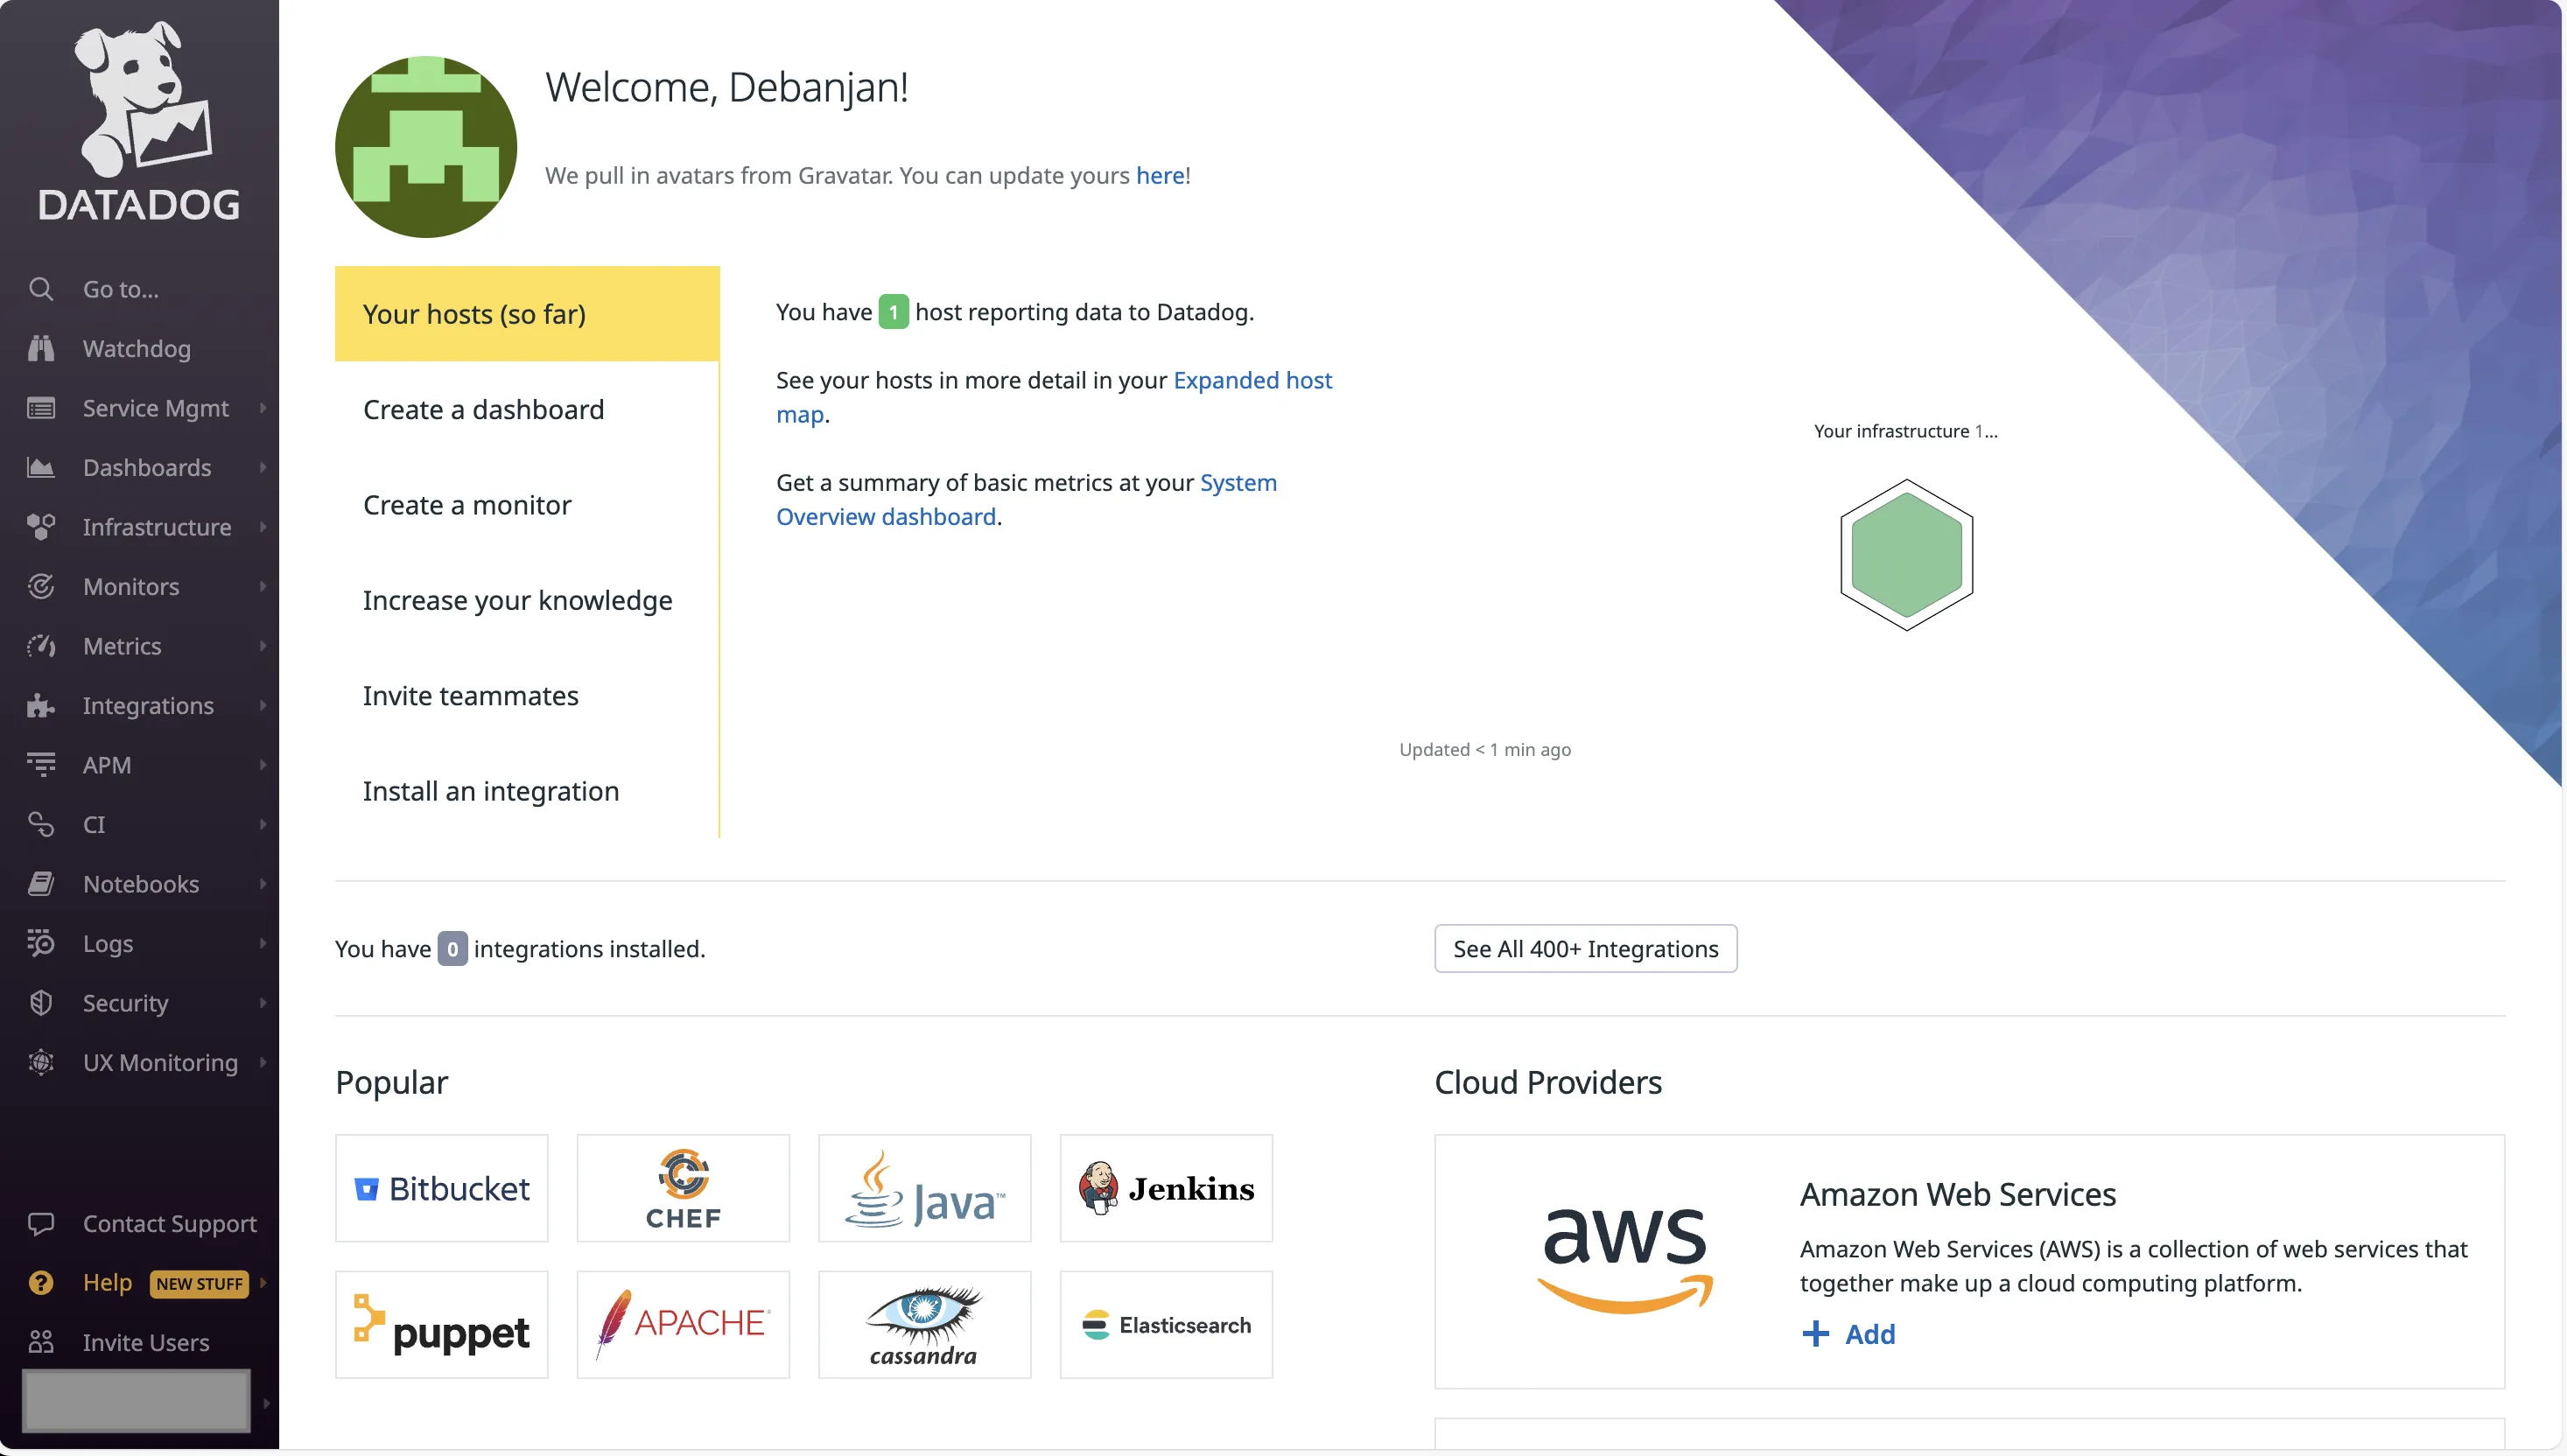
Once the Agent had started, I came back to the website to check. As expected, I could see that Datadog had started monitoring 1 host. This showed me all the infrastructure metrics.
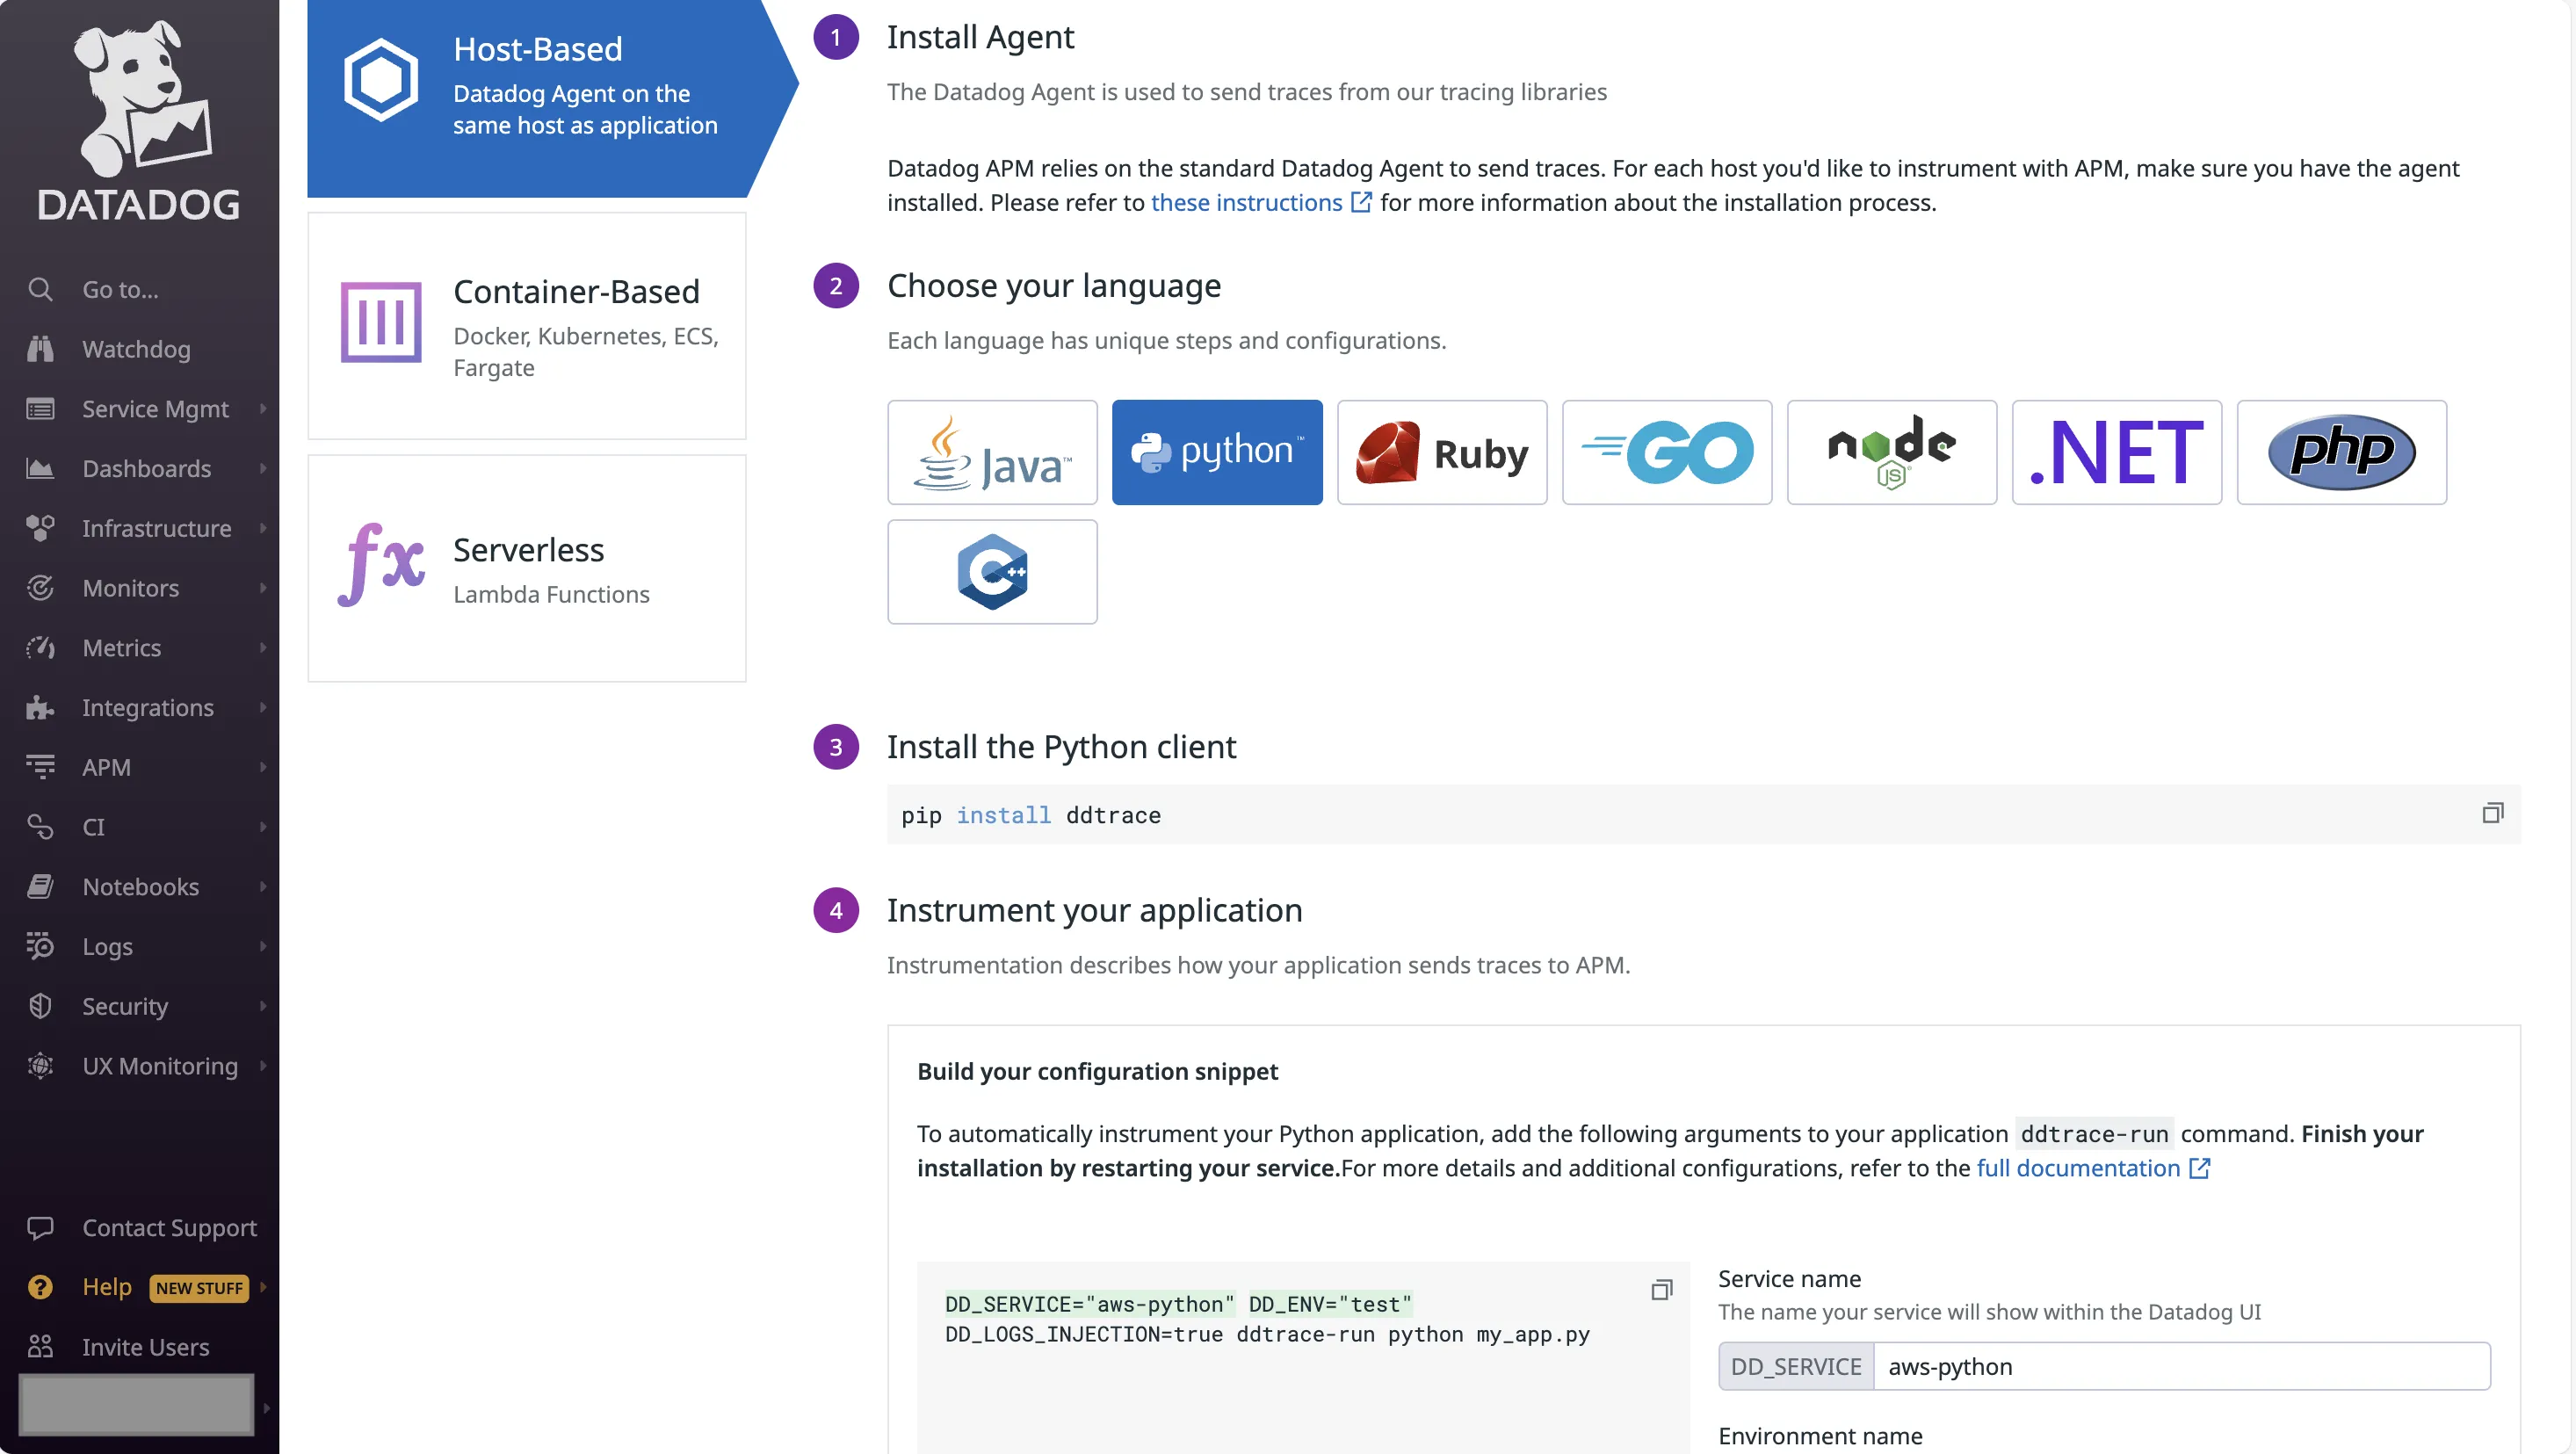
But Datadog did not start auto capturing the application metrics. I was prompted to install another application-specific Agent. For Python, I had to install the Datadog client *ddtrace*.
Next, in order to start with the instrumentation, I had to pass additional arguments to my application startup command. The UI provided all the necessary steps to build the final command.
Dynatrace
I didn’t find the Dynatrace UI to be intuitive or user-friendly. It kept showing role-based monitoring for AWS, but I just needed to monitor the single instance. I knew that I needed to install an agent, but I couldn’t find the instructions anywhere. After Googling for answers, I finally ended up on the Agent installation page.
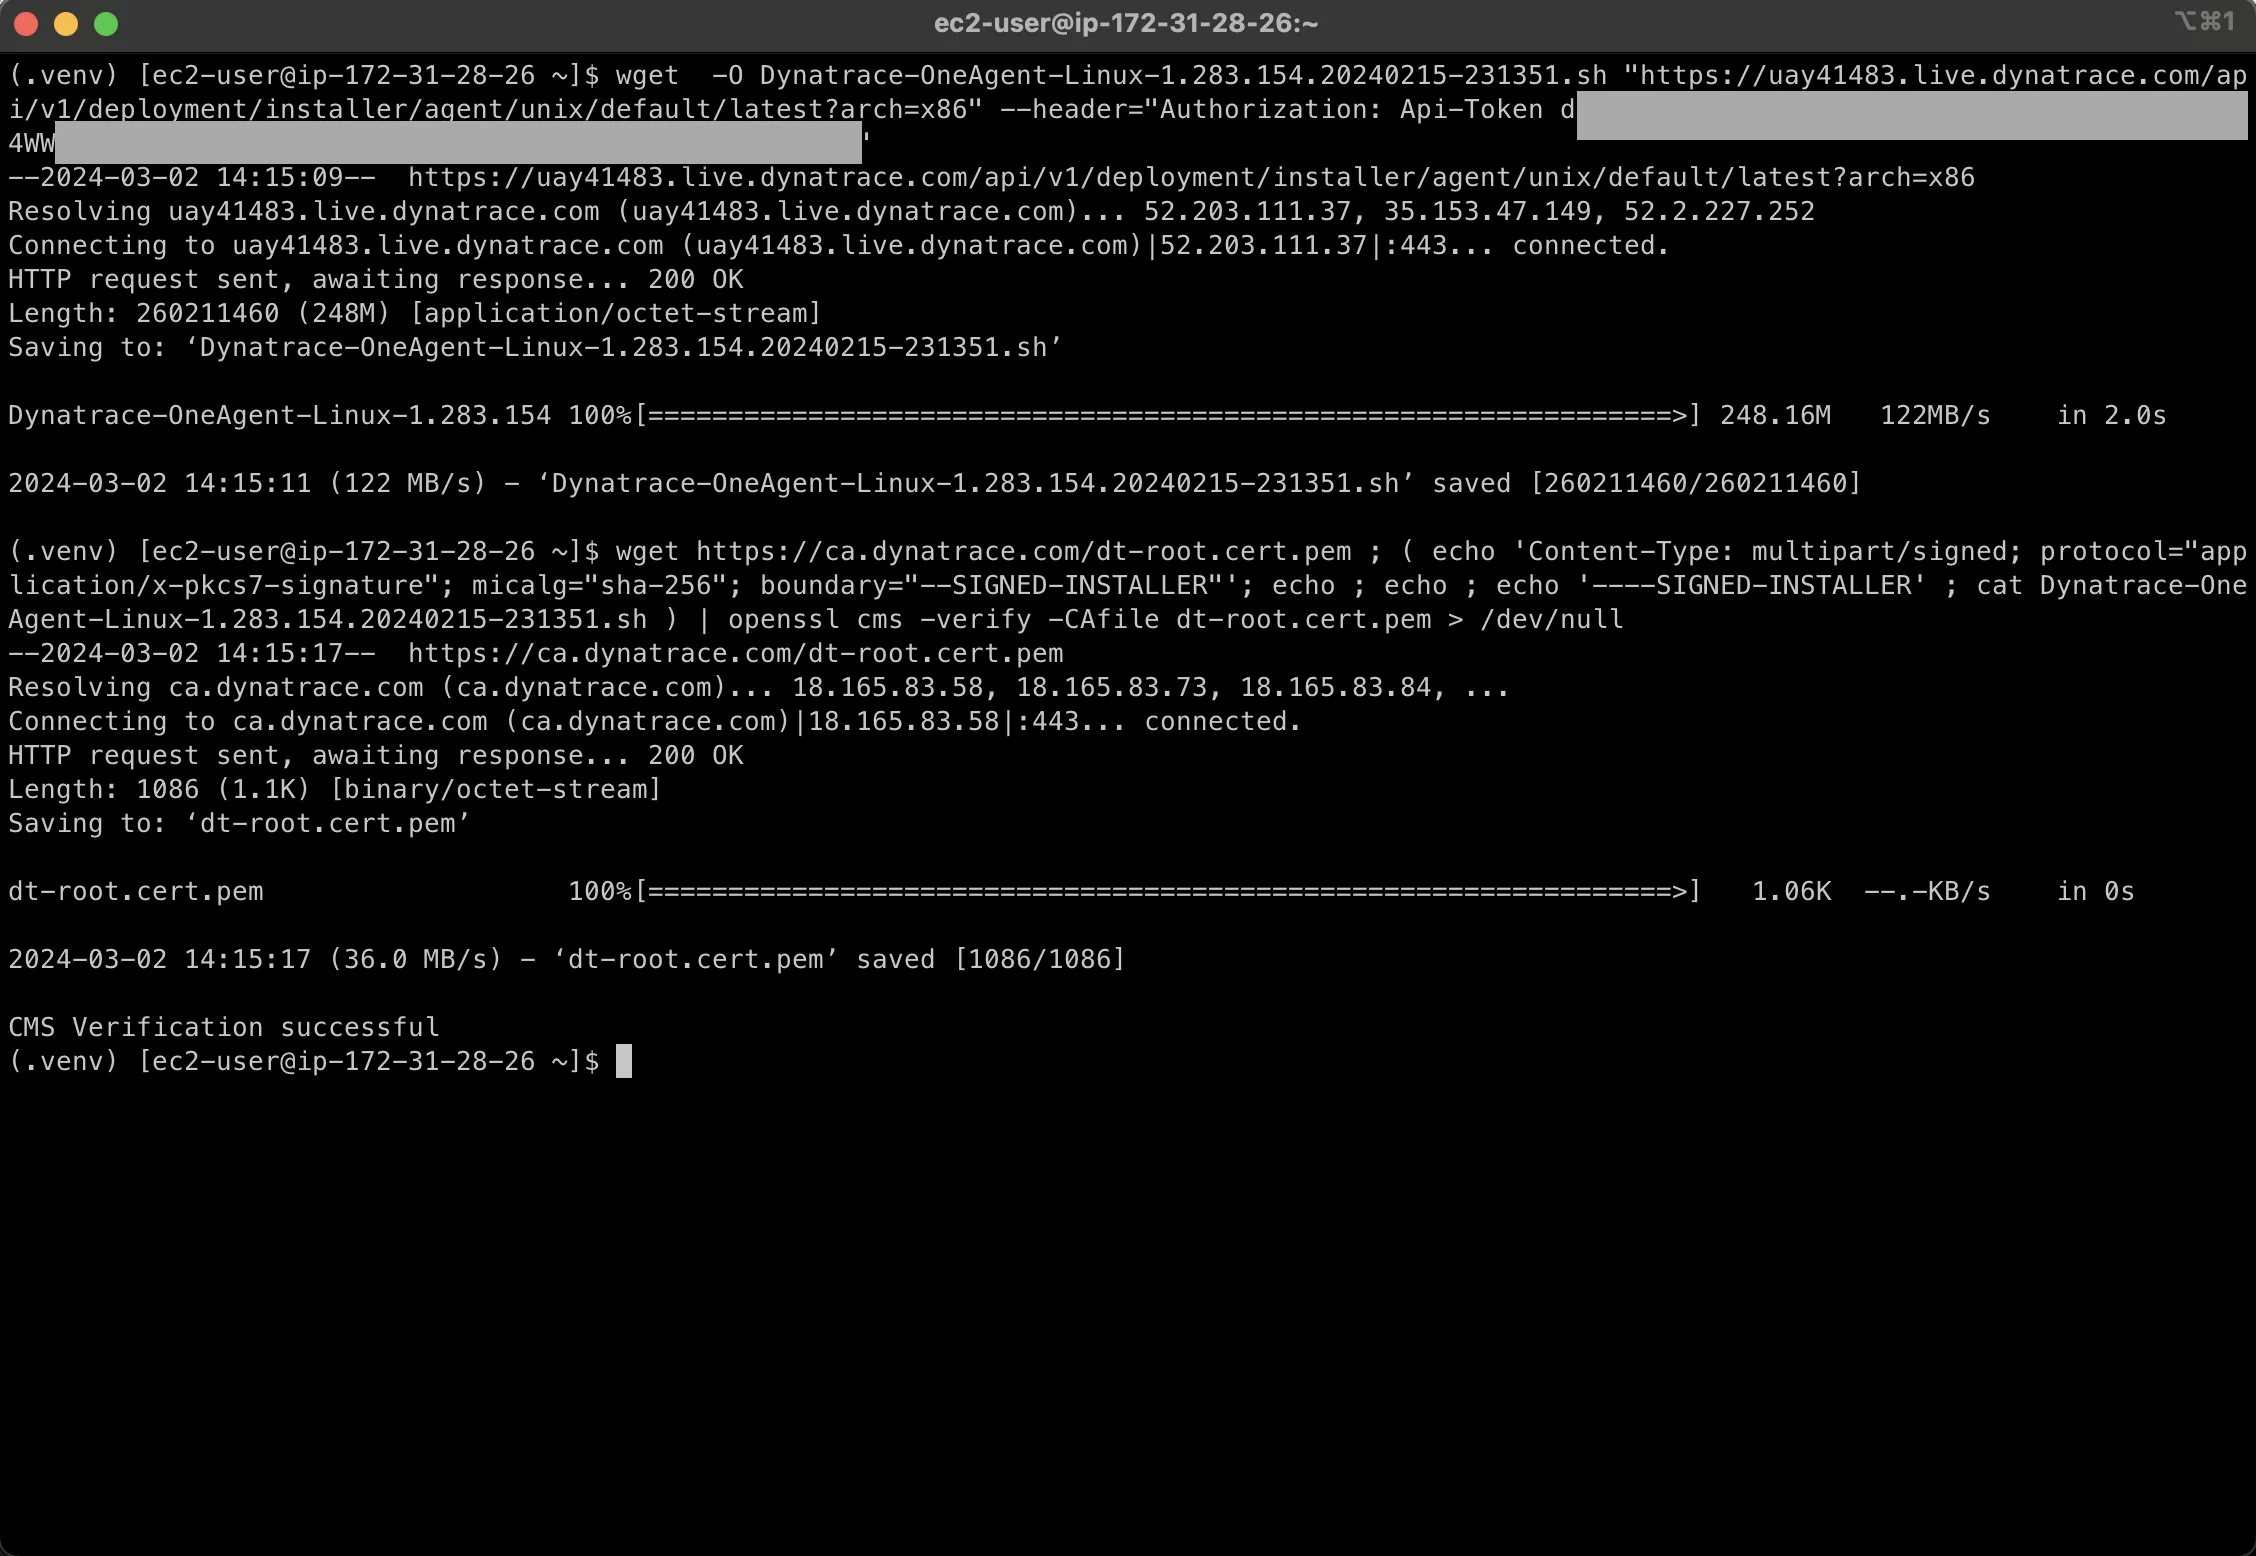
For Dynatrace, you need the OneAgent. Since I am running a Linux instance, I navigated to the corresponding page. I was asked to generate a PaaS token (since I didn’t have one already). It then showed me a set of commands that I had to run.
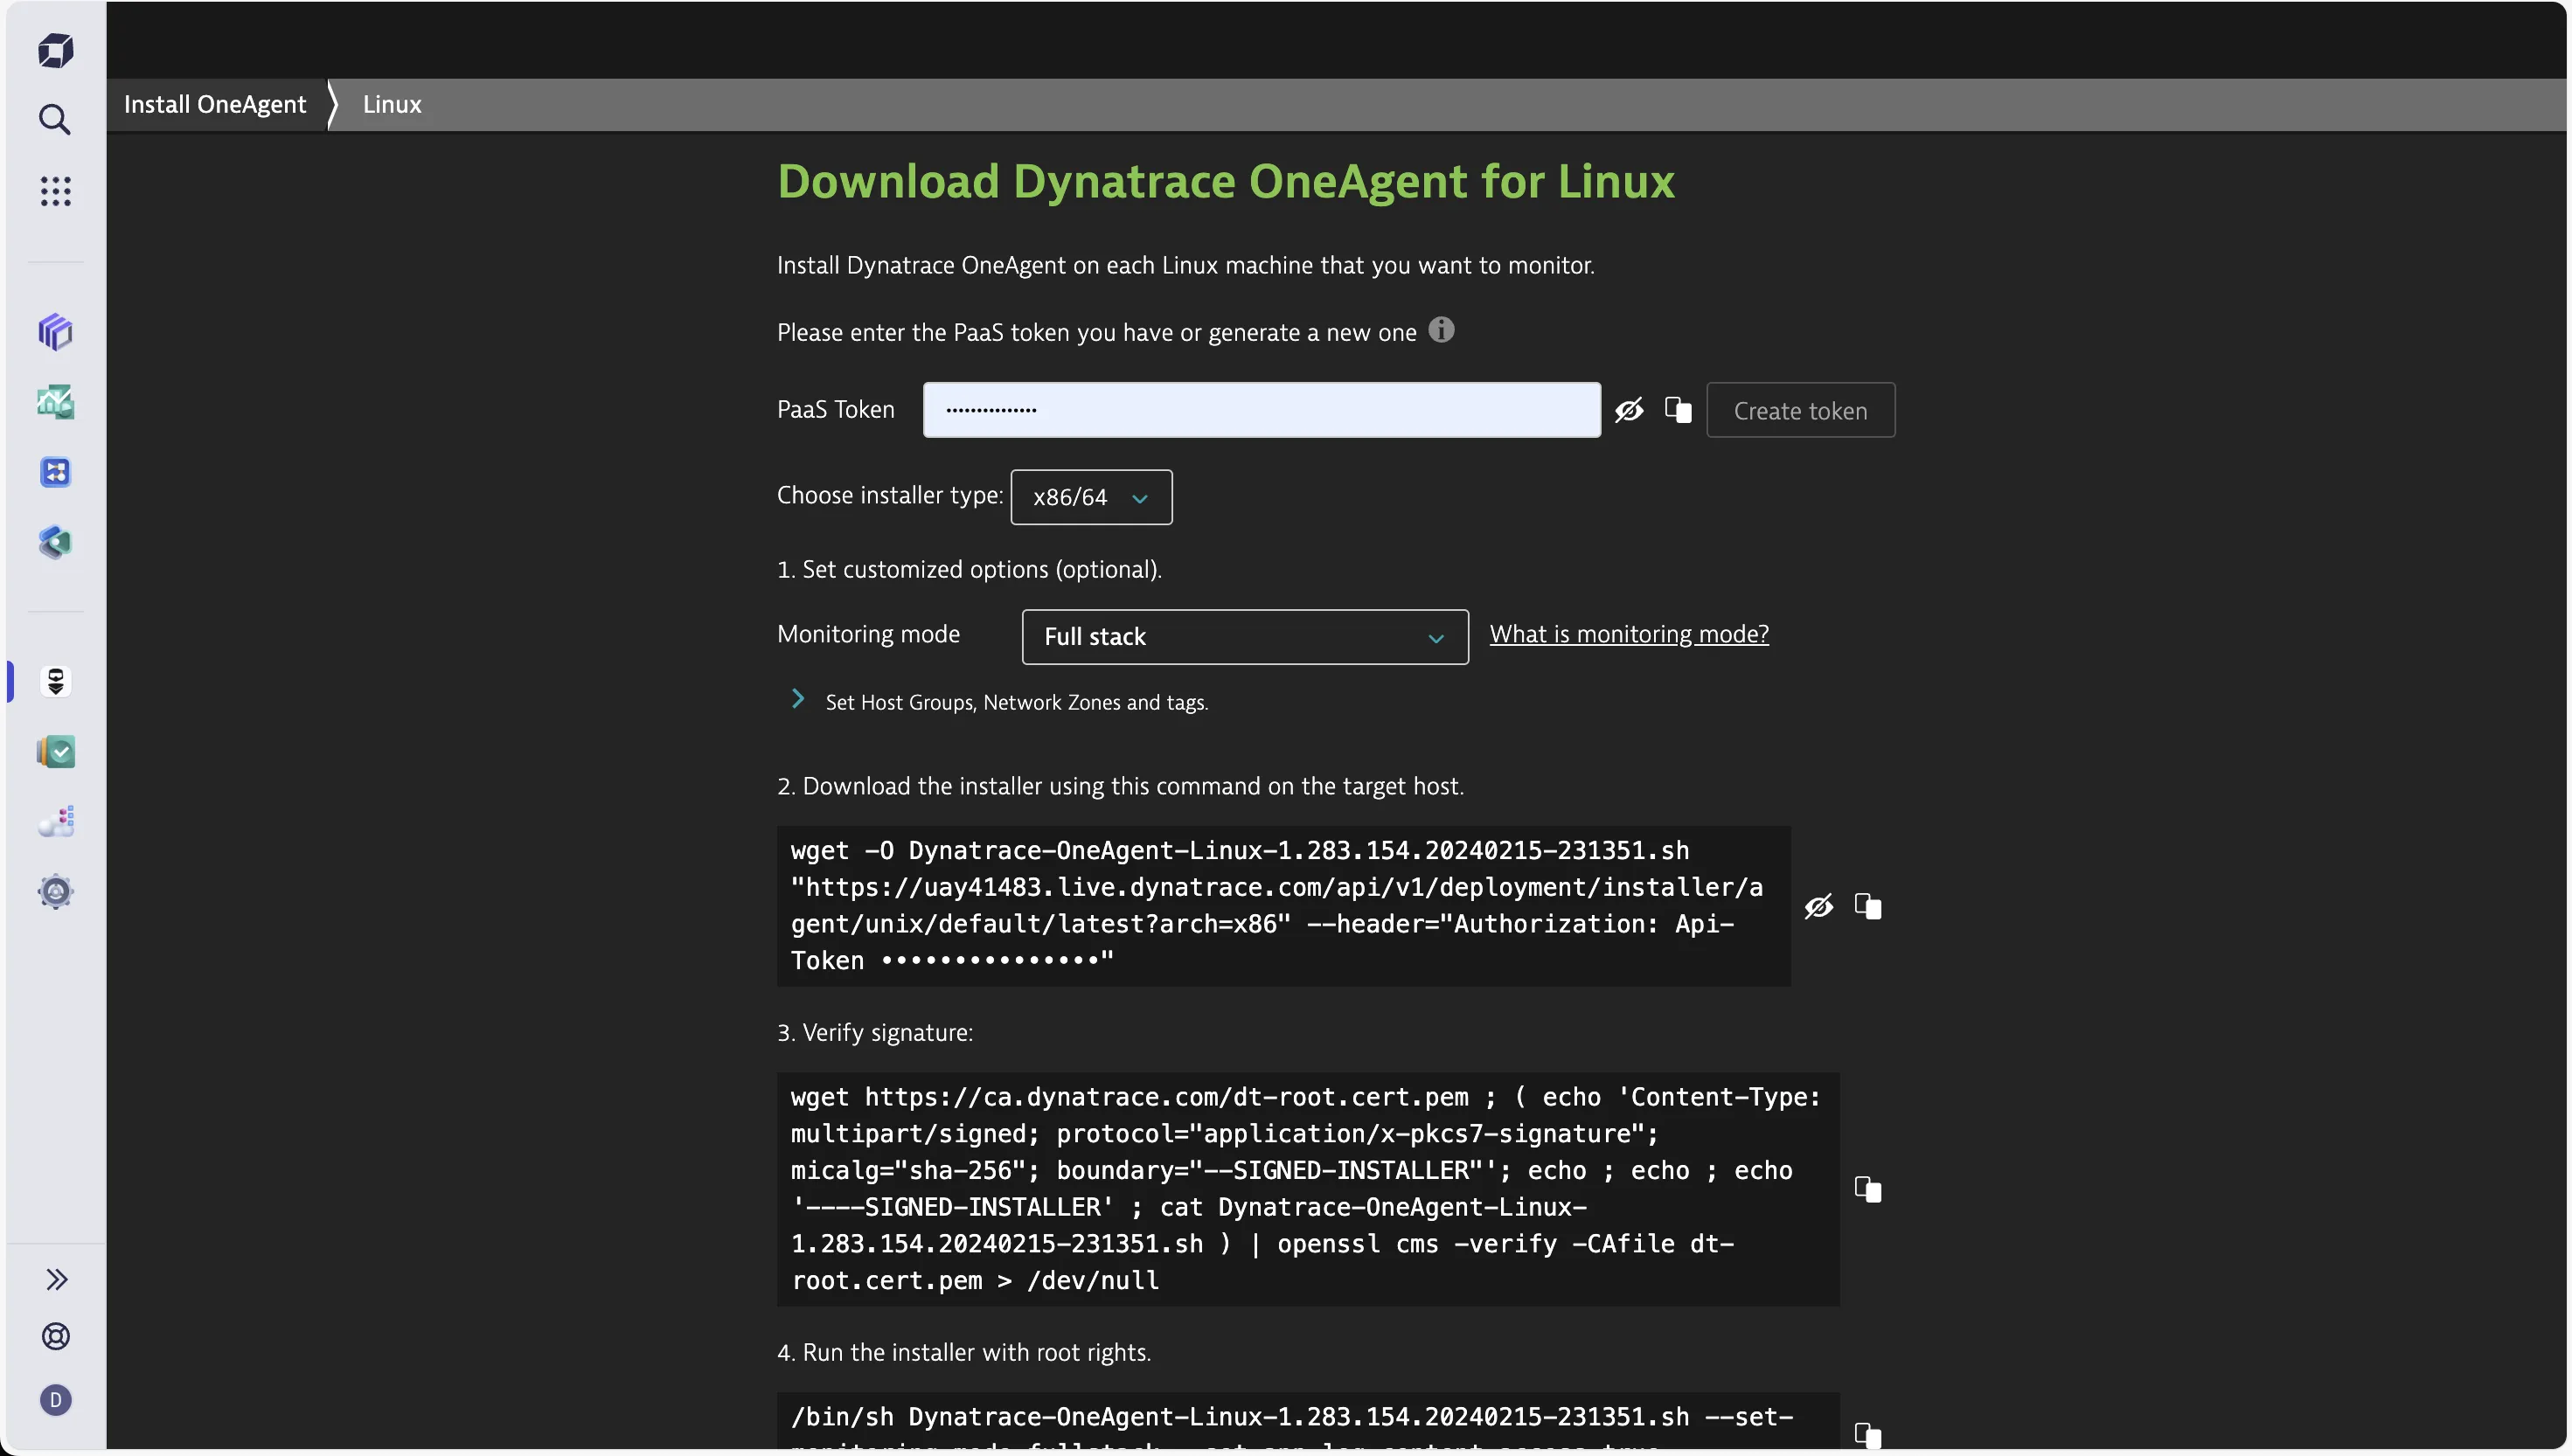
The first command downloads the installer. The second one verifies the signature. I could run those without any issues.
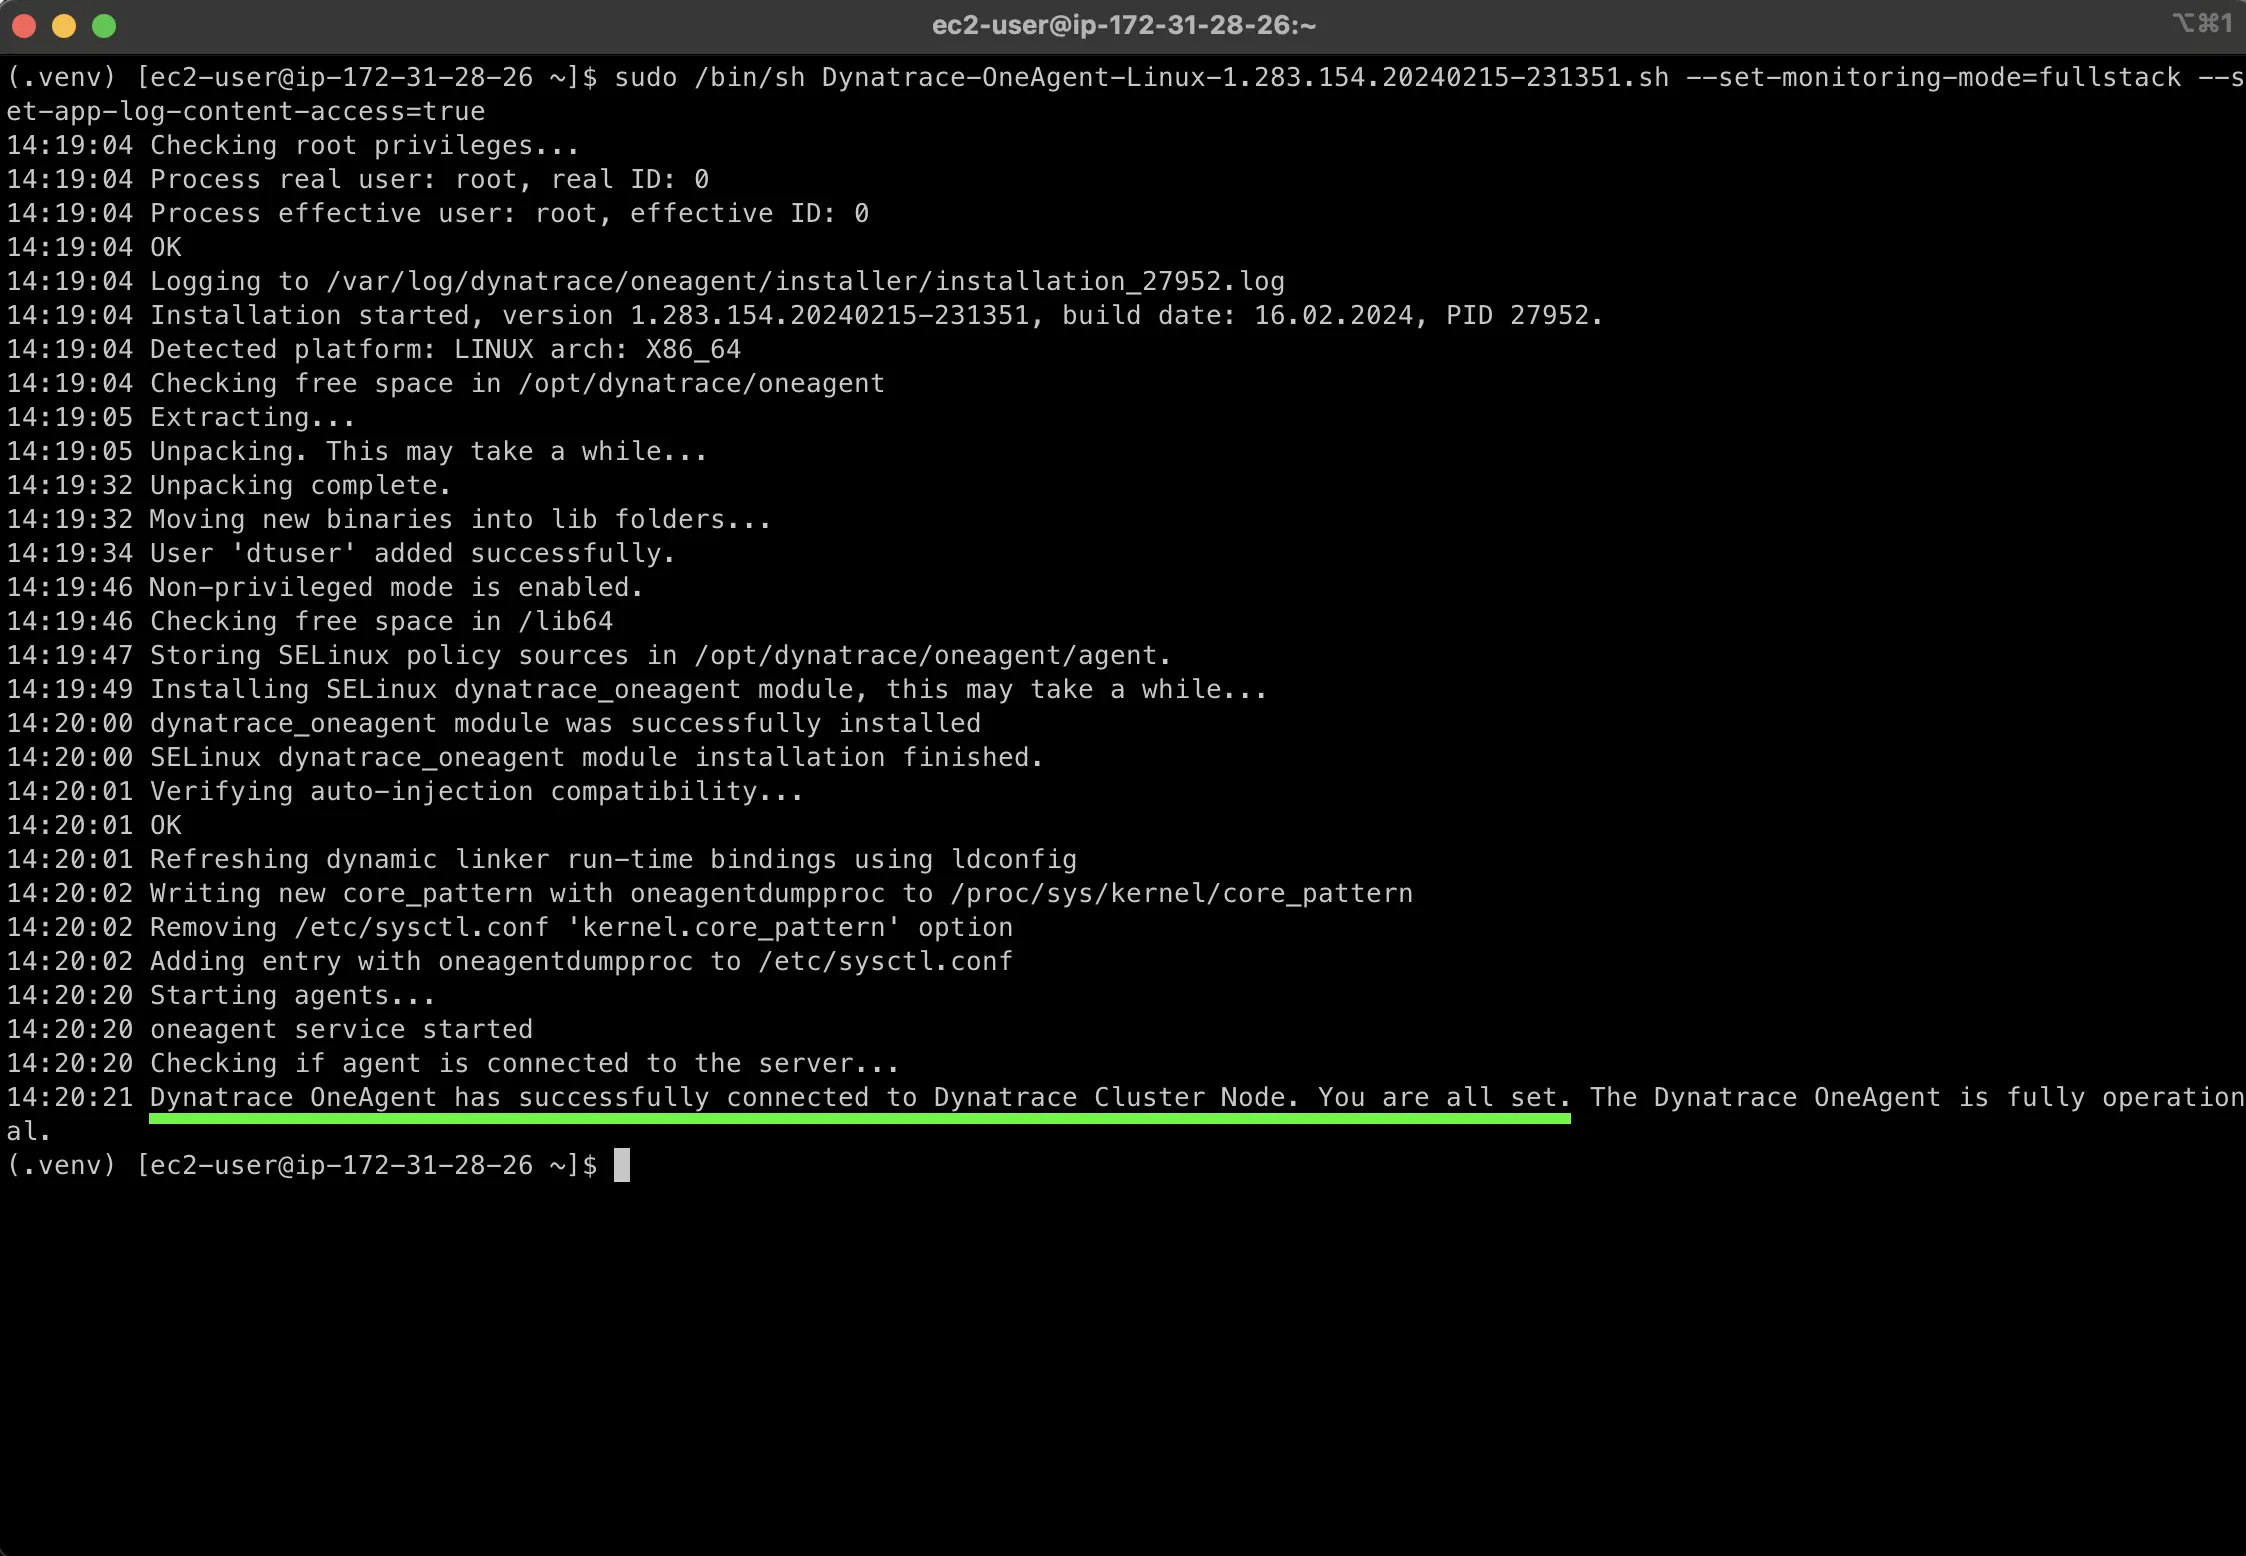
Next, it was time to run the OneAgent. I had to run the command with *sudo* as it required root privileges. Took a minute, and then it showed that the OneAgent was successfully connected to Dynatrace.
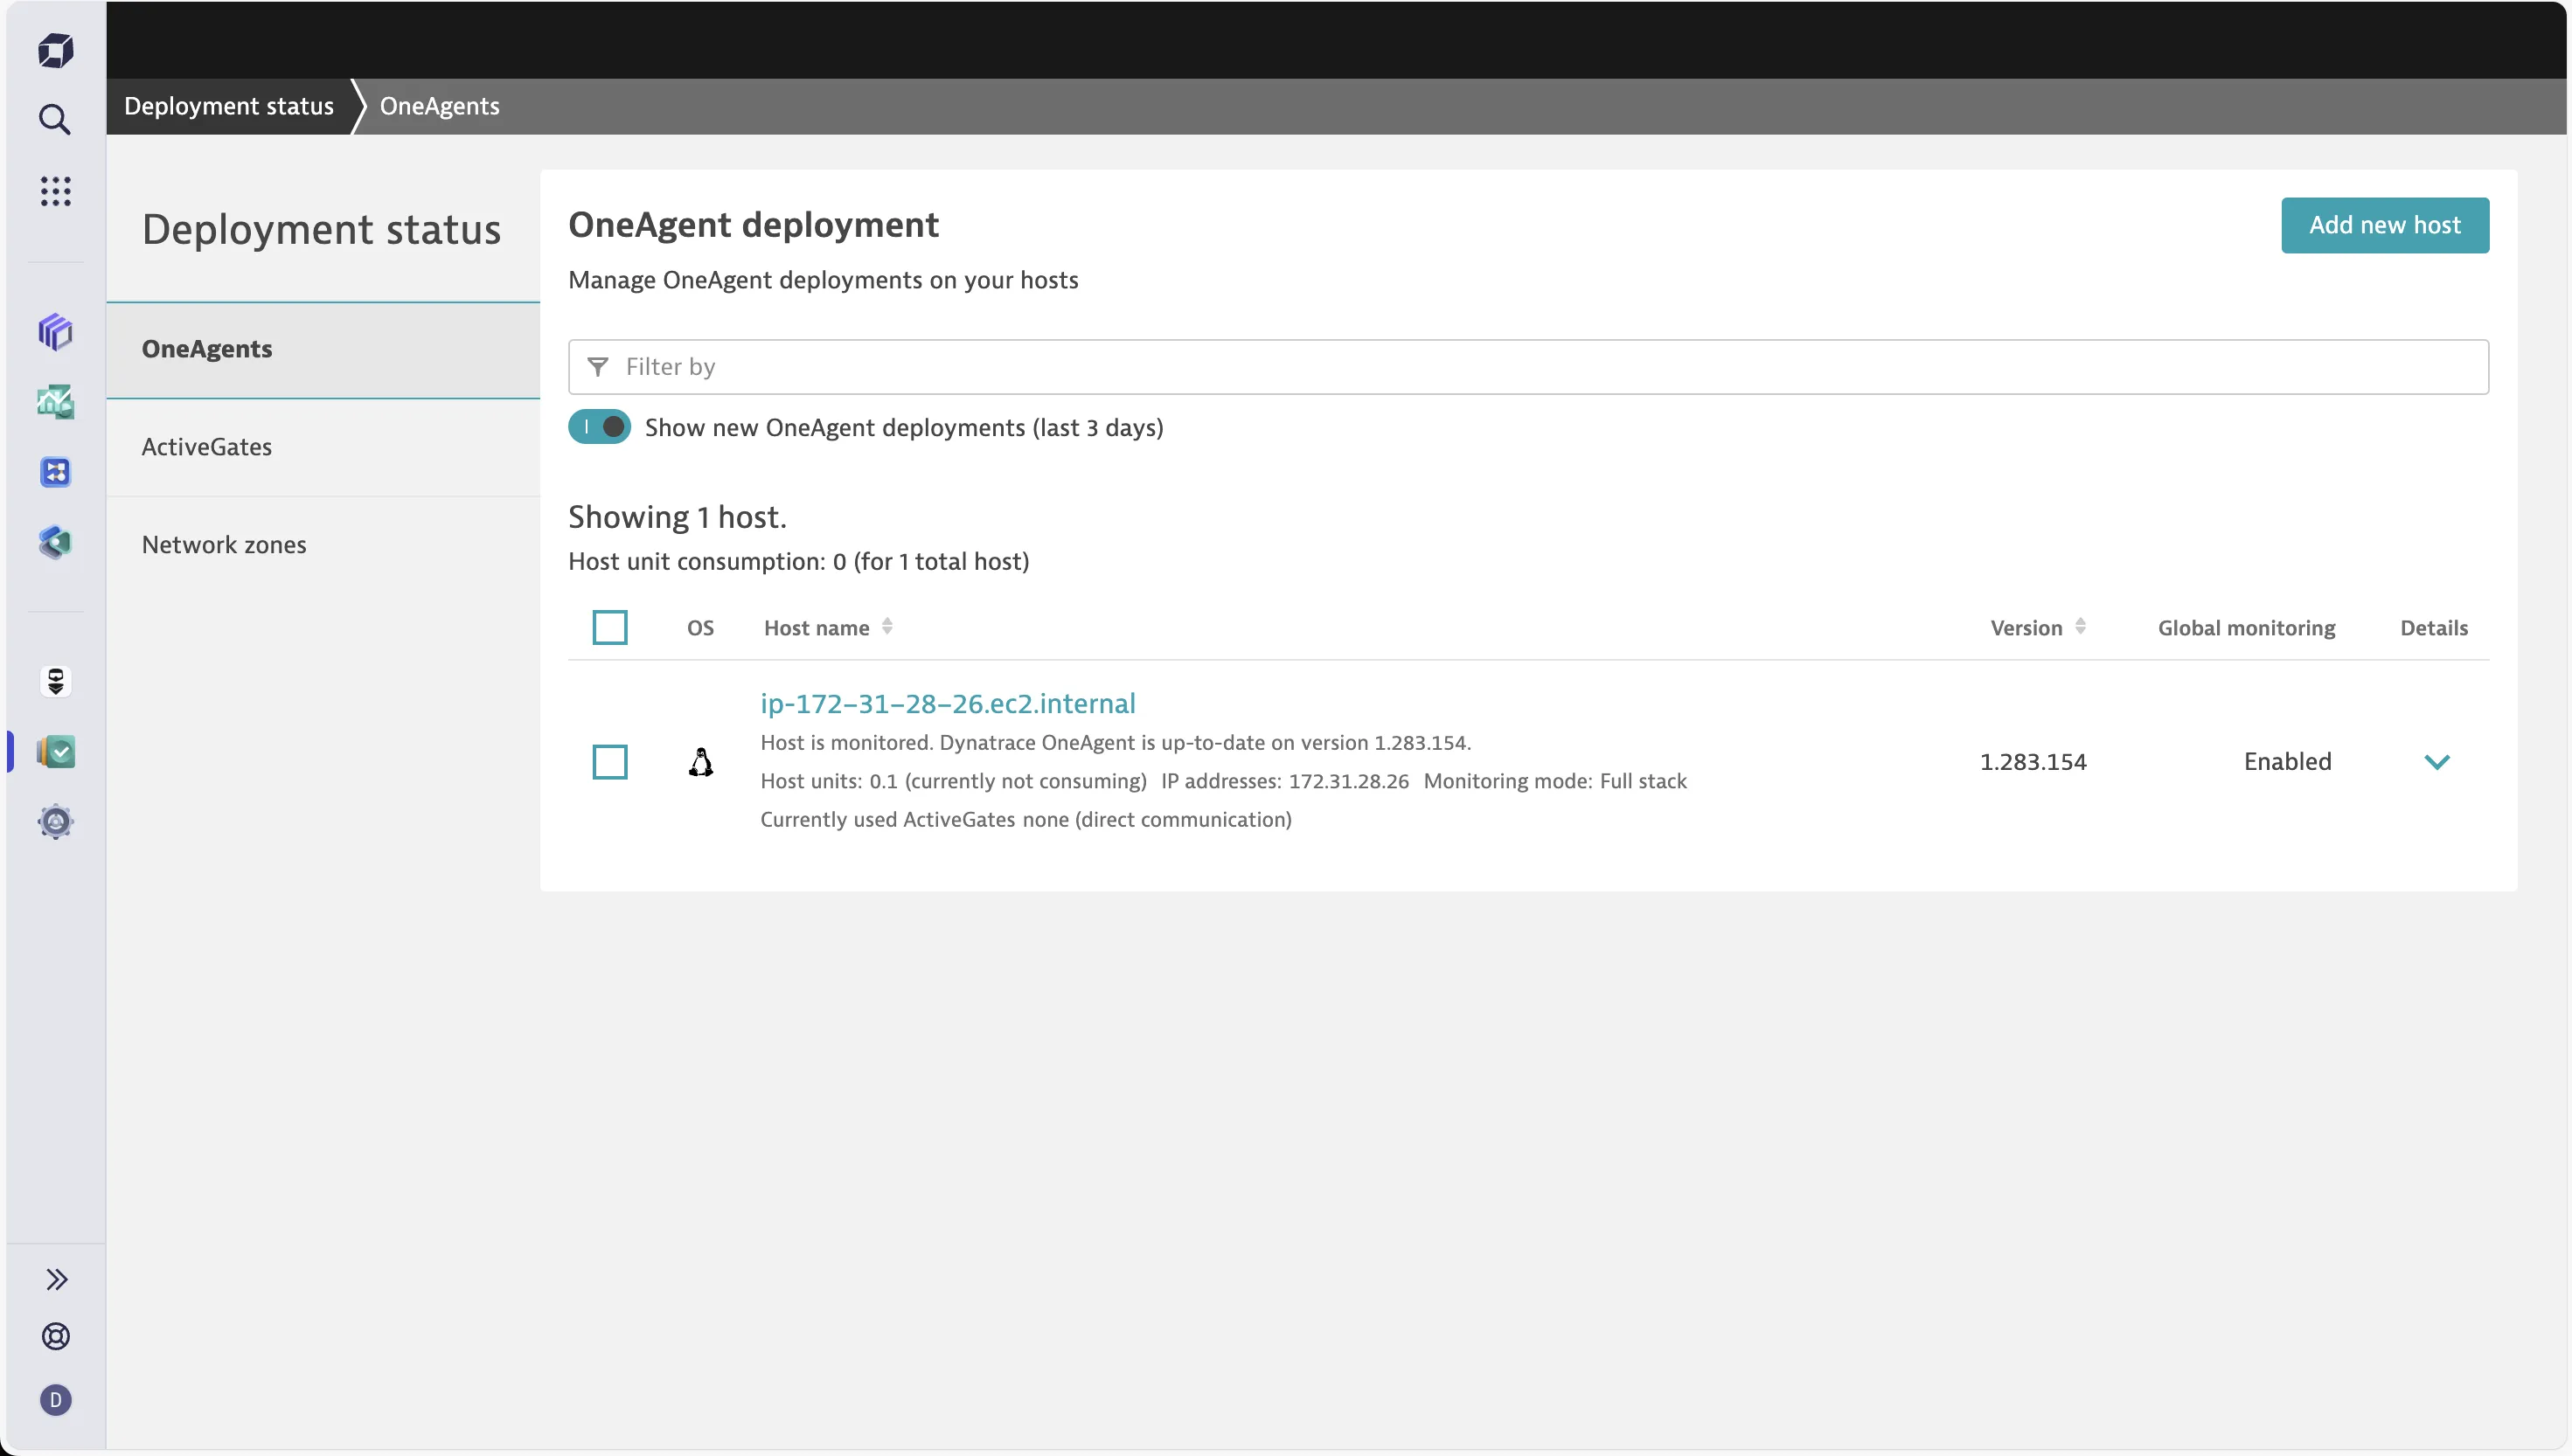
I went to the Dynatrace website to check. The OneAgent tab showed that I had one host connected, and it was being monitored.
Unlike Datadog, I didn’t have to install anything additional (for now). Dynatrace automatically started monitoring both the Python application, and the MongoDB I was running.
I will talk about the monitoring aspects next.
Infrastructure Monitoring: Both provide detailed views
Datadog
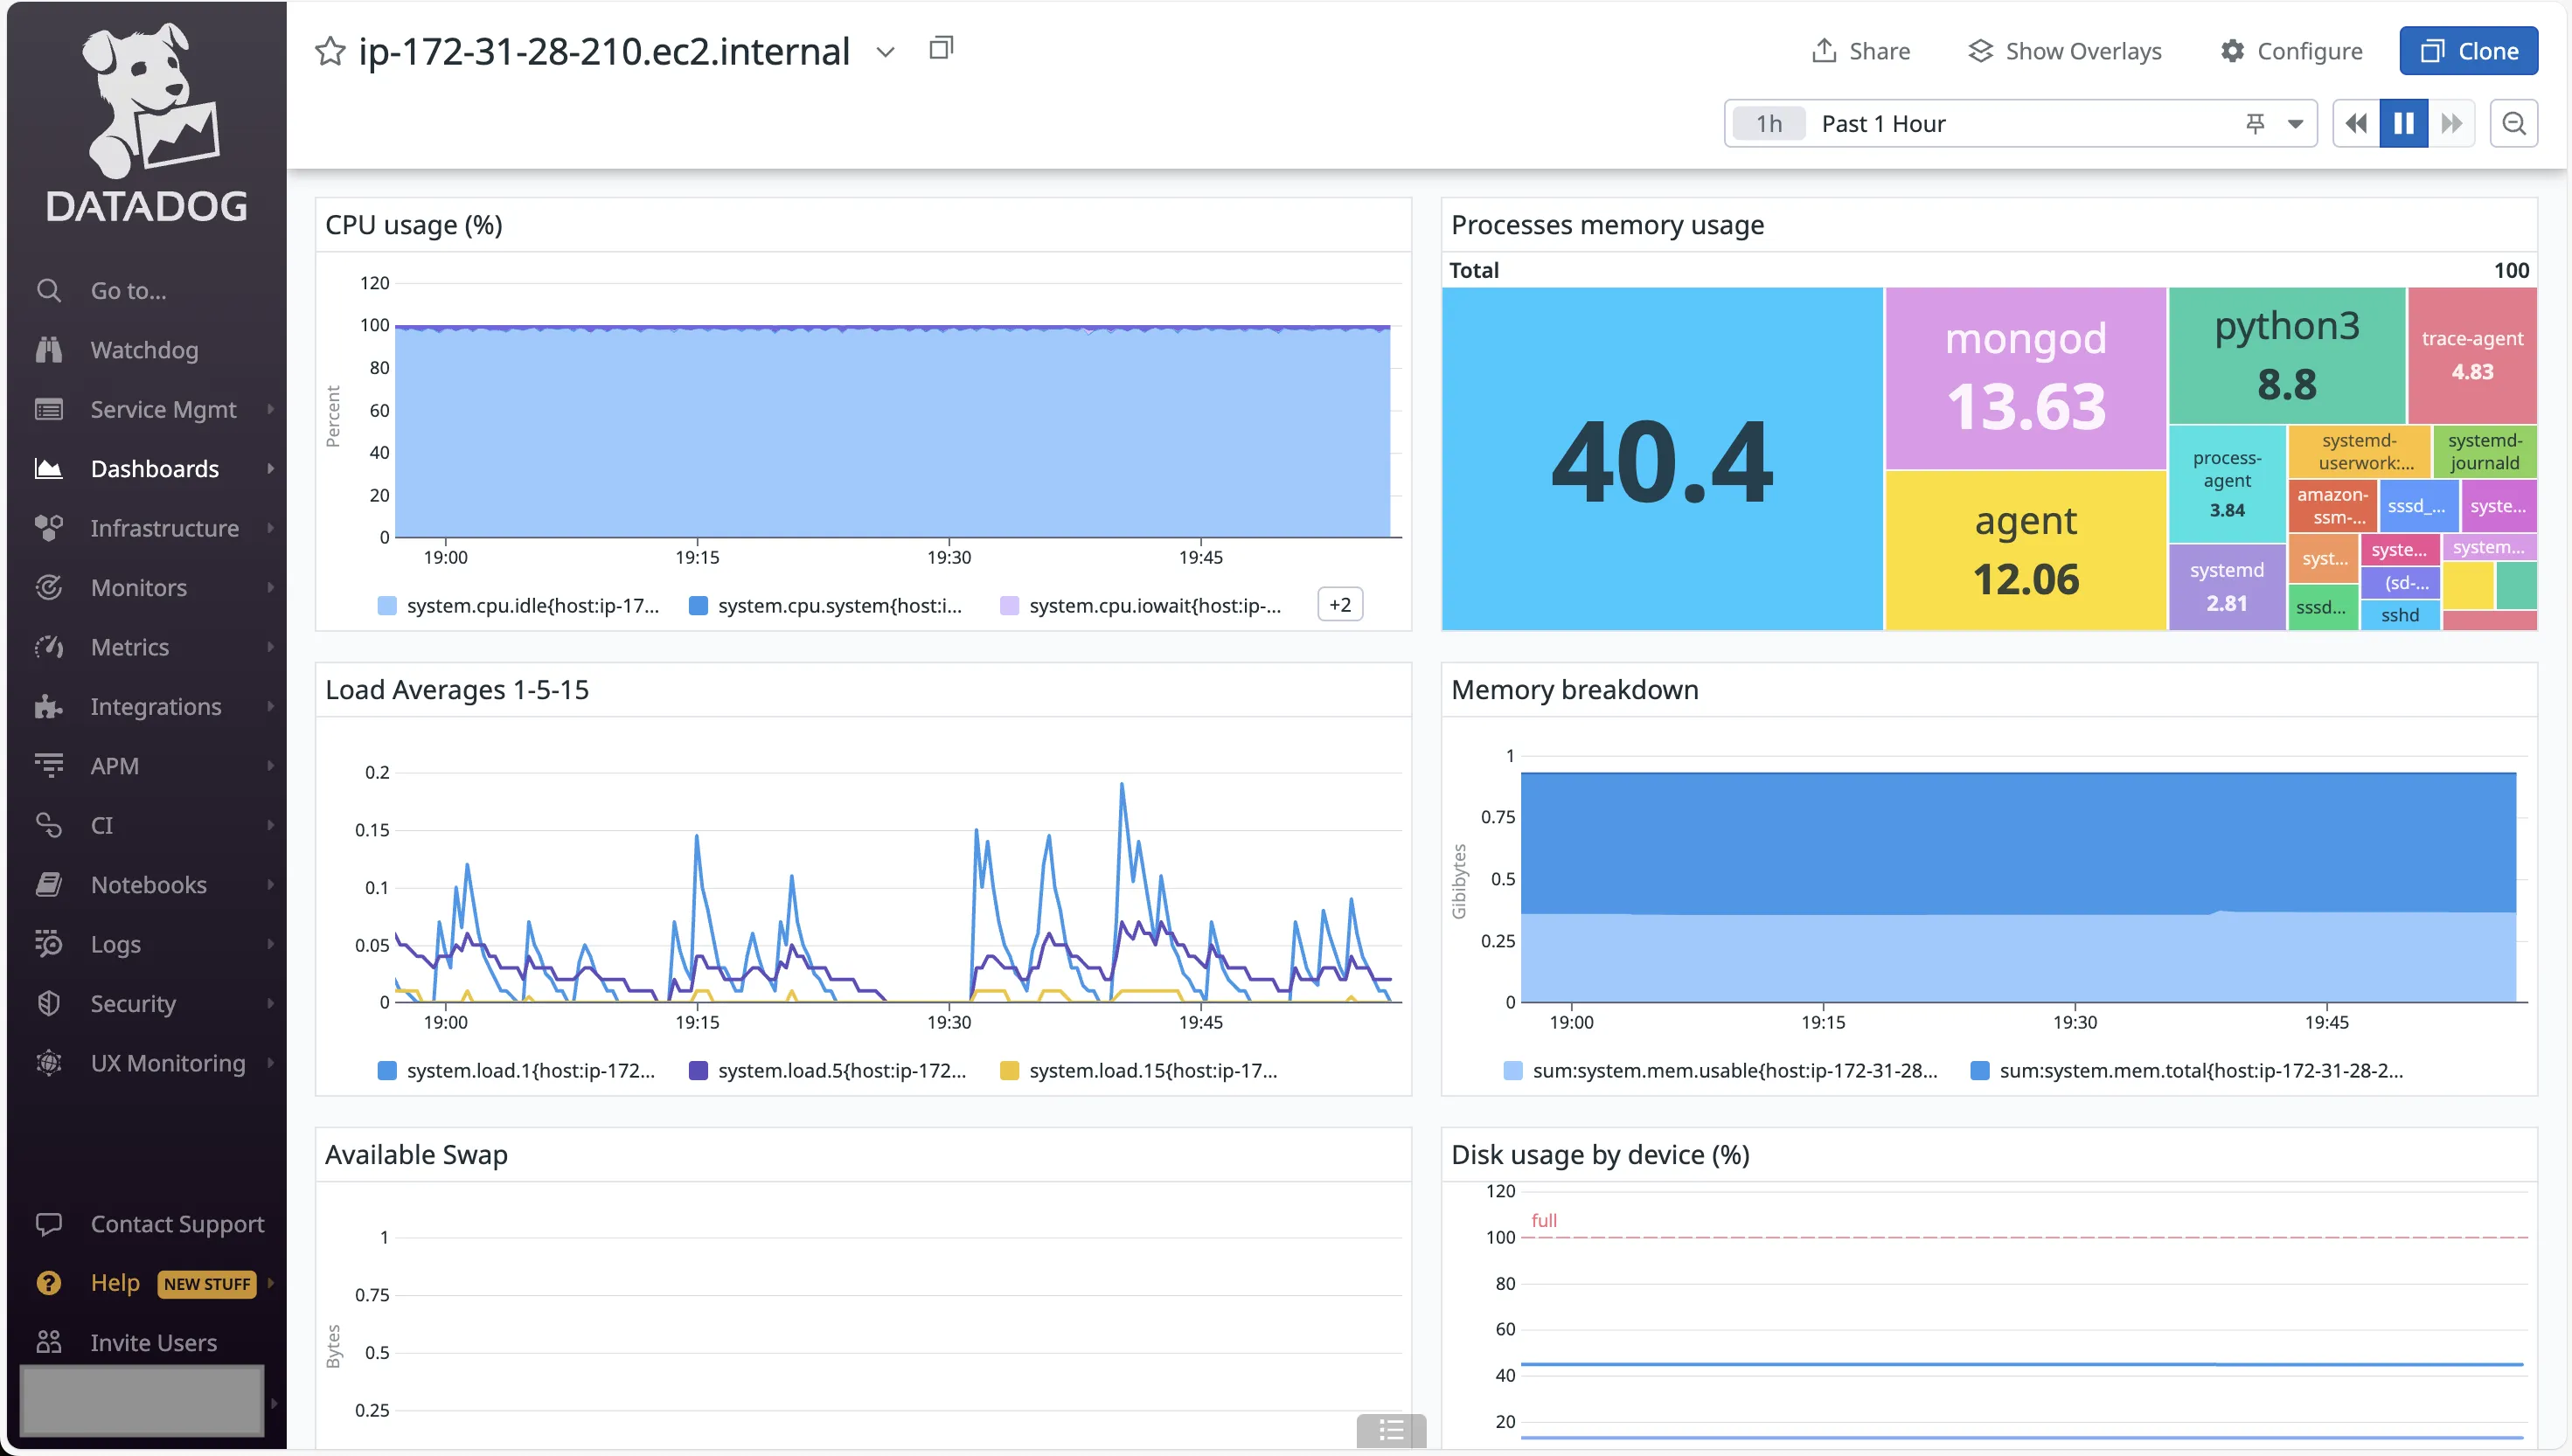
Datadog presented an easy-to-follow dashboard for my EC2 instance. It showed the basics like CPU, Load, and Memory, along with the processes that were running on the instance.
APM isn’t a part of this dashboard. That resides as a separate tab.
Dynatrace
Dynatrace provided a single window where all the metrics were present. As I scrolled down the page, I could find all the necessary metrics that one might need to get started with.
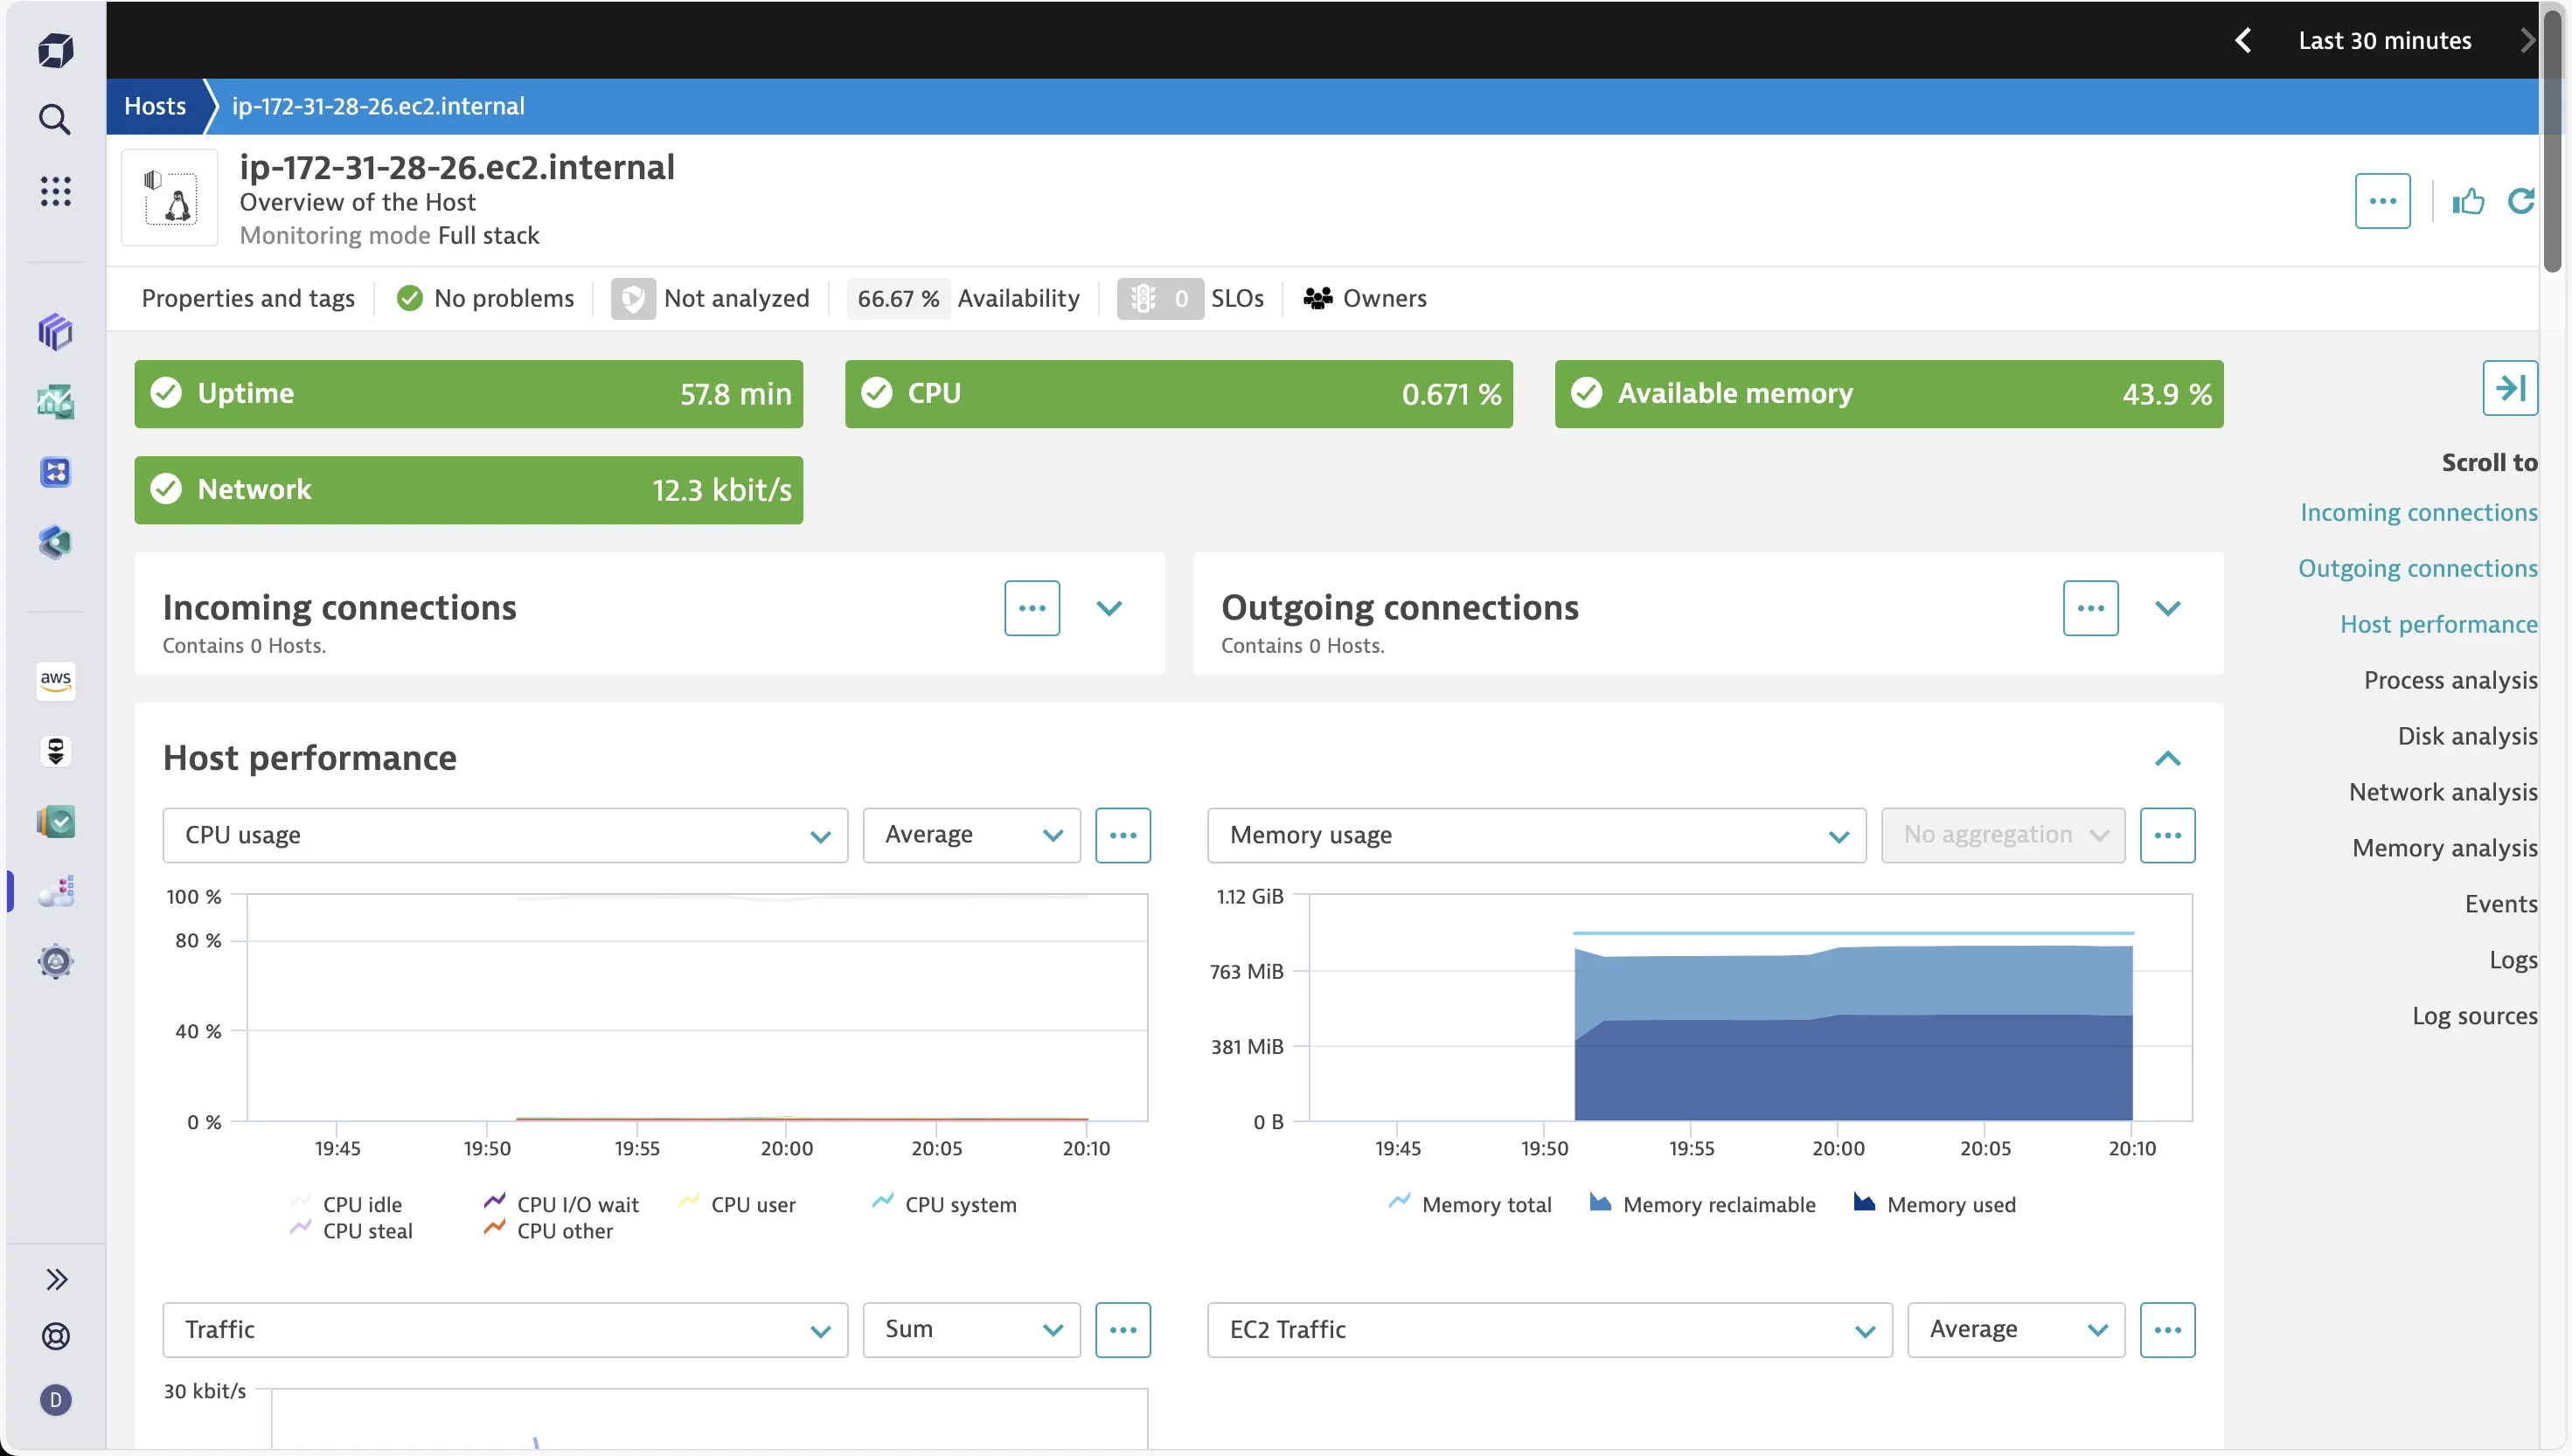
One major differentiator with Datadog is the fact that in Dynatrace I could navigate to the APM from this dashboard itself. The Process analysis section showed all the processes that were running on the EC2 instance.
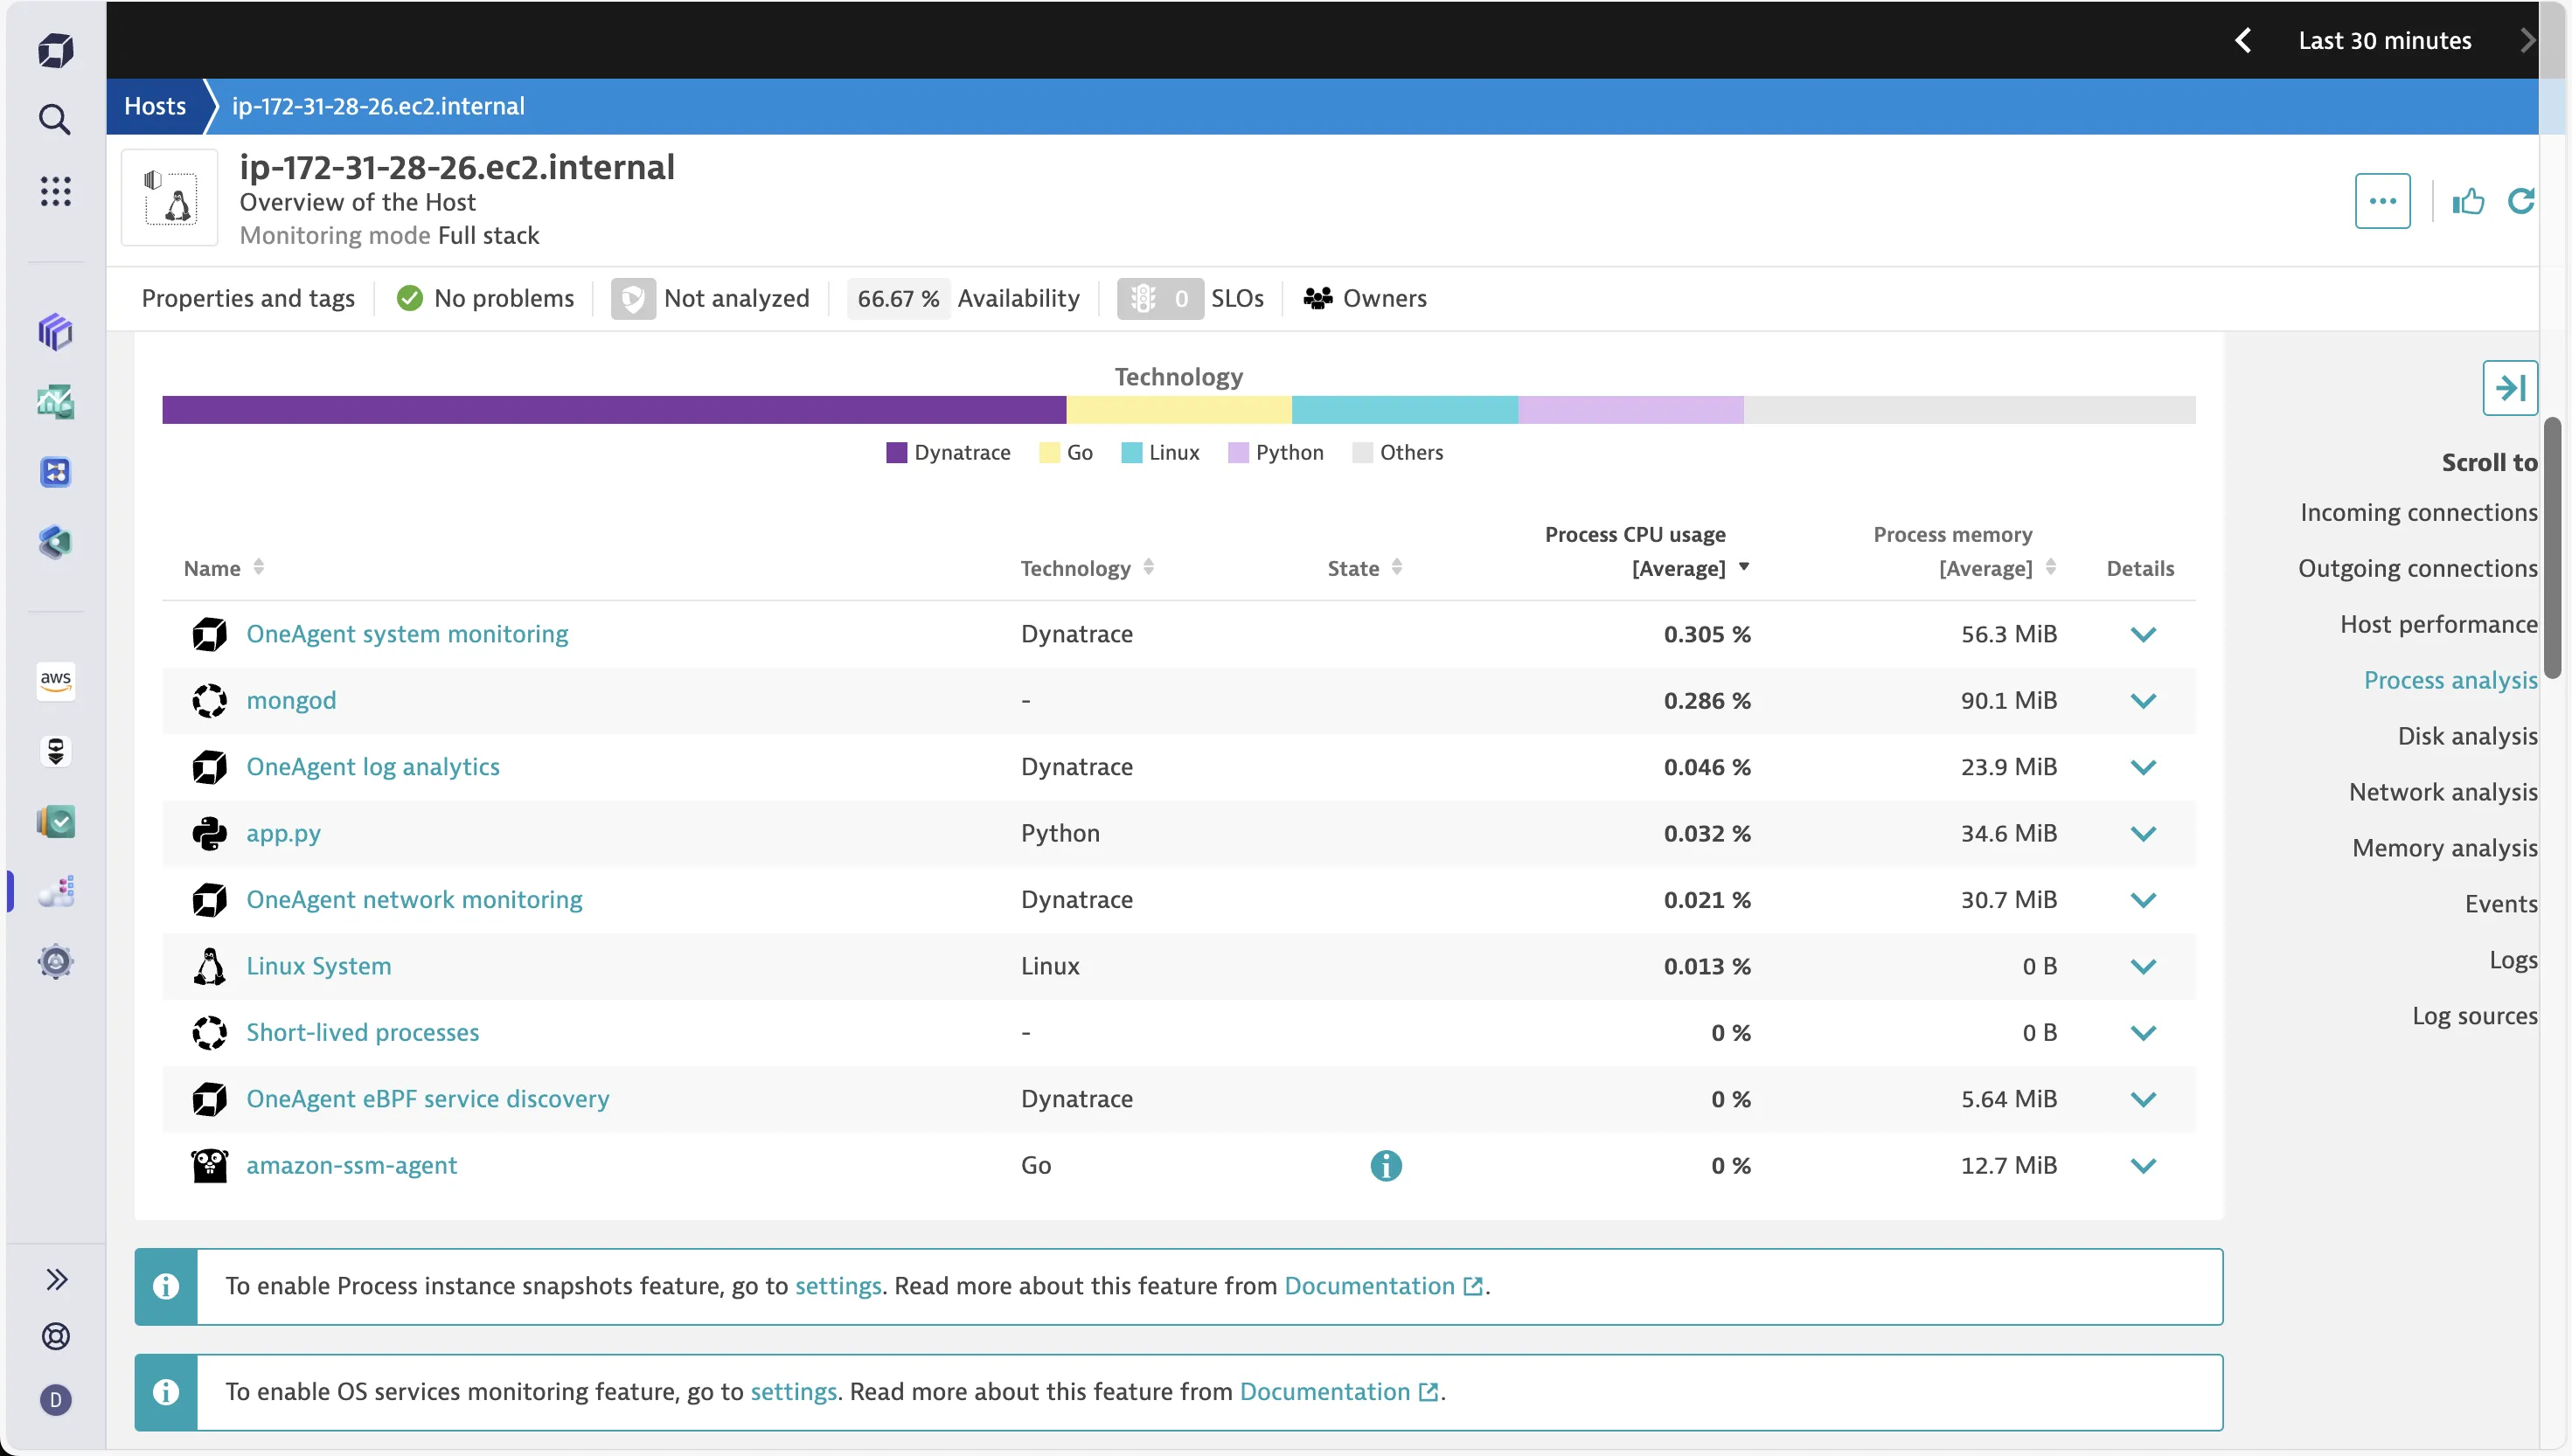
On clicking the Python app, I was taken to a detailed view where it not only showed the application metrics but also showed how it was connected to the MongoDB process. I found this rather interesting.
Application Monitoring: Datadog is simpler to start with
Datadog
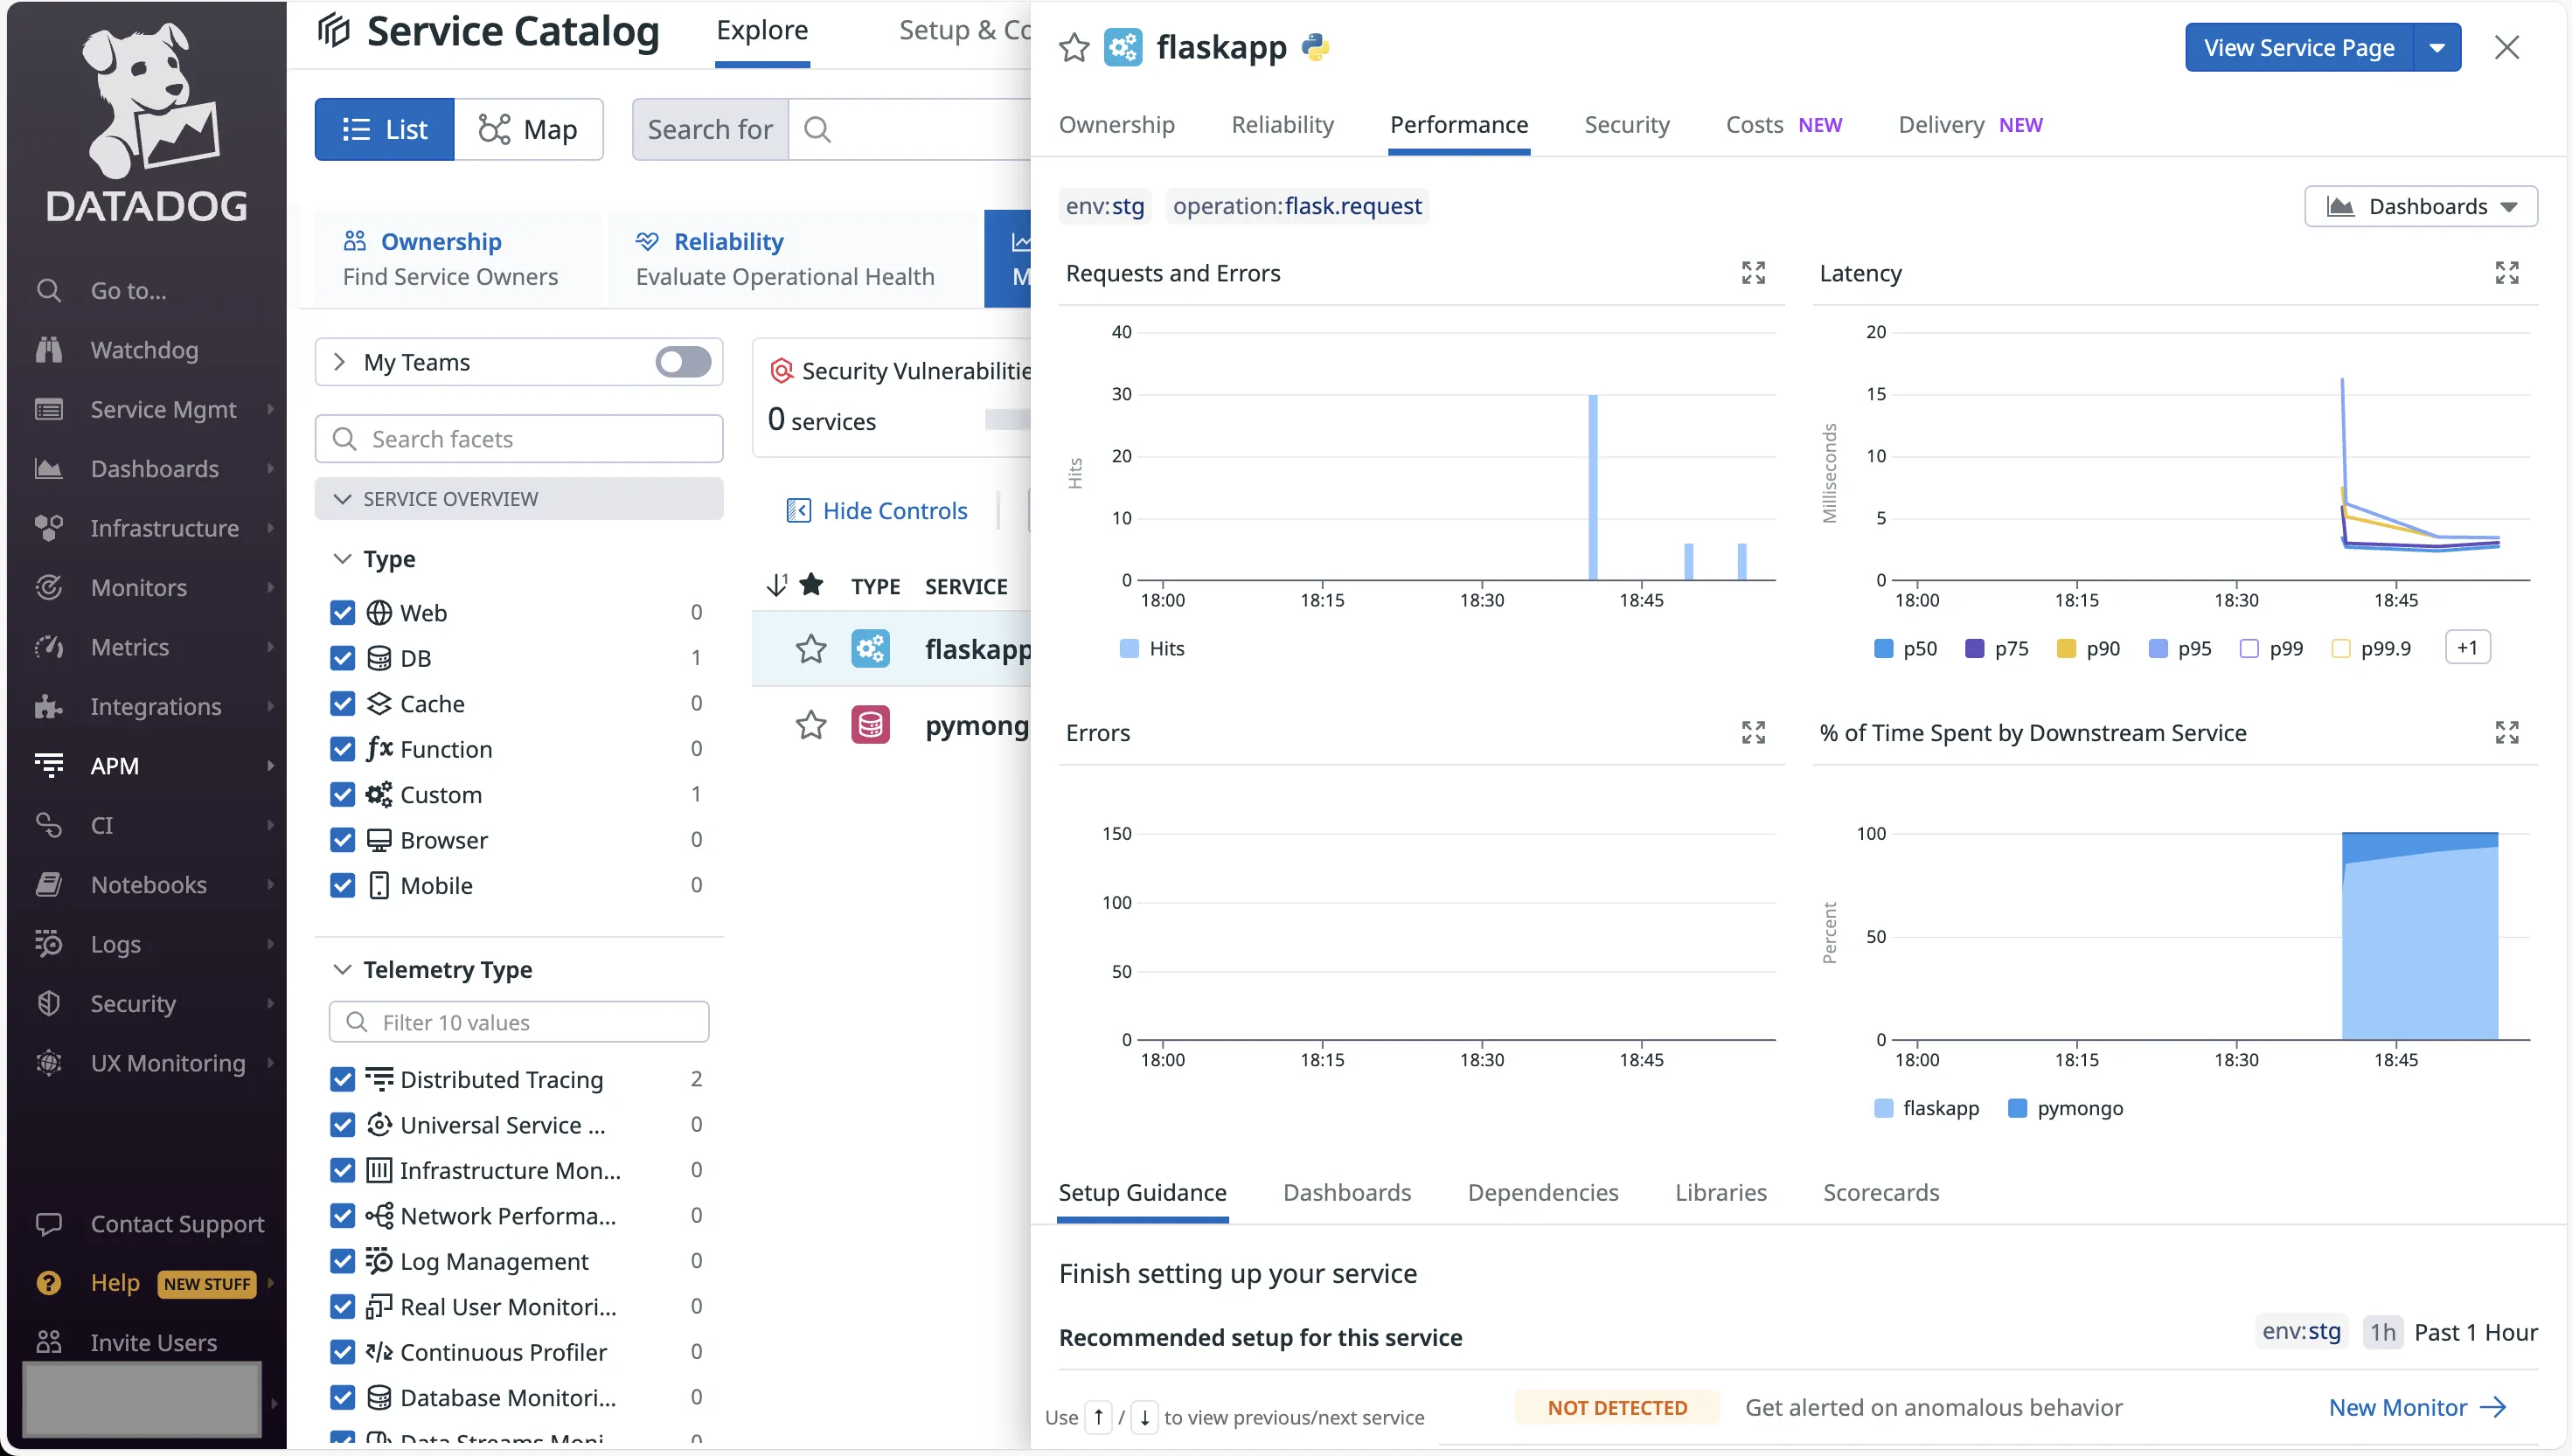
Datadog has a separate tab for APM. On navigating there, I could see both my Python application and the MongoDB database being monitored.
Clicking on the app opened up a quick view of the Performance metrics. This included Requests and Errors, Latency, and % of time spent across services.
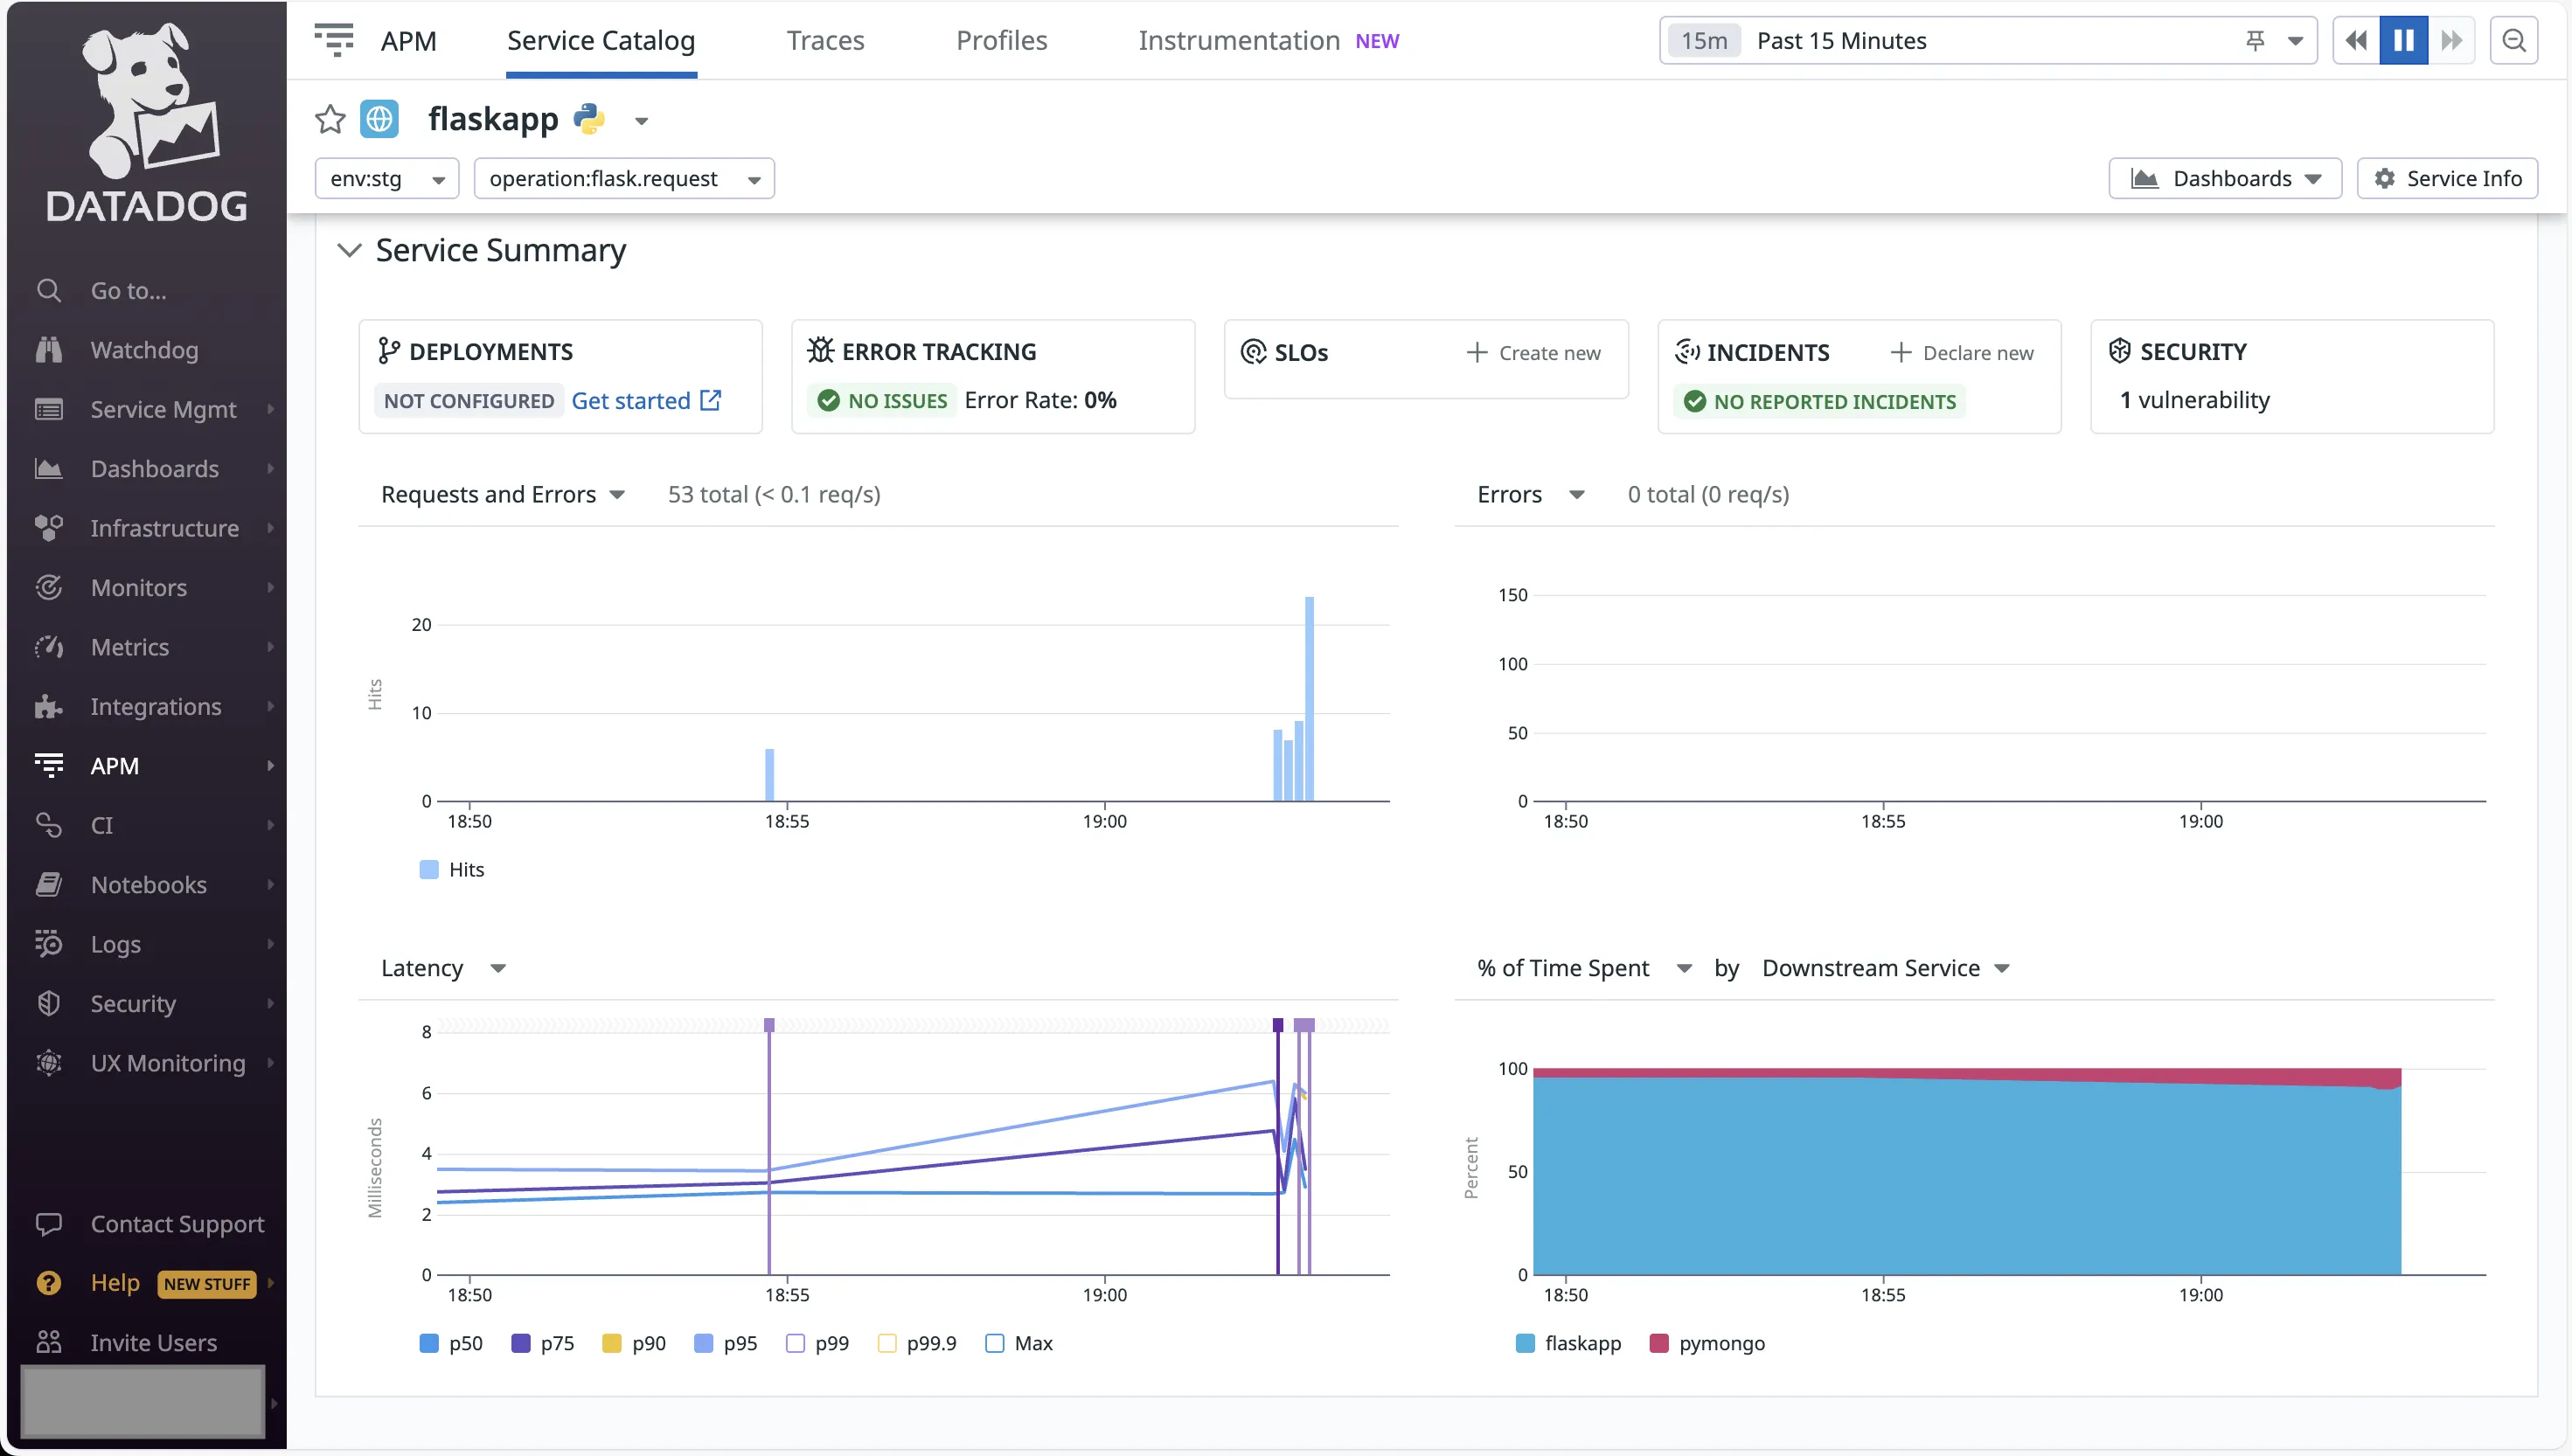
The app specific service page provided detailed view for the monitored metrics.
Even the database monitoring for MongoDB showed important metrics, including the database resources being called, along with latency and errors.
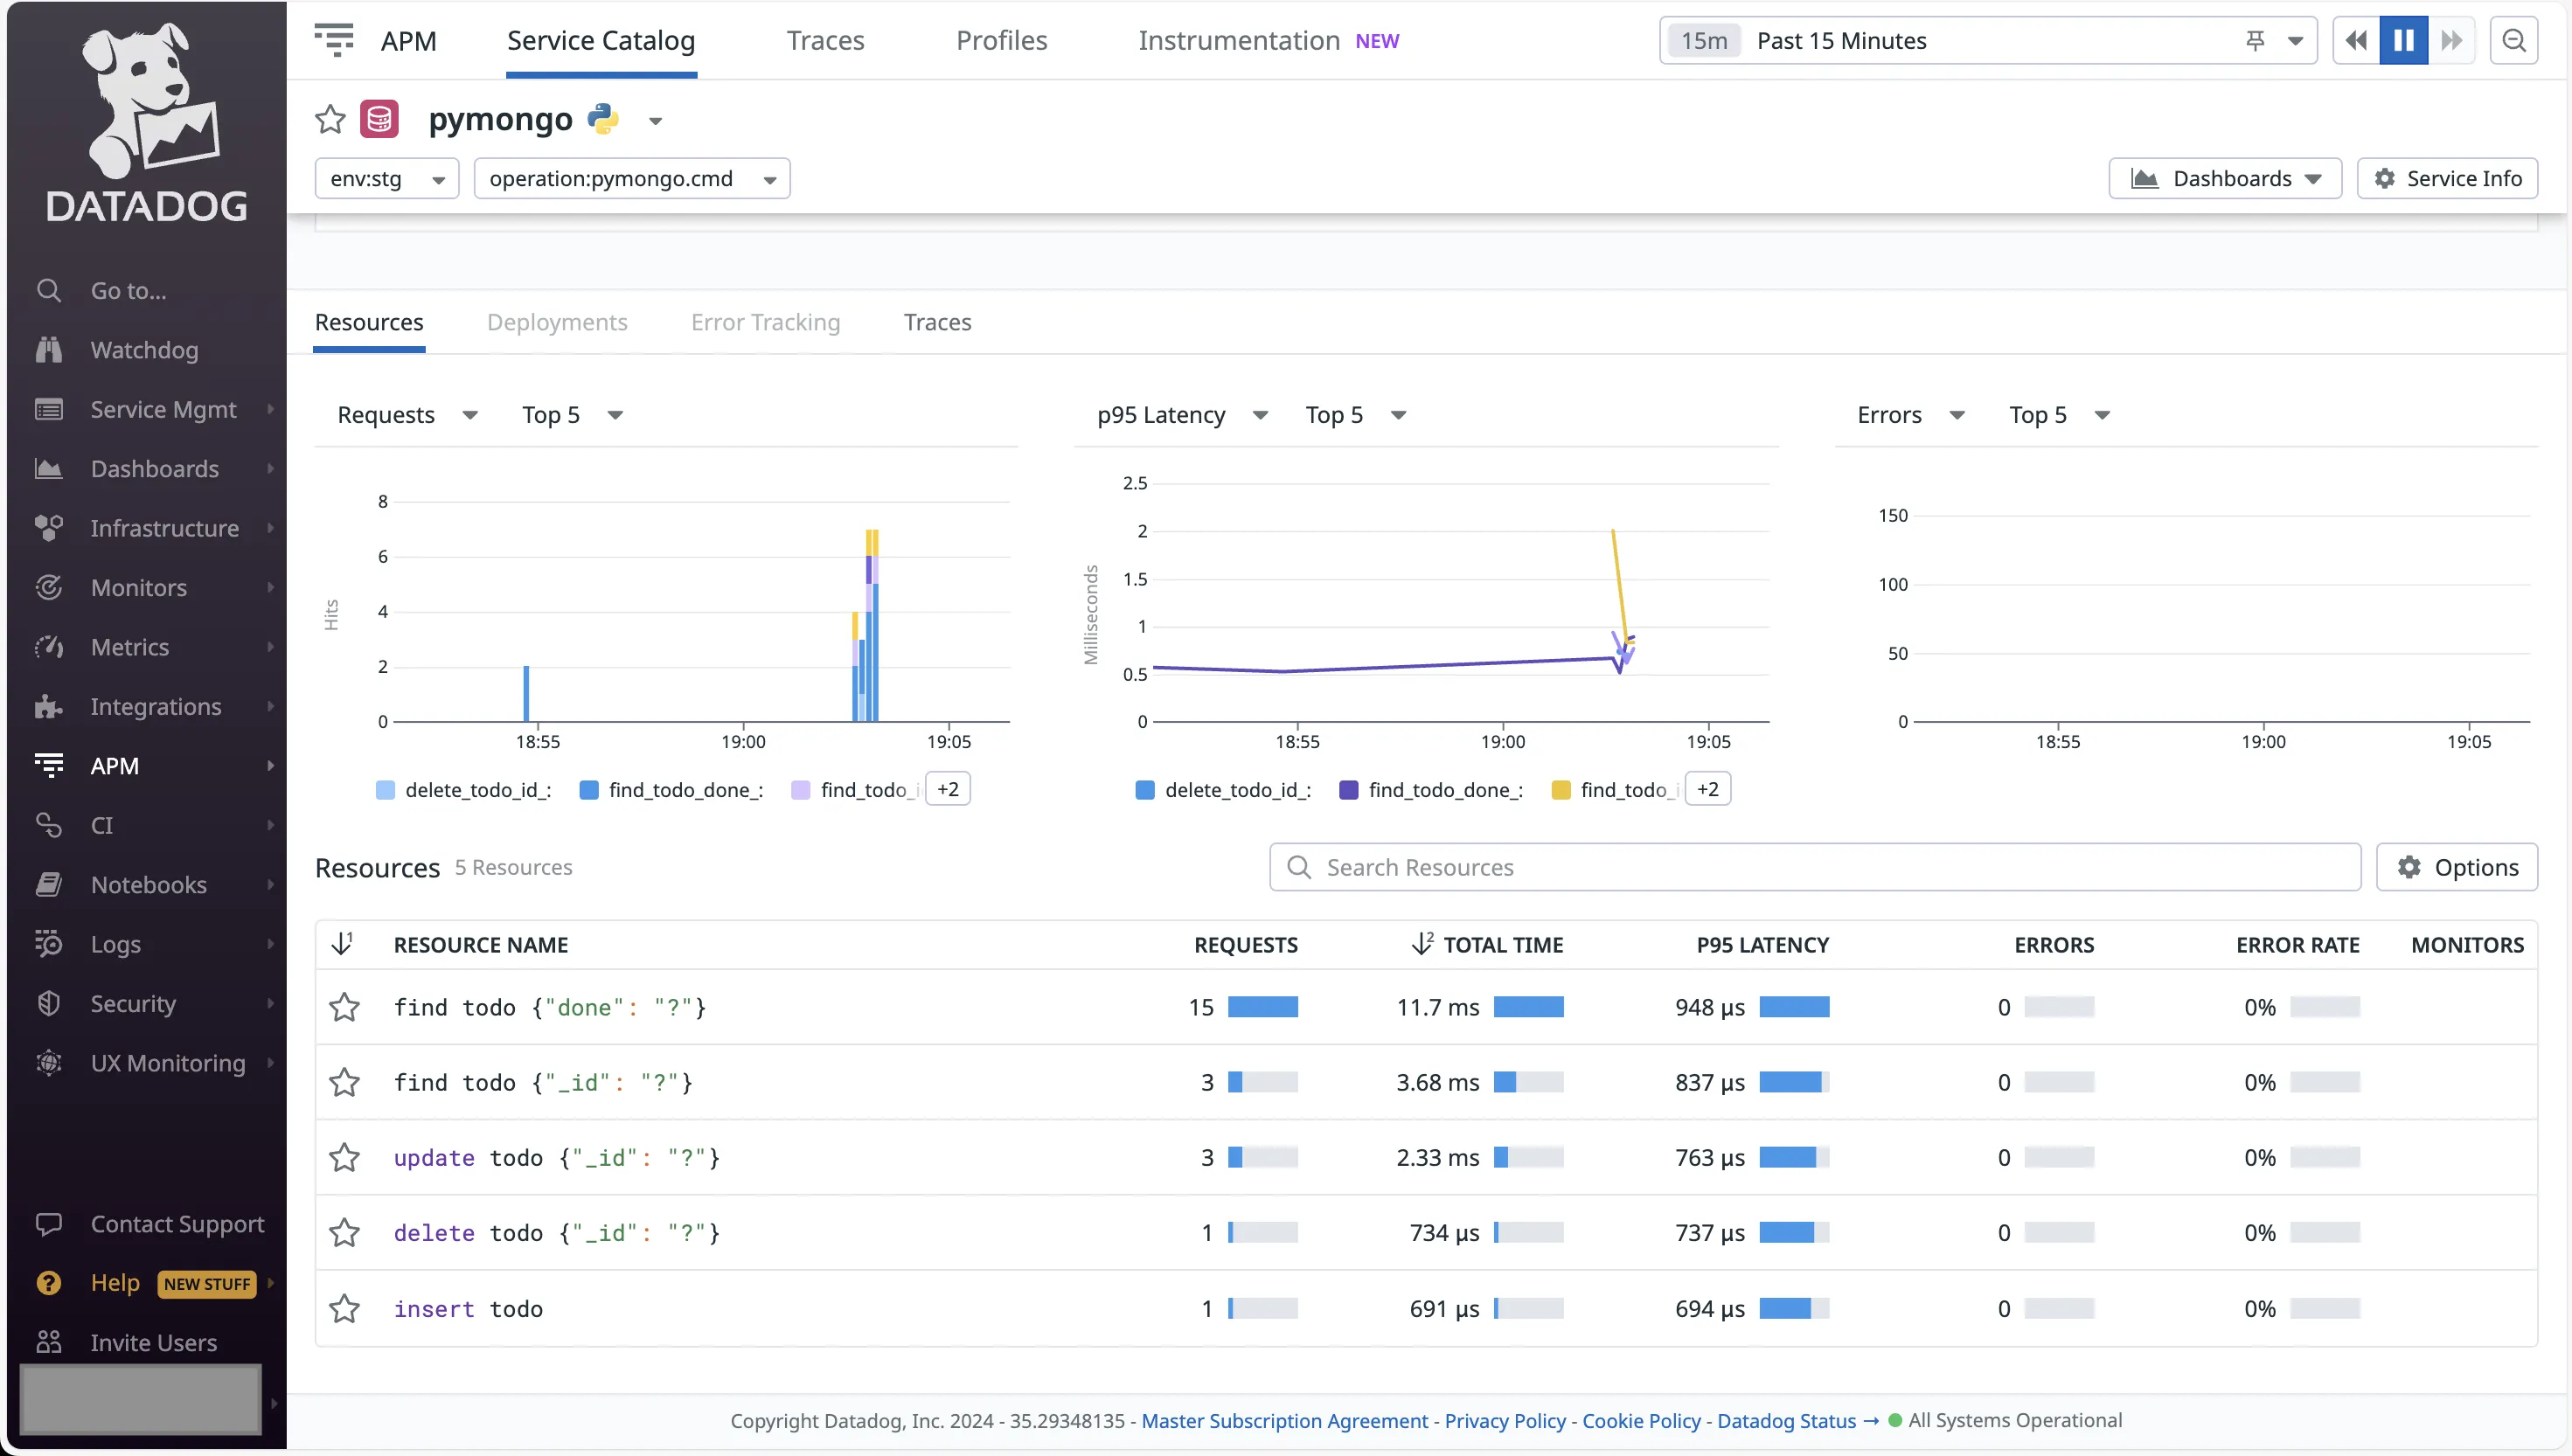
Although everything had a separate panel, it was detailed enough to check all the necessary metrics thoroughly.
Dynatrace
After checking the infrastructure and process metrics, I wanted to look at the application metrics, along with Logs and Traces. I once again found myself lost in the UI, trying to figure out where to go next. After searching for a while, I came across the documentation for setting up application metrics.
Dynatrace offers two options for instrumentation — using the OneAgent module for Python or using OpenTelemetry. The former required changes to code, and that’s not something I was looking for. Hence, I opted for the OpenTelemetry route.
Next, it was time for me to set up the required configuration. Going through the documentation, I had to figure out the OLTP endpoint, and the access token. Generating the access token was tricky as you have to know the access scopes required. I had to go to another document to find it.
With these in place, I had to install the python packages for opentelemetry. After that, I had to restart the Python app with the opentelemetry-instrument command.
Back in the Dynatrace UI, I had to look for the Distributed Traces option. Finally, I could see the traces being generated.
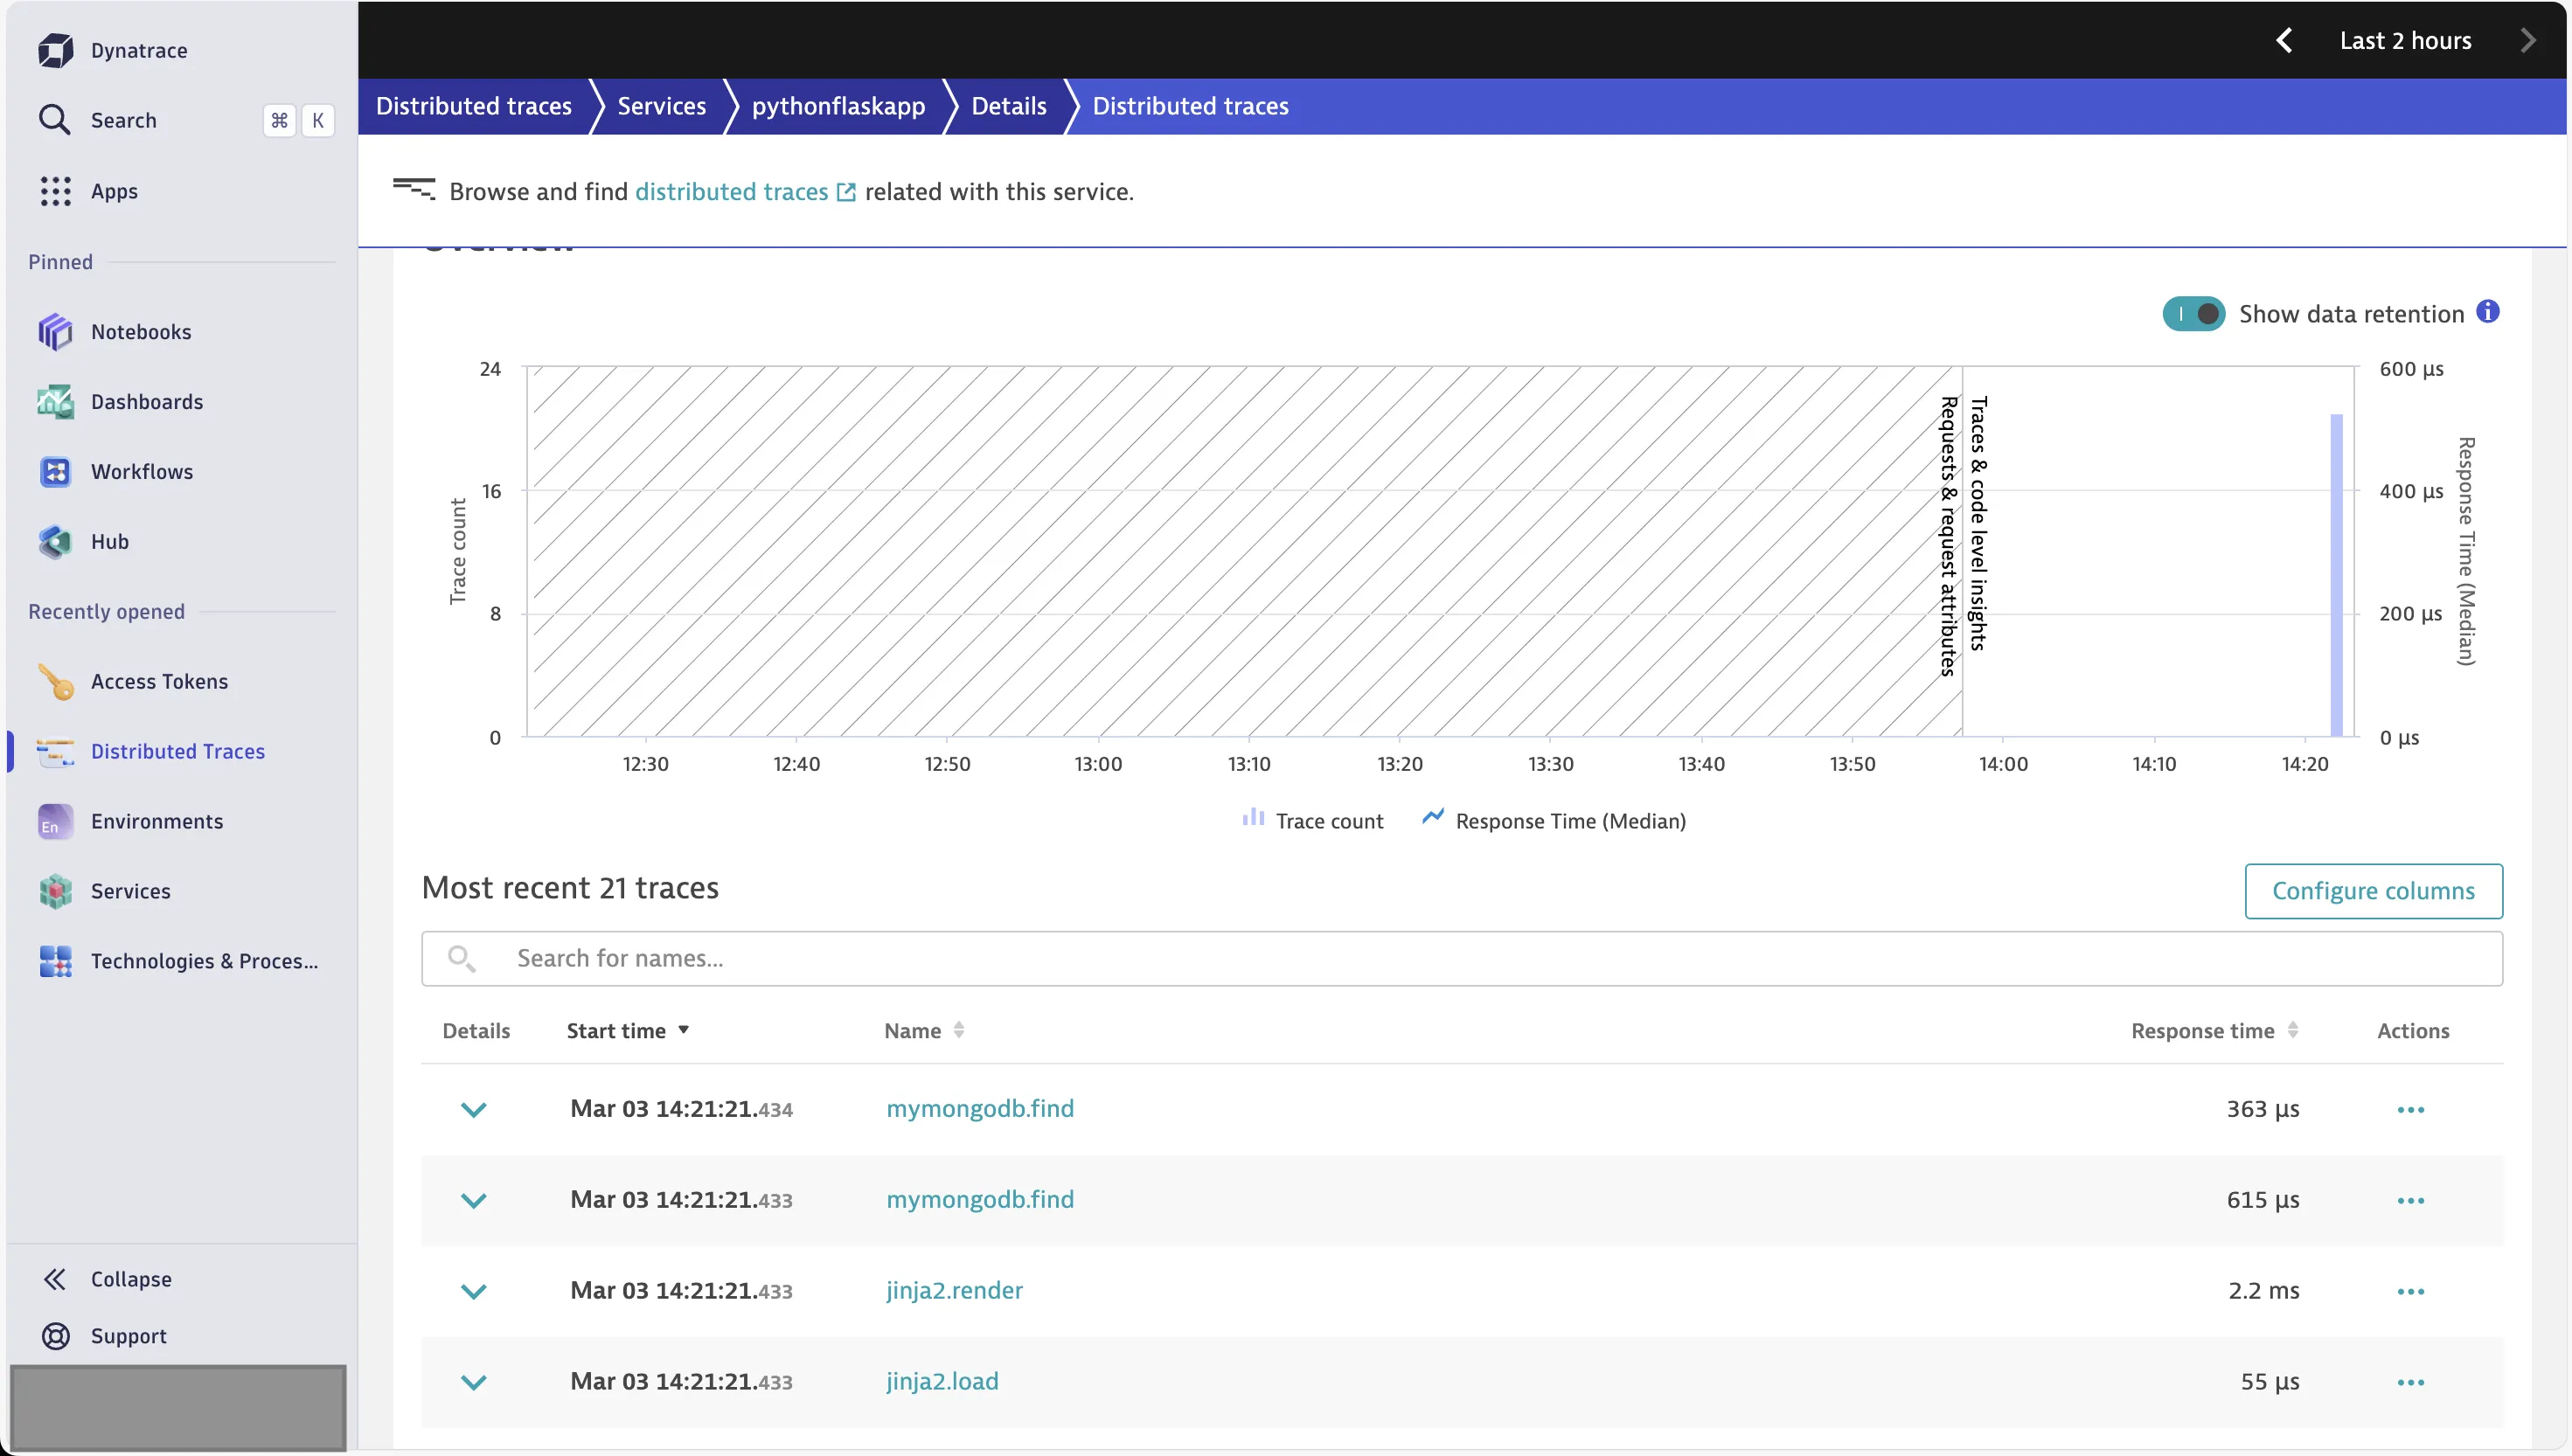
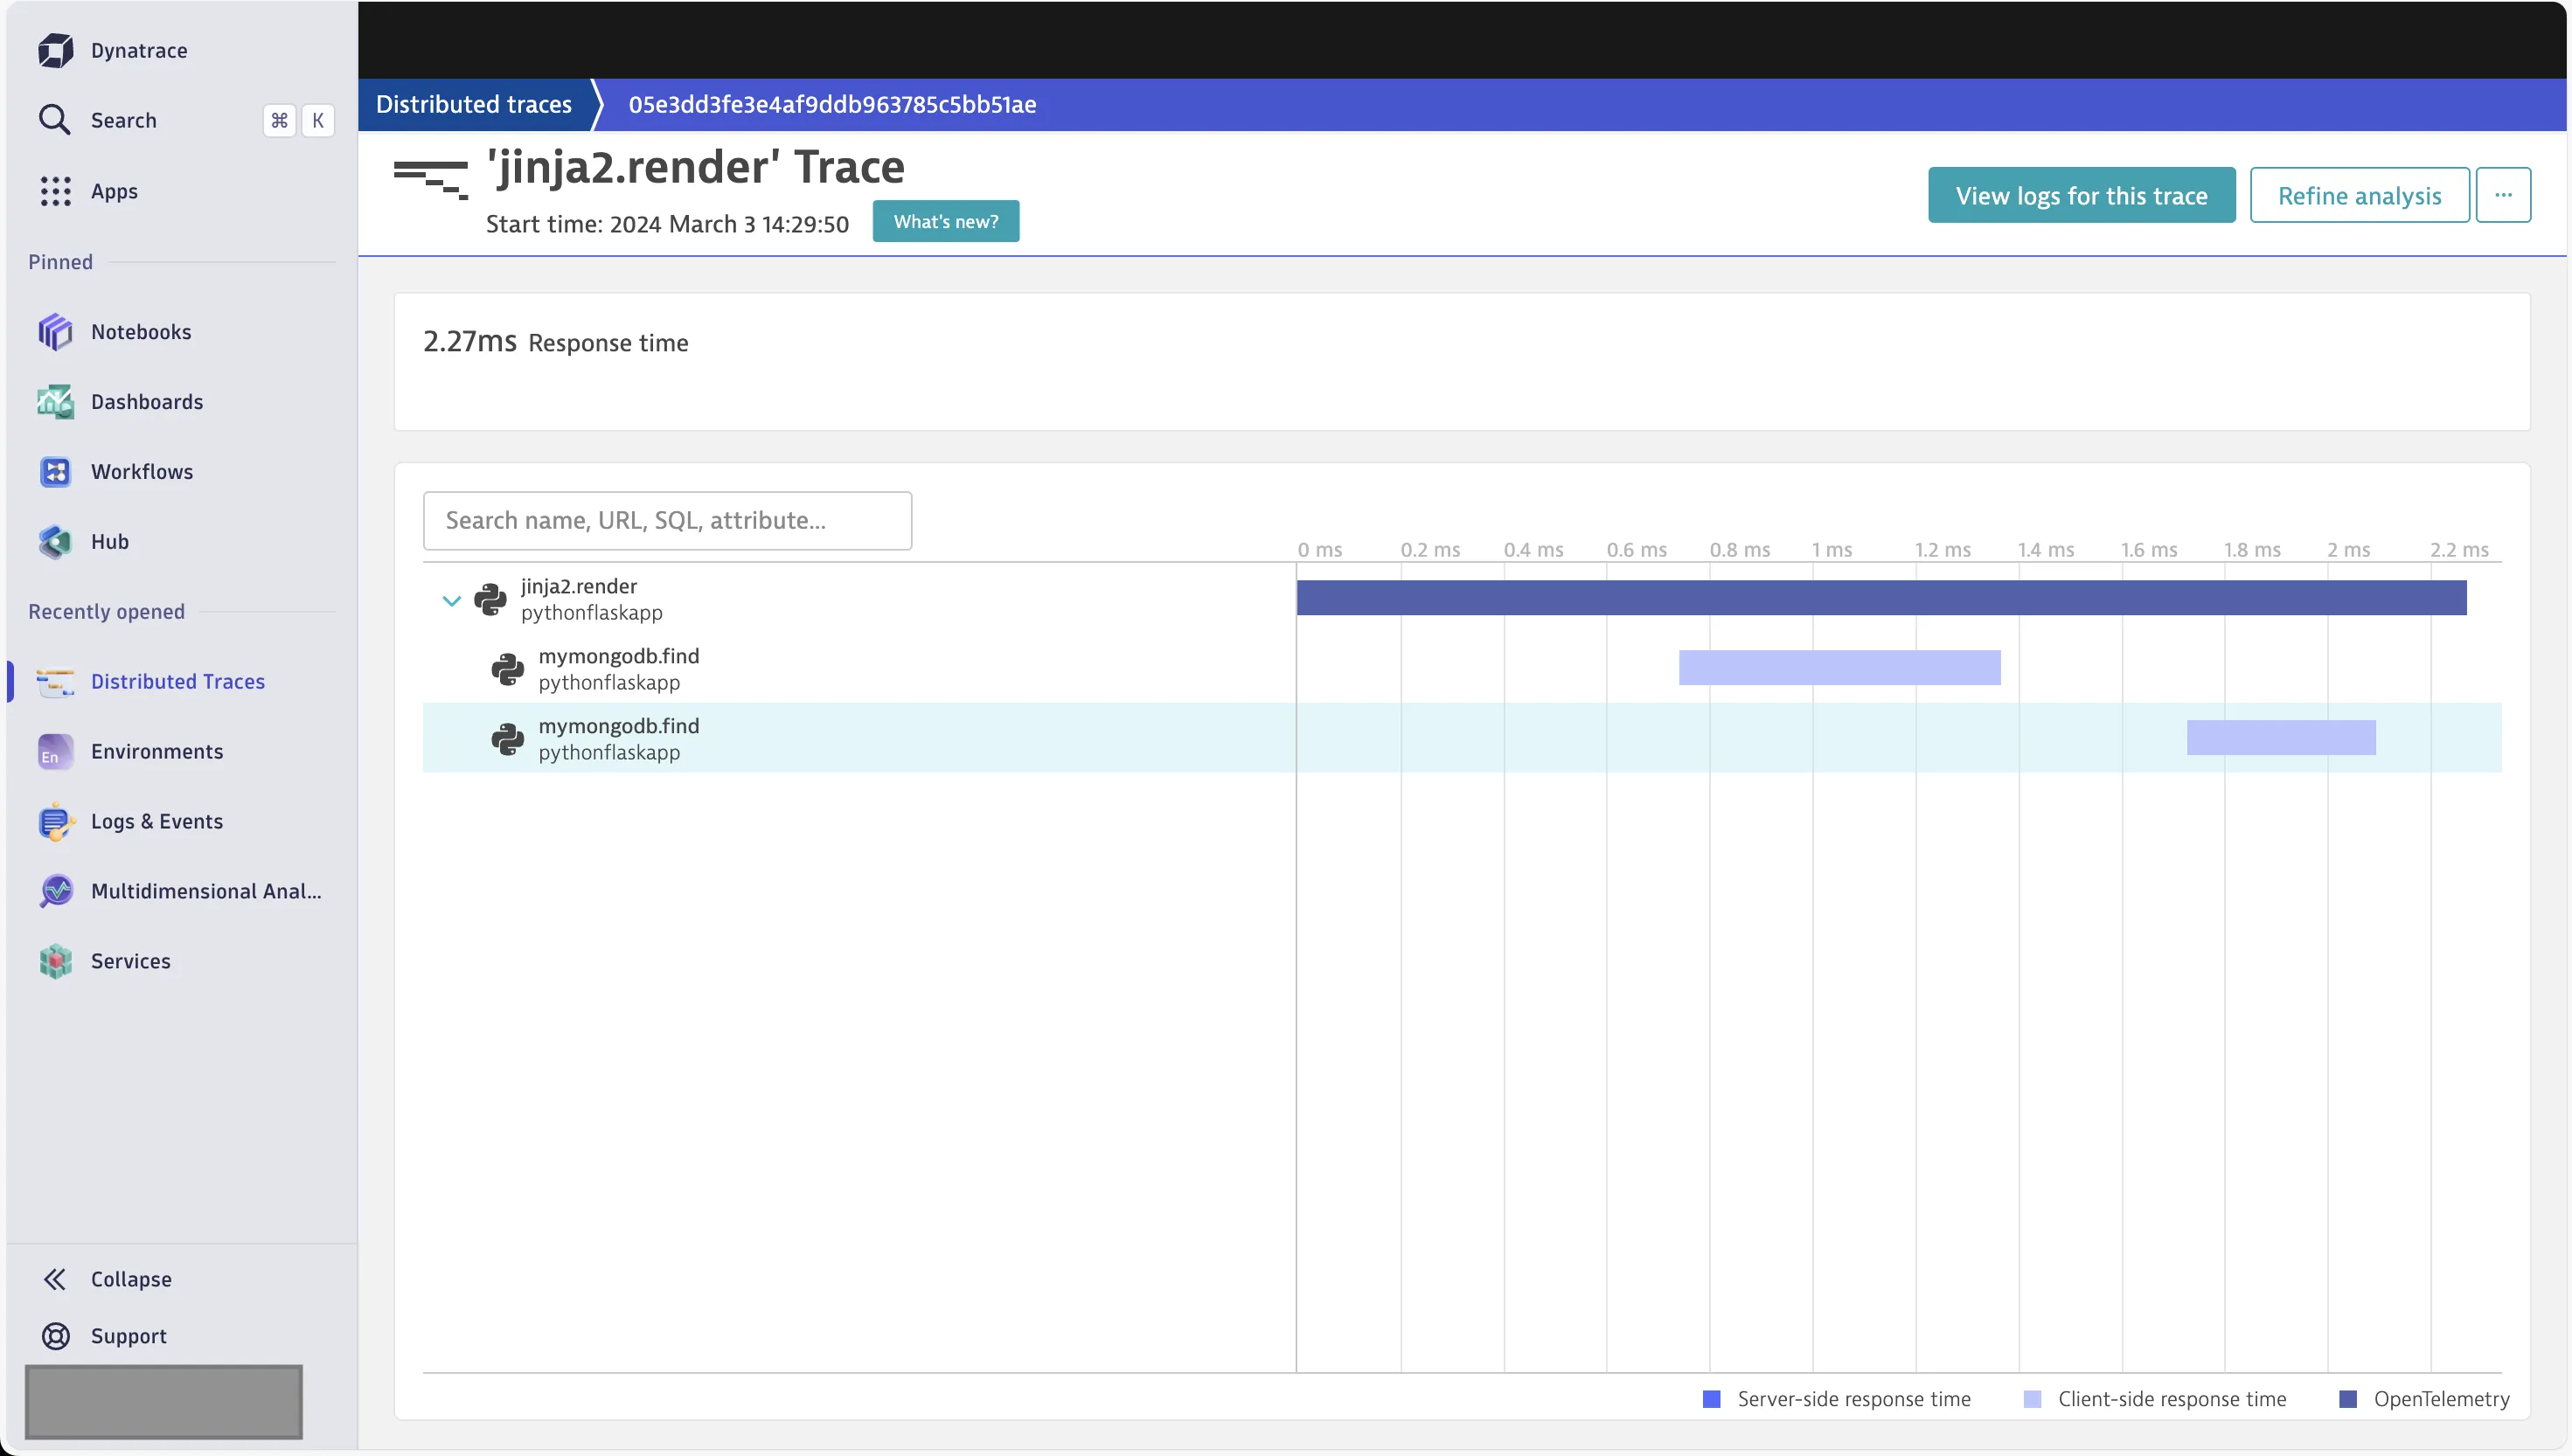
The UI is quite detailed. Clicking on any trace shows the relevant calls, as well as the option to see the logs for the trace.
Setting up the Request tracking for the REST endpoints needed additional configuration.
Logs Monitoring: Easier Setup with Dynatrace
Datadog
By default, the log exporter is disabled in the Datadog Agent. I had to manually make the required changes. The Datadog documentation provided the necessary steps to take.
First, I had to open the datadog.yaml configuration file. This was present in the /etc/datadog-agent directory. I had to use sudo in order to add the following changes.
logs_enabled: true
logs_config:
  force_use_http: true
After this, I had to restart the agent.
But this didn’t start capturing the application logs. I had to figure out a way to mention the log file, which for me was present in /tmp/server.log for the Python application.
I navigated to the /etc/datadog-agent/conf.d directory. Here, I created a python.d folder. Inside this folder, I created a conf.yaml file with the following content.
logs:
  - type: file
    path: /tmp/server.log
    service: flaskapp
    source: python
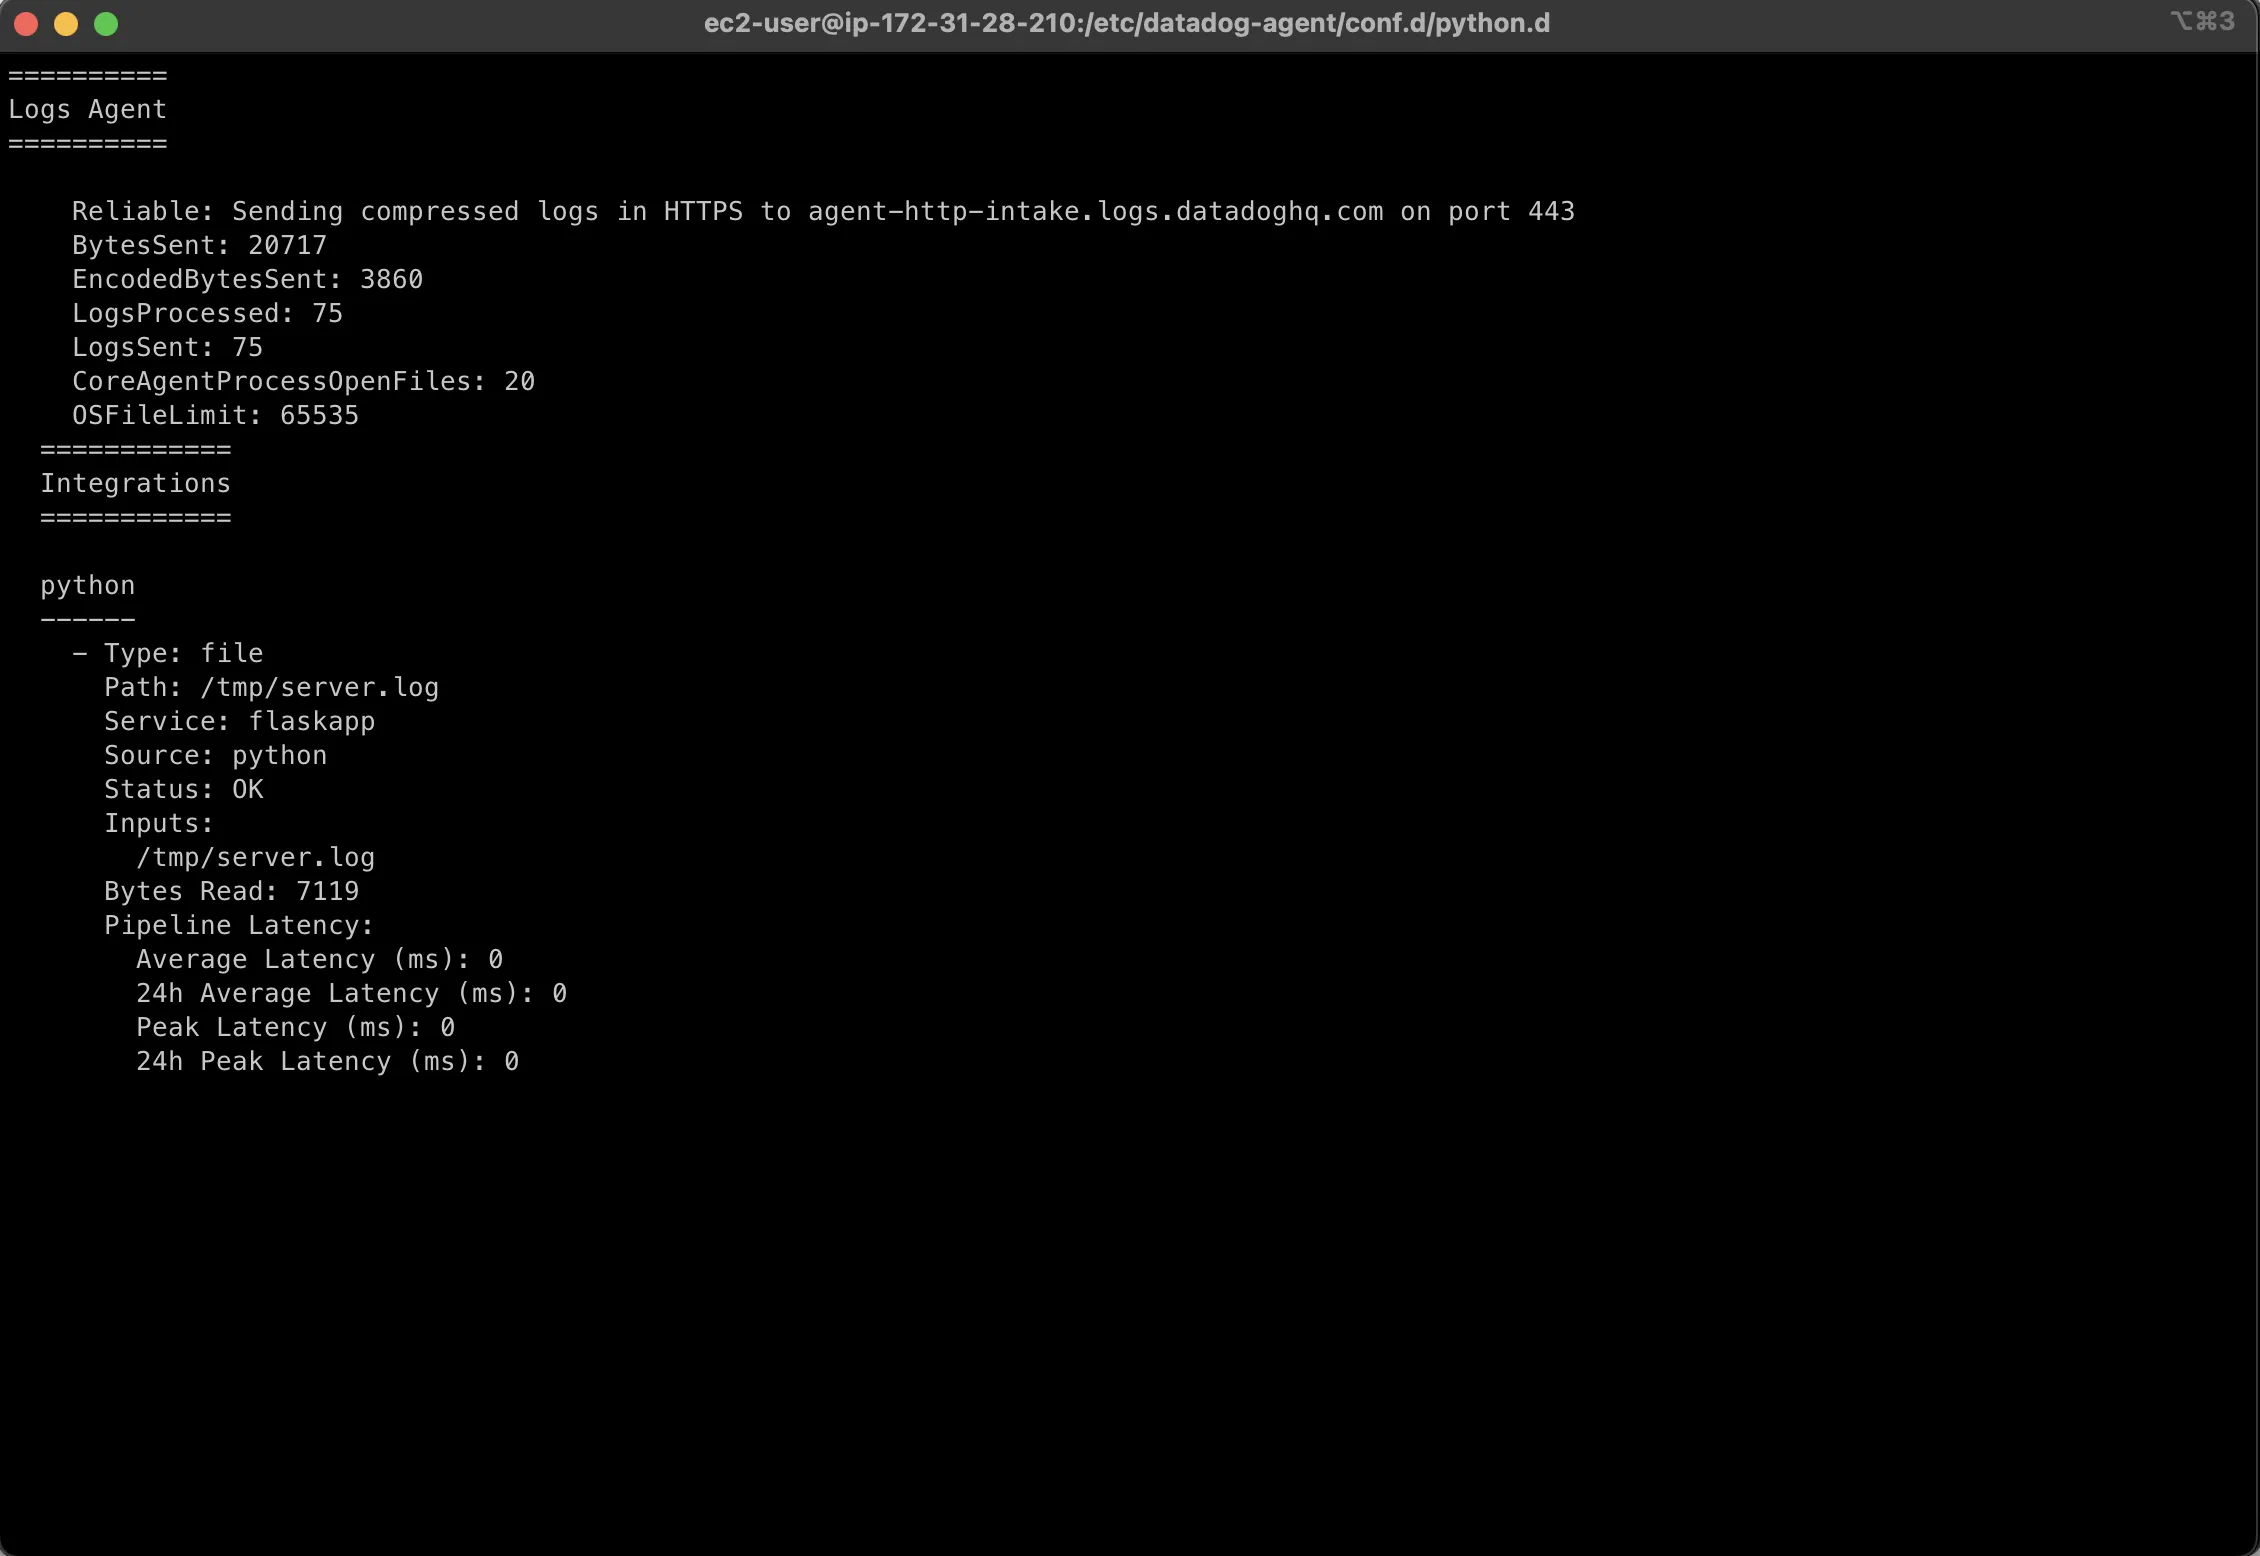
I restarted my application. Using the datadog-agent status command, I could see that the Logs Agent was active and that it was sending logs from the log file.
Dynatrace
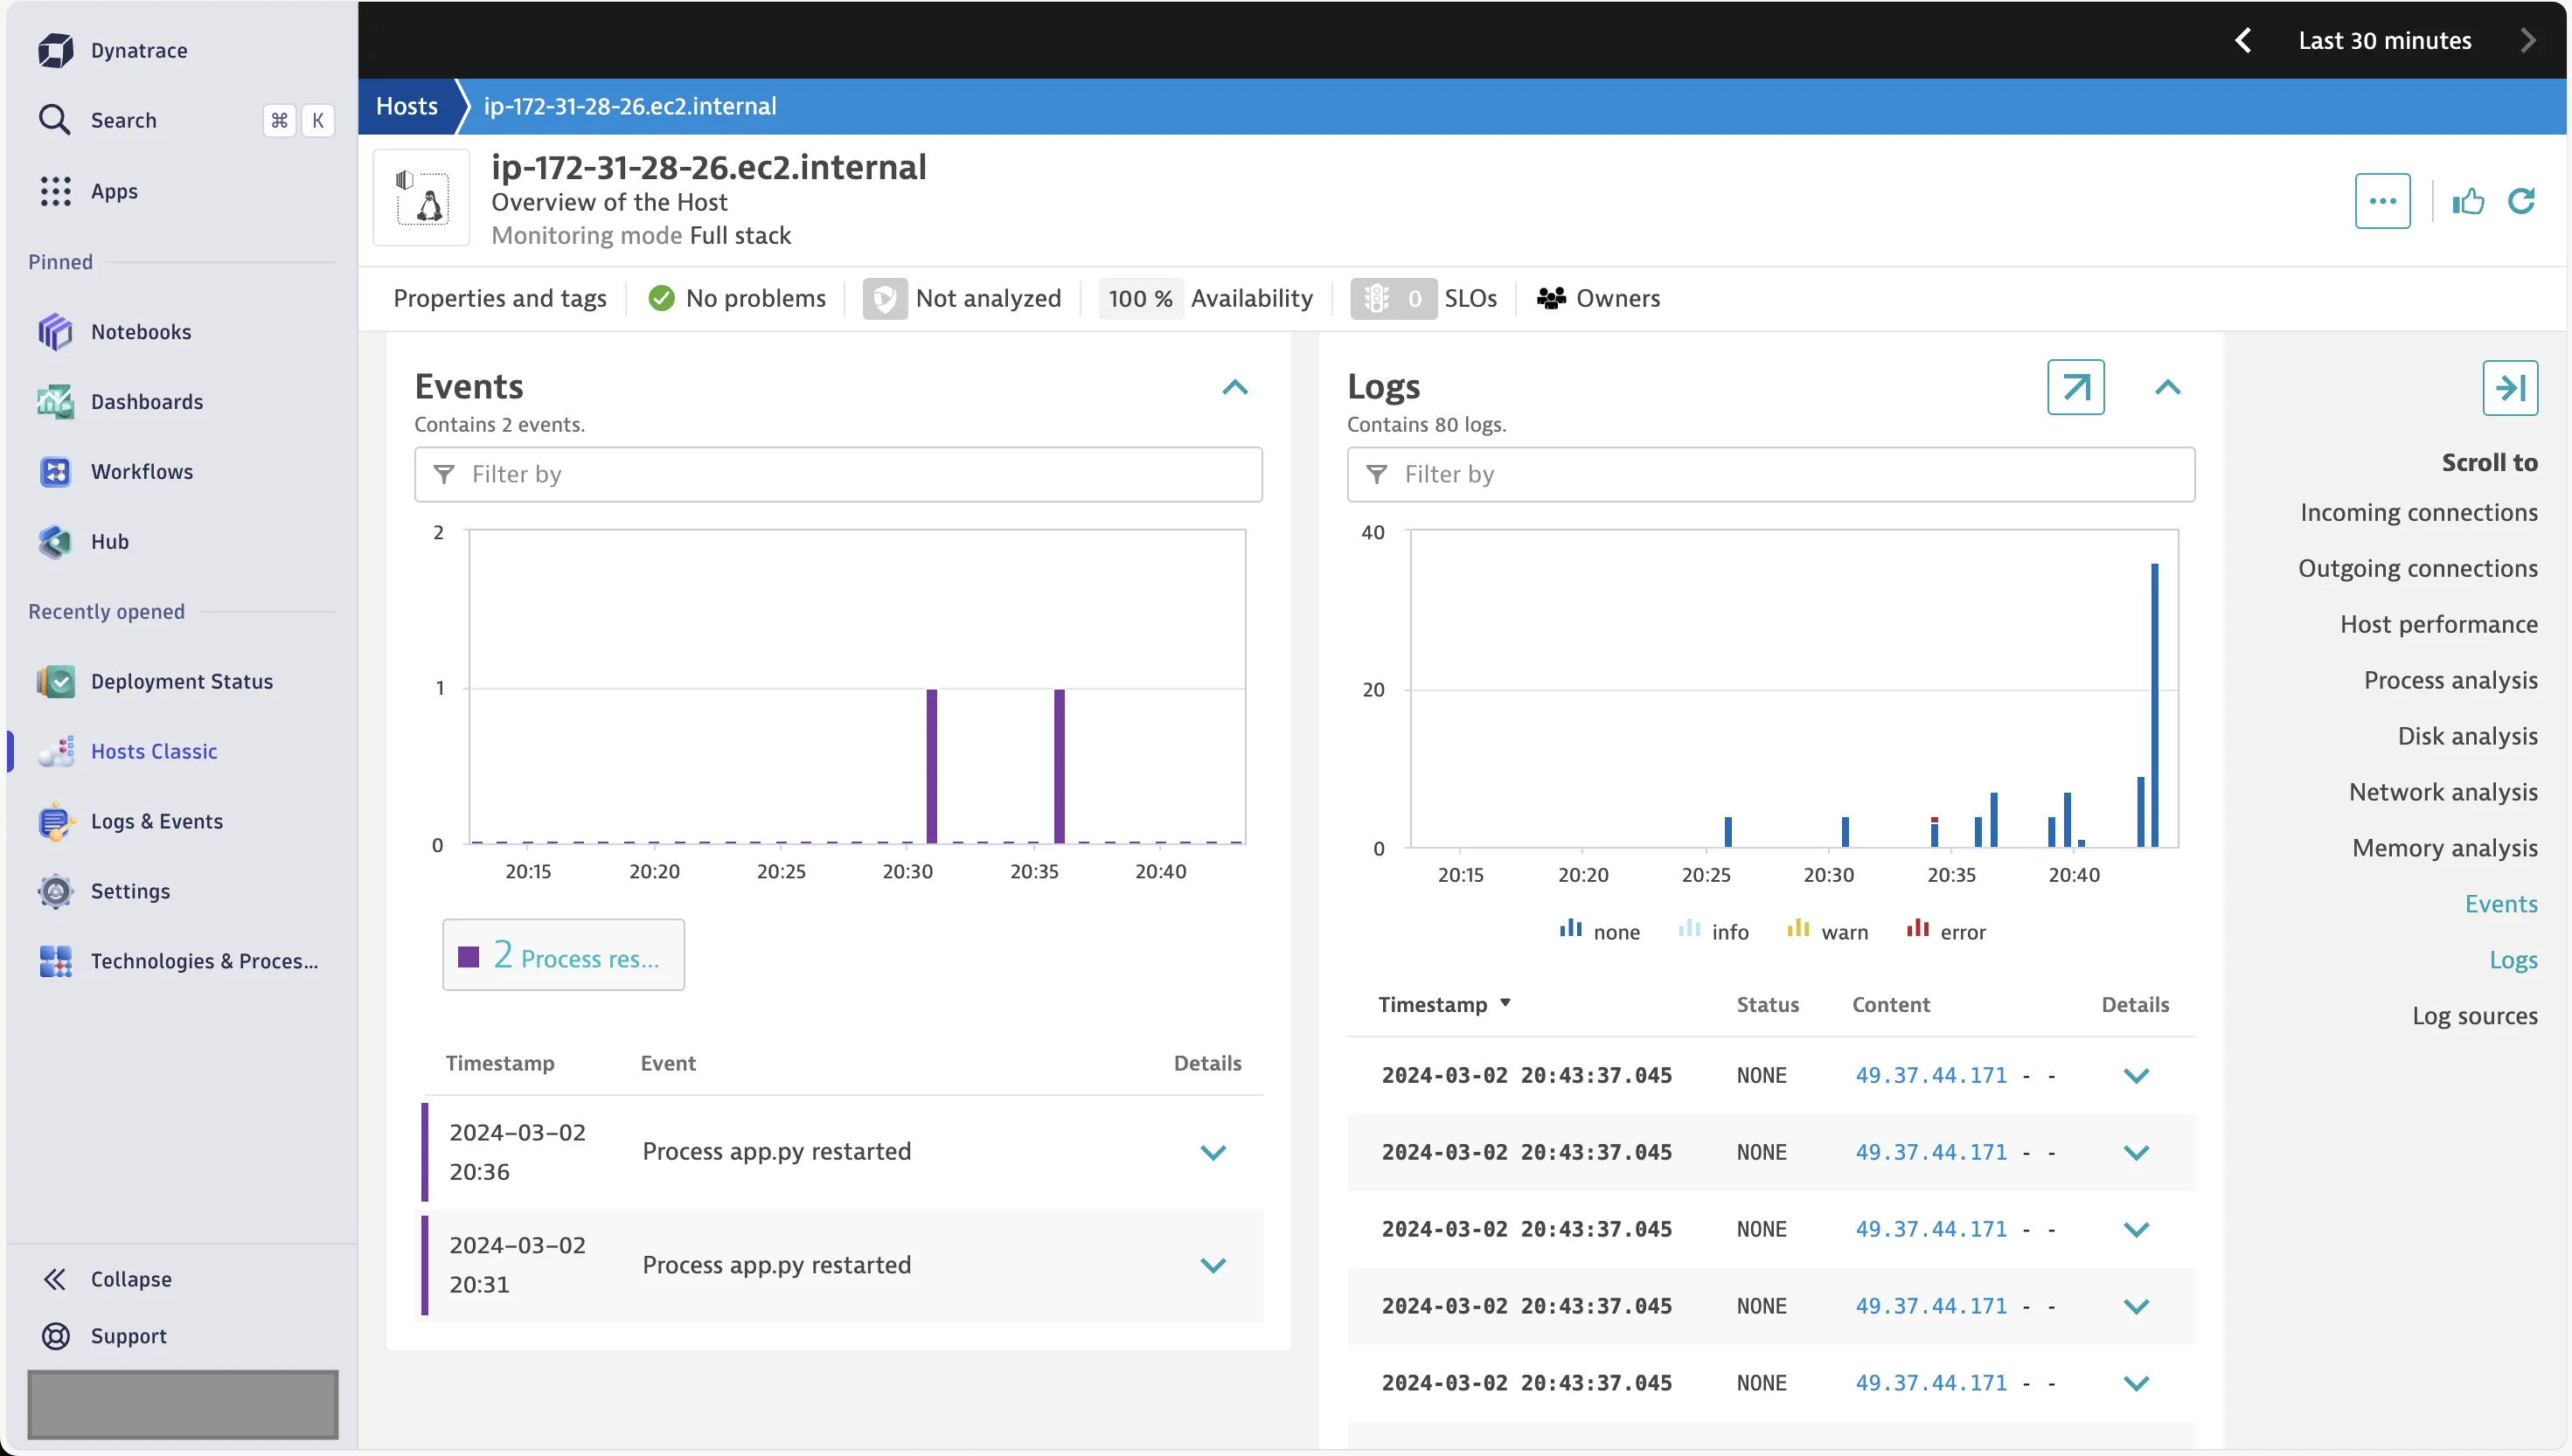
In contrast to Datadog, Dynatrace started capturing logs by default. In order to set the custom log file, I did not need to make any changes from the EC2 terminal. Rather, every configuration was driven from the Dynatrace UI.
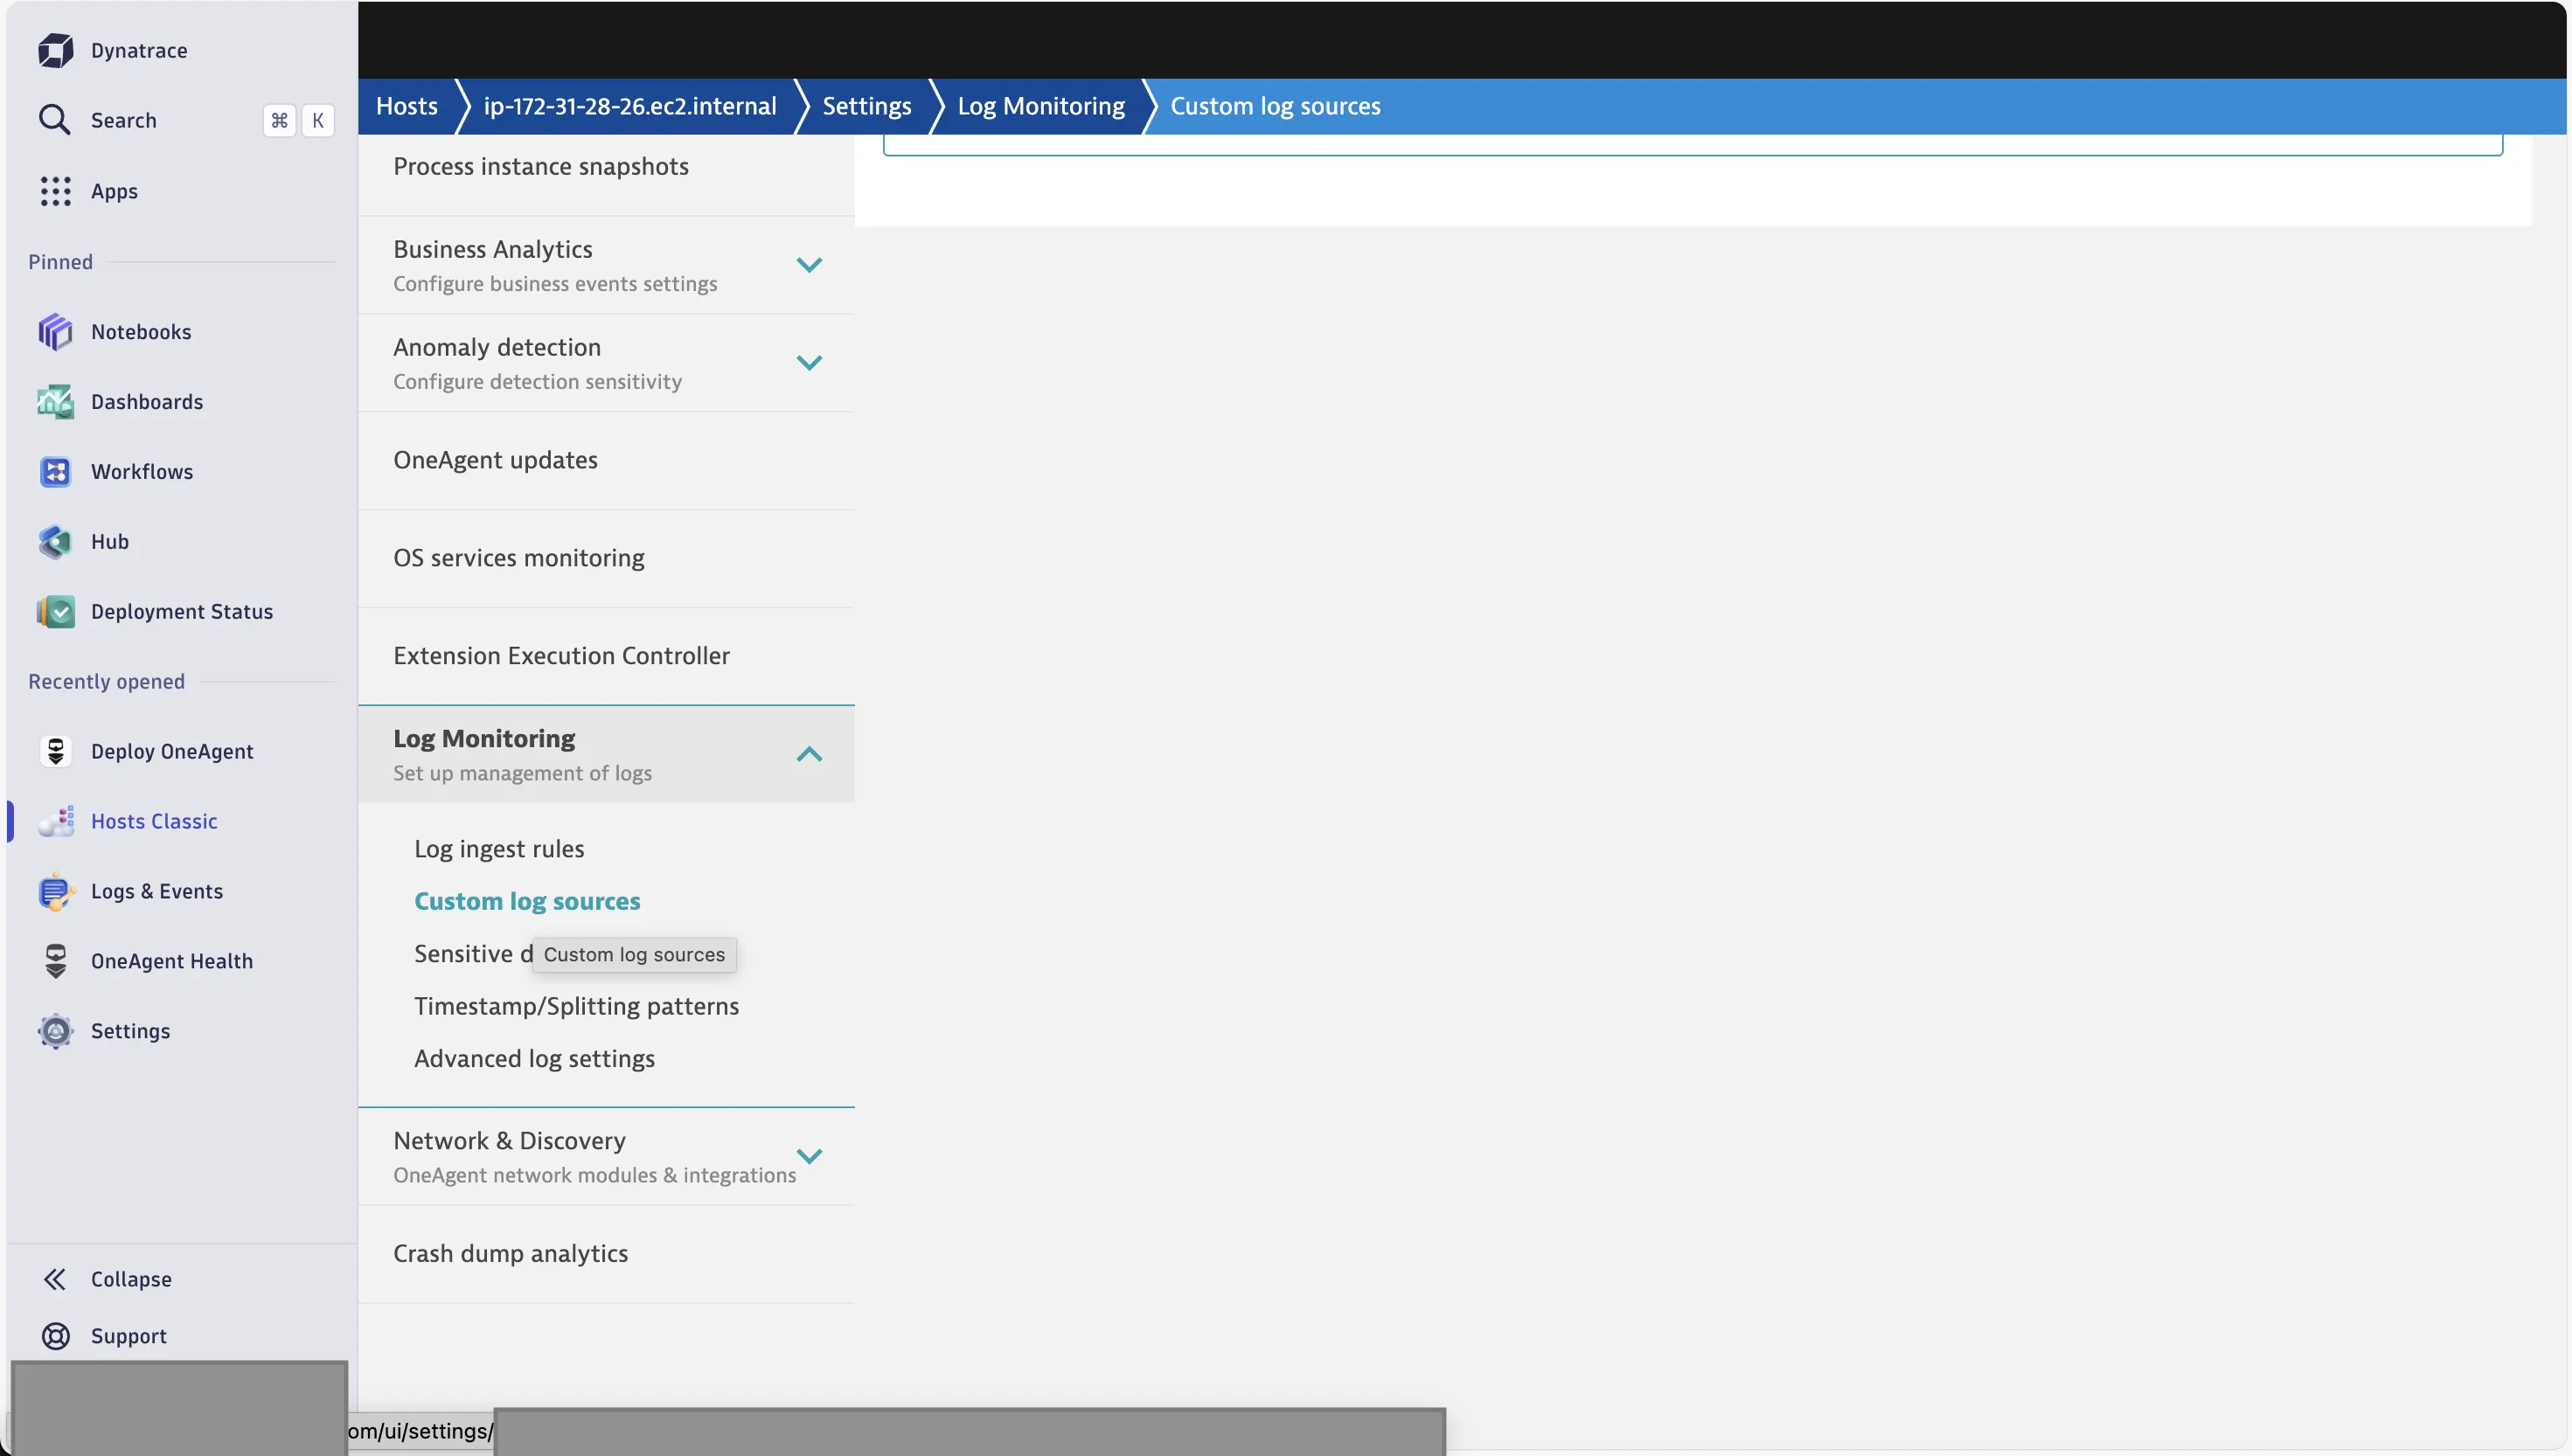
From the Hosts Classic page, I opened the Settings for my EC2 instance. Scrolling down, I found the Log Monitoring option, inside which was the option for custom log sources. Here, I just had to provide the full file path for my server.log file.
With this, I was able to see the application logs.
Pricing
Datadog
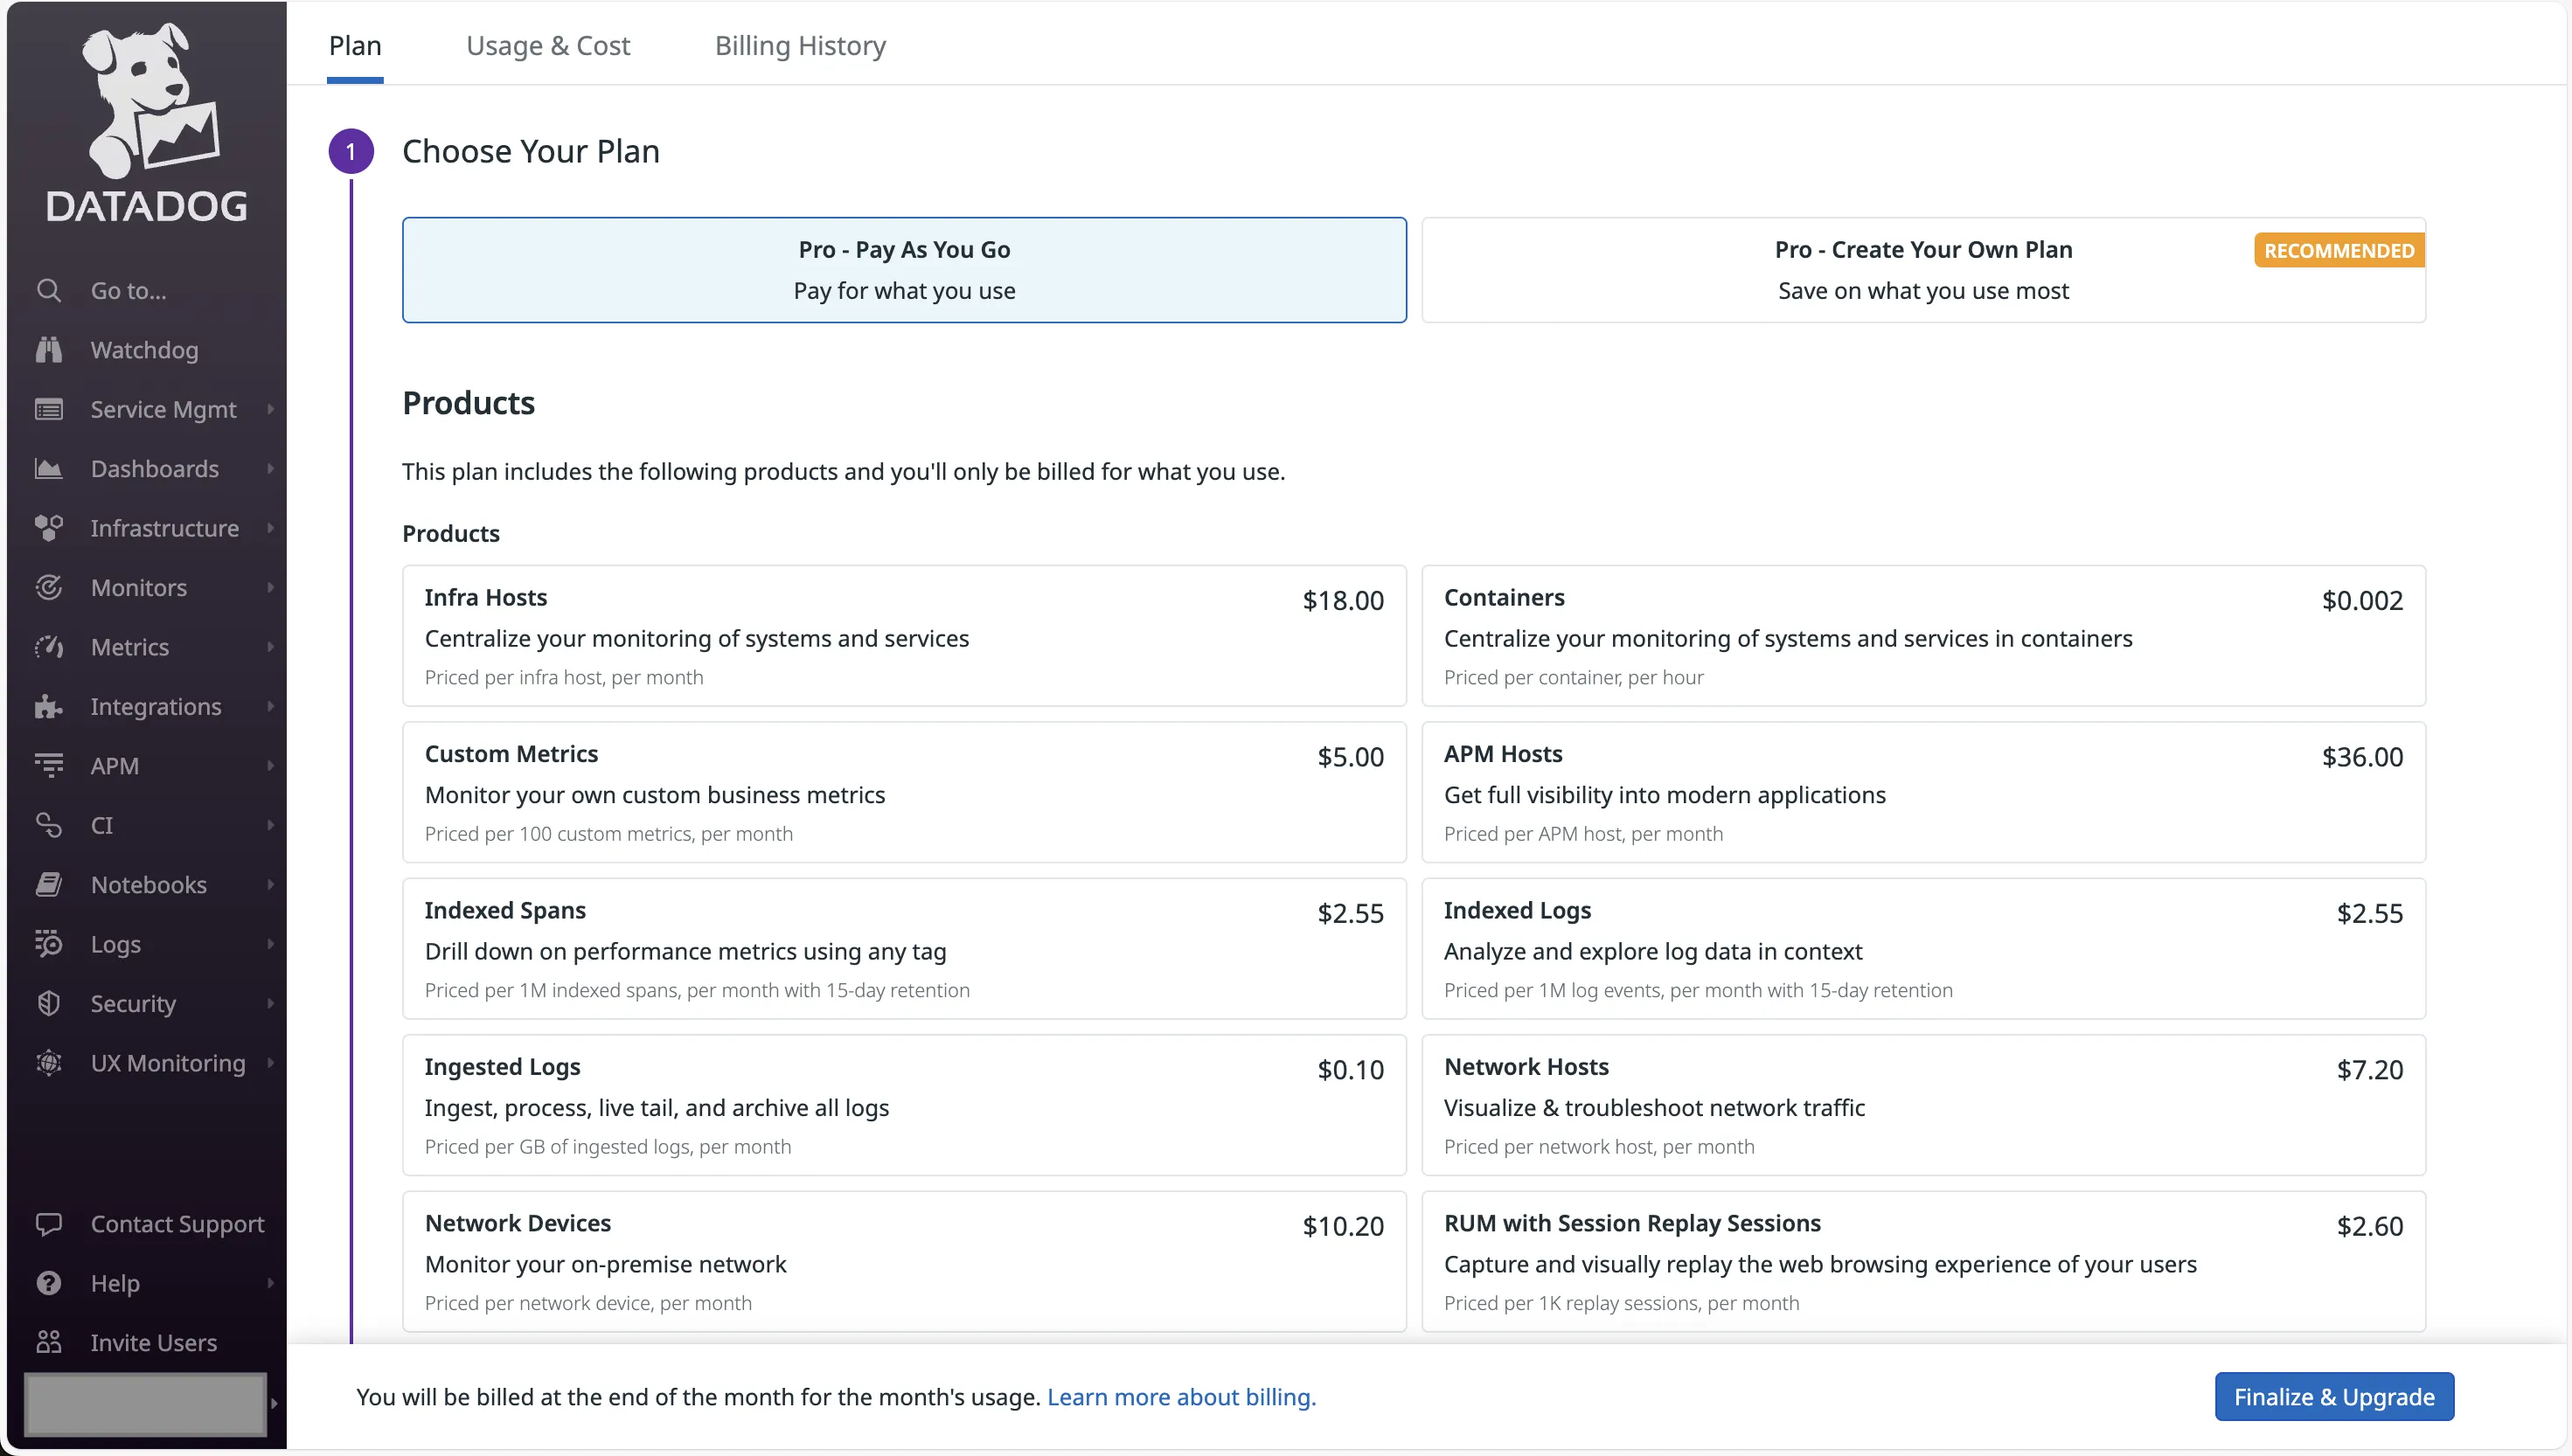
Datadog has two major pricing options:
- Pay As You Go
- Create Your Own Plan
You have to manually take into account the price of every single component that you will be monitoring. While it might be intuitive if you have a very limited set of applications, this becomes complicated once that number increases.
Dynatrace
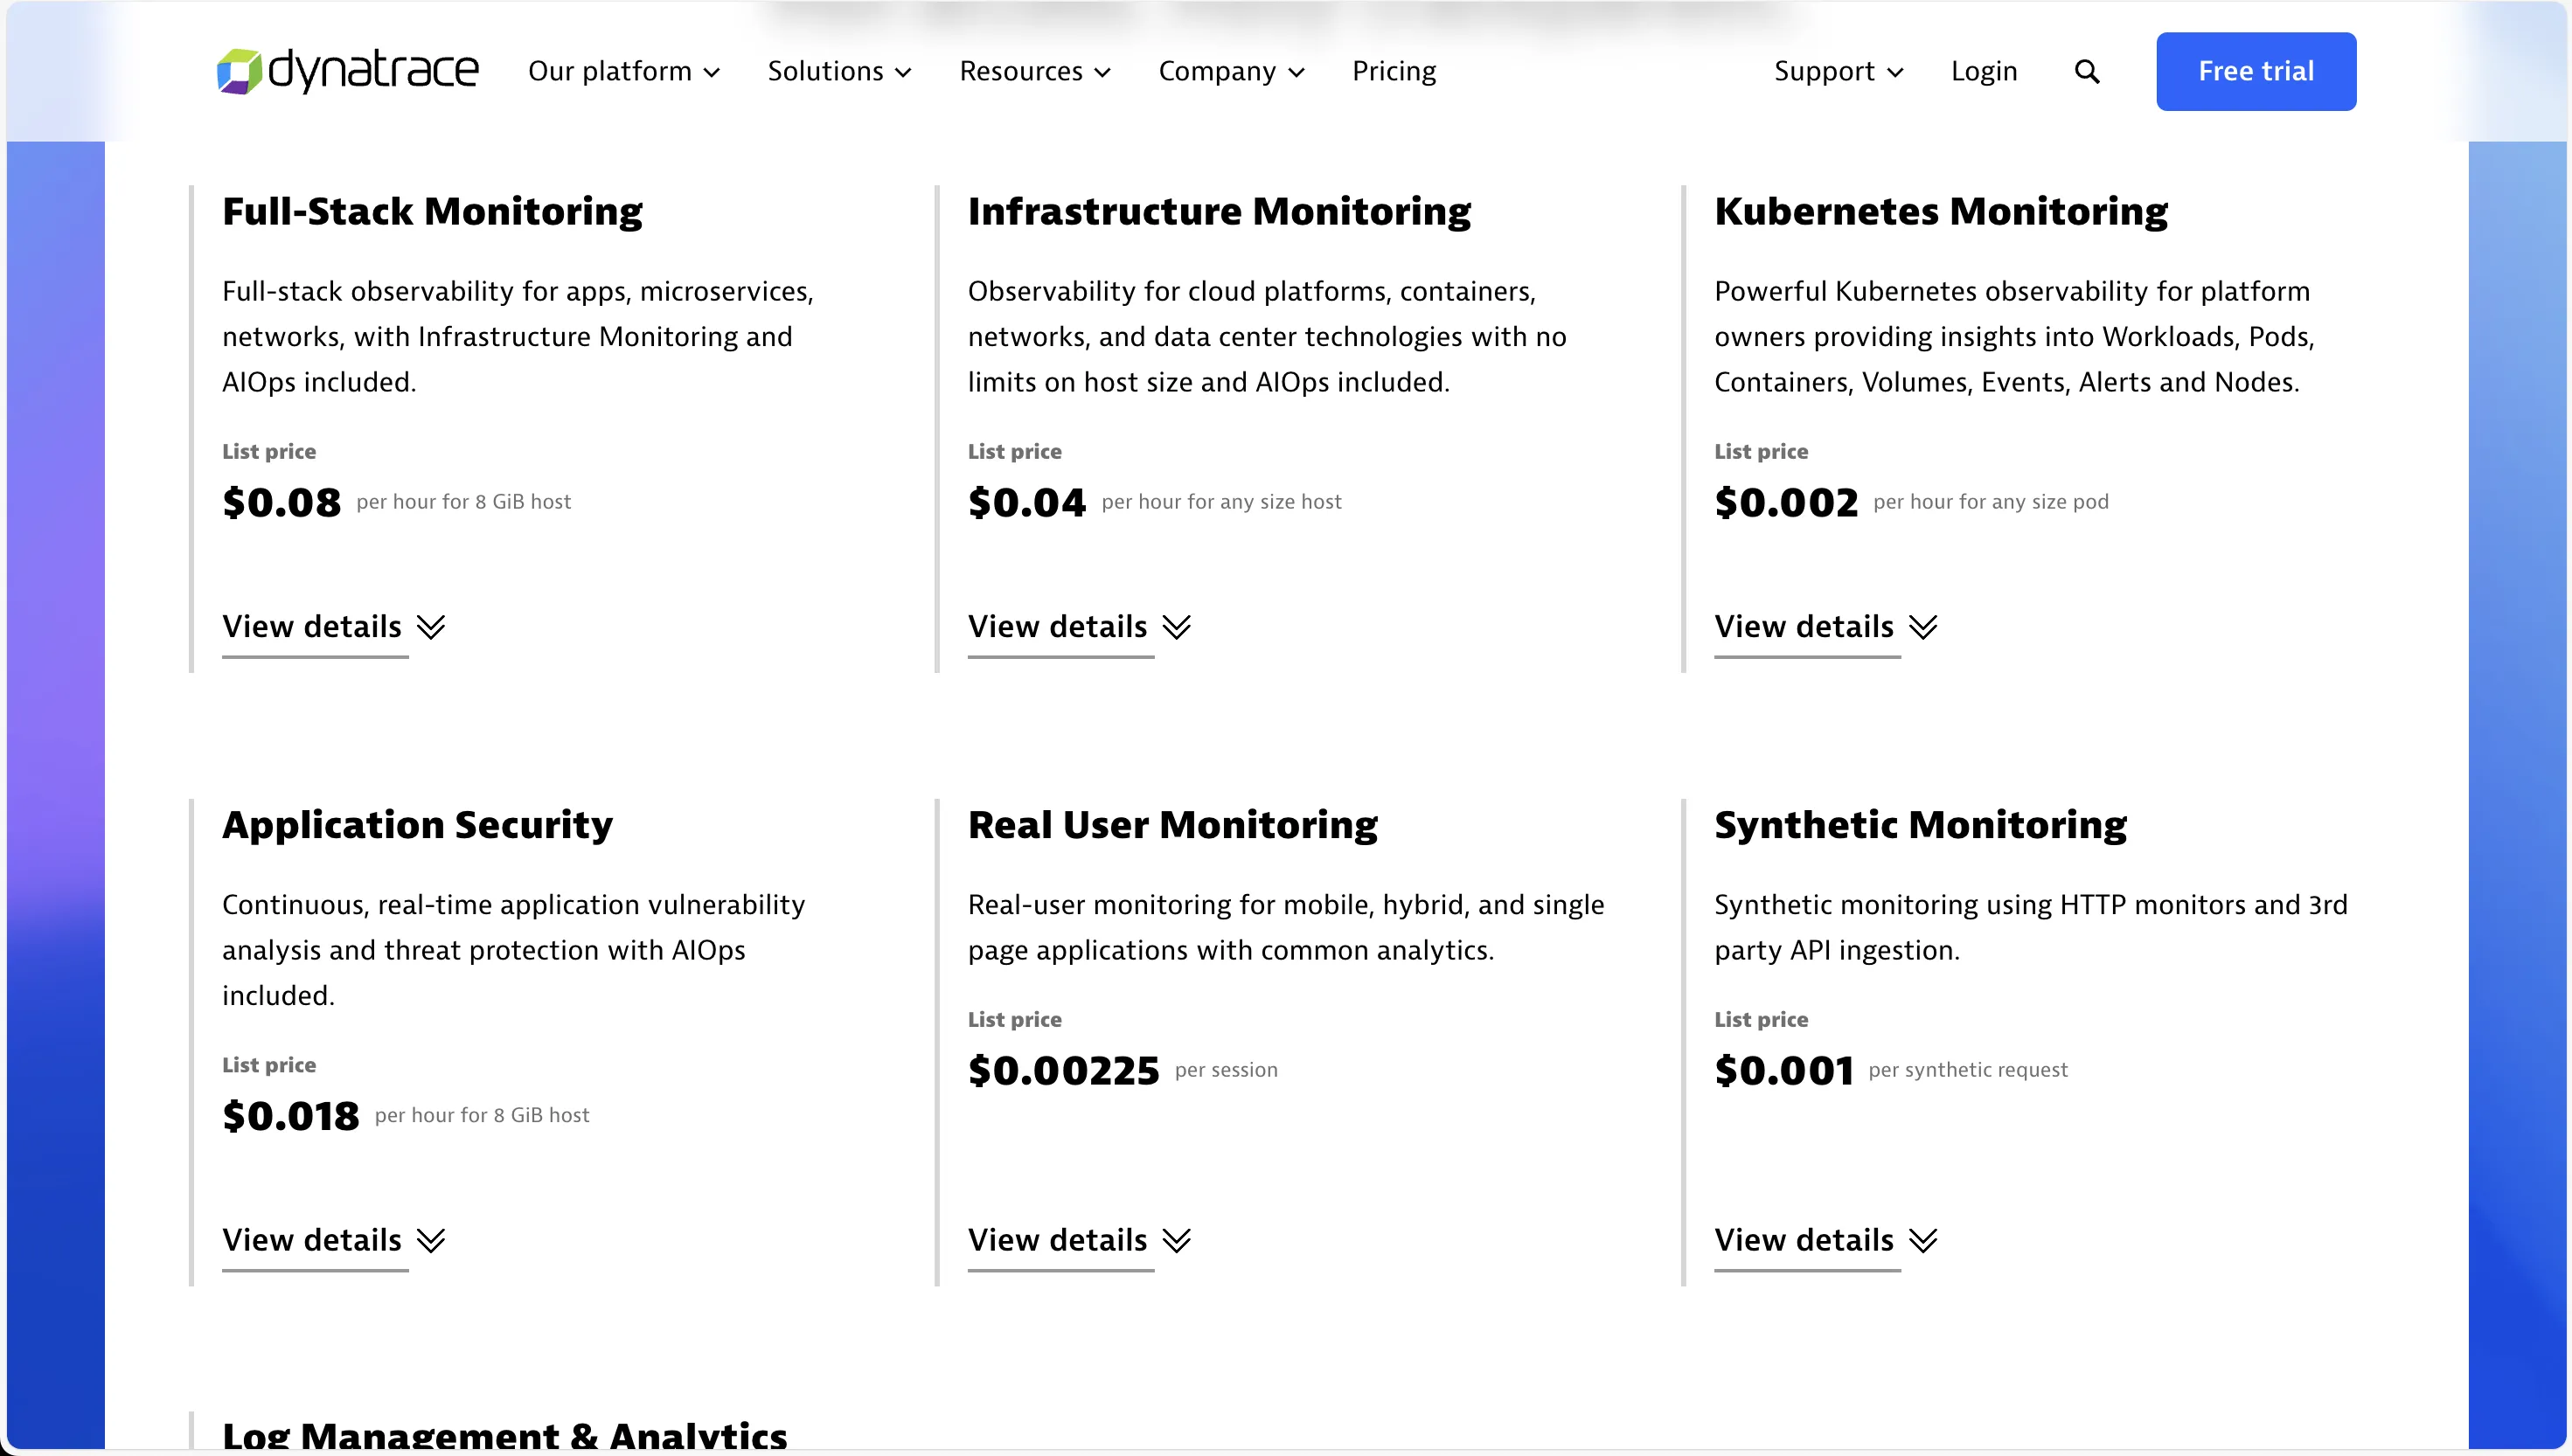
For Dynatrace, there is the option of opting for full-stack monitoring. But do note that not everything is covered under this, and you might need to opt additional things, or go for a custom plan by talking to the sales team.
Documentation: Datadog is better
Both Datadog and Dynatrace have a good amount of official documentation. Between the two, I personally found Datadog to be more straightforward. For Dynatrace, I had to open multiple documents and hop from one to the other to figure out how to do things.
Datadog also has a lot of explainer videos on YouTube that might help you set things up faster.
Datadog vs Dynatrace: Final Verdict
After using both tools, I could not come up with a clear winner. While Datadog was easier for me to integrate, Dynatrace provided more granular insights into my application.
Pricing aside, both Datadog and Dynatrace can be viable monitoring options. If you want simplicity, I’d say go for Datadog. On the other hand, if you want to control all aspects of your pipeline, Dynatrace is the answer.
Dynatrace has a steeper learning curve. The UI is also not that intuitive. You have to go through quite some documentation in order to figure out how to do simple things.
Having said that, Datadog isn’t perfect either. I was especially taken aback by the amount of additional manual setup I had to do in order to get the log ingestion to work. There also isn’t a single dashboard that gives me insights into both infra and application monitoring.
SigNoz: A Better Alternative
If you’re looking for an easy-to-use solution that covers all your monitoring needs, then look no further than SigNoz. SigNoz covers it all - Metrics, Logs, and Traces.
Here are the notable features:
- It’s open-source
- It’s OpenTelemetry-native
- No hidden pricing or special pricing for custom metrics
- No user-based or host-based pricing
Being a full-stack APM and observability tool, SigNoz offers everything that you might need in order to gain insight into your entire tech stack. Powered by Clickhouse as the underlying database, SigNoz offers blazing fast ingestion and data aggregation.
You get the crucial metrics like latency, error rates, and external calls right from the get-go. Creating custom dashboards are also a breeze.
Getting Started with SigNoz
SigNoz cloud is the easiest way to run SigNoz. Sign up for a free account and get 30 days of unlimited access to all features.
You can also install and self-host SigNoz yourself since it is open-source. With 16,000+ GitHub stars, open-source SigNoz is loved by developers. Find the instructions to self-host SigNoz.
Further Reading:


