Open Source Single Pane of Glass Monitoring | SigNoz
Single pane of glass monitoring is a term used to denote monitoring applications with a single tool that provides a comprehensive set of dashboards for the entire software system of an organization. Managing multiple monitoring tools for different aspects of the IT system becomes too cumbersome. And that’s how the concept of a single pane of glass monitoring evolved.
Most modern applications are now built using distributed software systems. Applications use distributed application architectures like microservices and serverless to serve user demands at a global scale. It gets deployed using container orchestration tools like Kubernetes on distributed infrastructure that might be using a hybrid cloud environment.
Cloud computing and containerization have brought many benefits like speed to market and on-demand scaling. But it has also increased operational complexity. Moreover, users expect digital applications to meet their needs in seconds. Any latency is missed business opportunity.
To address these issues, engineering teams use monitoring tools to keep a tab on the performance of their software systems. For each component of a software system, there can be a standalone monitoring tool. But it is often challenging for SREs or DevOps engineers to shift between different tools while debugging an issue that needs to be critically solved.
In this article, we will introduce an open source APM tool - SigNoz, that can be used as a single pane of glass monitoring for your application. But first, let’s learn a bit more about single pane of glass monitoring.
What is Single Pane of Glass Monitoring?
Monitoring tools are not of much help in silos for modern distributed software systems. You can have application logs and metrics from a single host, but the issue can be from a downstream service. Correlating events is key to debugging issues quickly.
Having different tools for different monitoring signals like logs, metrics, and traces is also challenging. You can have one solution for log management and another one for metrics monitoring. But if you’re experiencing a metrics spike at a certain timestamp, you will have to jump between different tools for investigating the event with logs.
Moreover, having multiple monitoring tools slows down engineering teams. It is difficult to onboard newer members, and often there is a dependency on a few members of the team. A tool that provides a single pane of glass to cover all aspects of software systems monitoring is more efficient for debugging applications.
For cloud-native applications, a single pane of glass monitoring can enable engineering teams to act fast while serving as a knowledge base for new team members. One concern that organizations have while selecting a single monitoring tool is that of creating vendor lock-in.
Open source tools provide a way out. In fact, OpenTelemetry, an open source project that aims to standardize the way telemetry data is generated, is solving this particular problem.
Challenges with Open Source Monitoring Tools
There are popular open source monitoring tools out there. For example, we have:
- Prometheus for metrics monitoring
- Jaeger for distributed tracing
While these tools are great at their specific use cases, they do not provide a single pane of glass monitoring experience. Moreover, the user experience of most open source tools does not match up to their SaaS counterparts. As monitoring is a critical part of the DevOps culture, organizations need tools that work out of the box. And that’s why we built SigNoz - an open source APM built on OpenTelemetry to provide a single pane of glass monitoring experience.
An open source APM for Single Pane of Glass Monitoring
SigNoz is a full-stack open source APM. Using SigNoz, you can set up a single pane of glass monitoring. SigNoz is built to support OpenTelemetry natively.
OpenTelemetry is an open source project under Cloud Native Computing Foundation that is very suited to instrument cloud-native applications for telemetry data. OpenTelemetry provides freedom to choose any backend analysis tool freeing you from any vendor lock-in.
SigNoz provides logs, metrics, and traces under a single pane of glass. You can also correlate metrics and traces easily with a single click. You can also create custom dashboards for monitoring your infrastructure. Let’s see how SigNoz fits the case for a single pane of glass monitoring with its features.
Metrics Monitoring
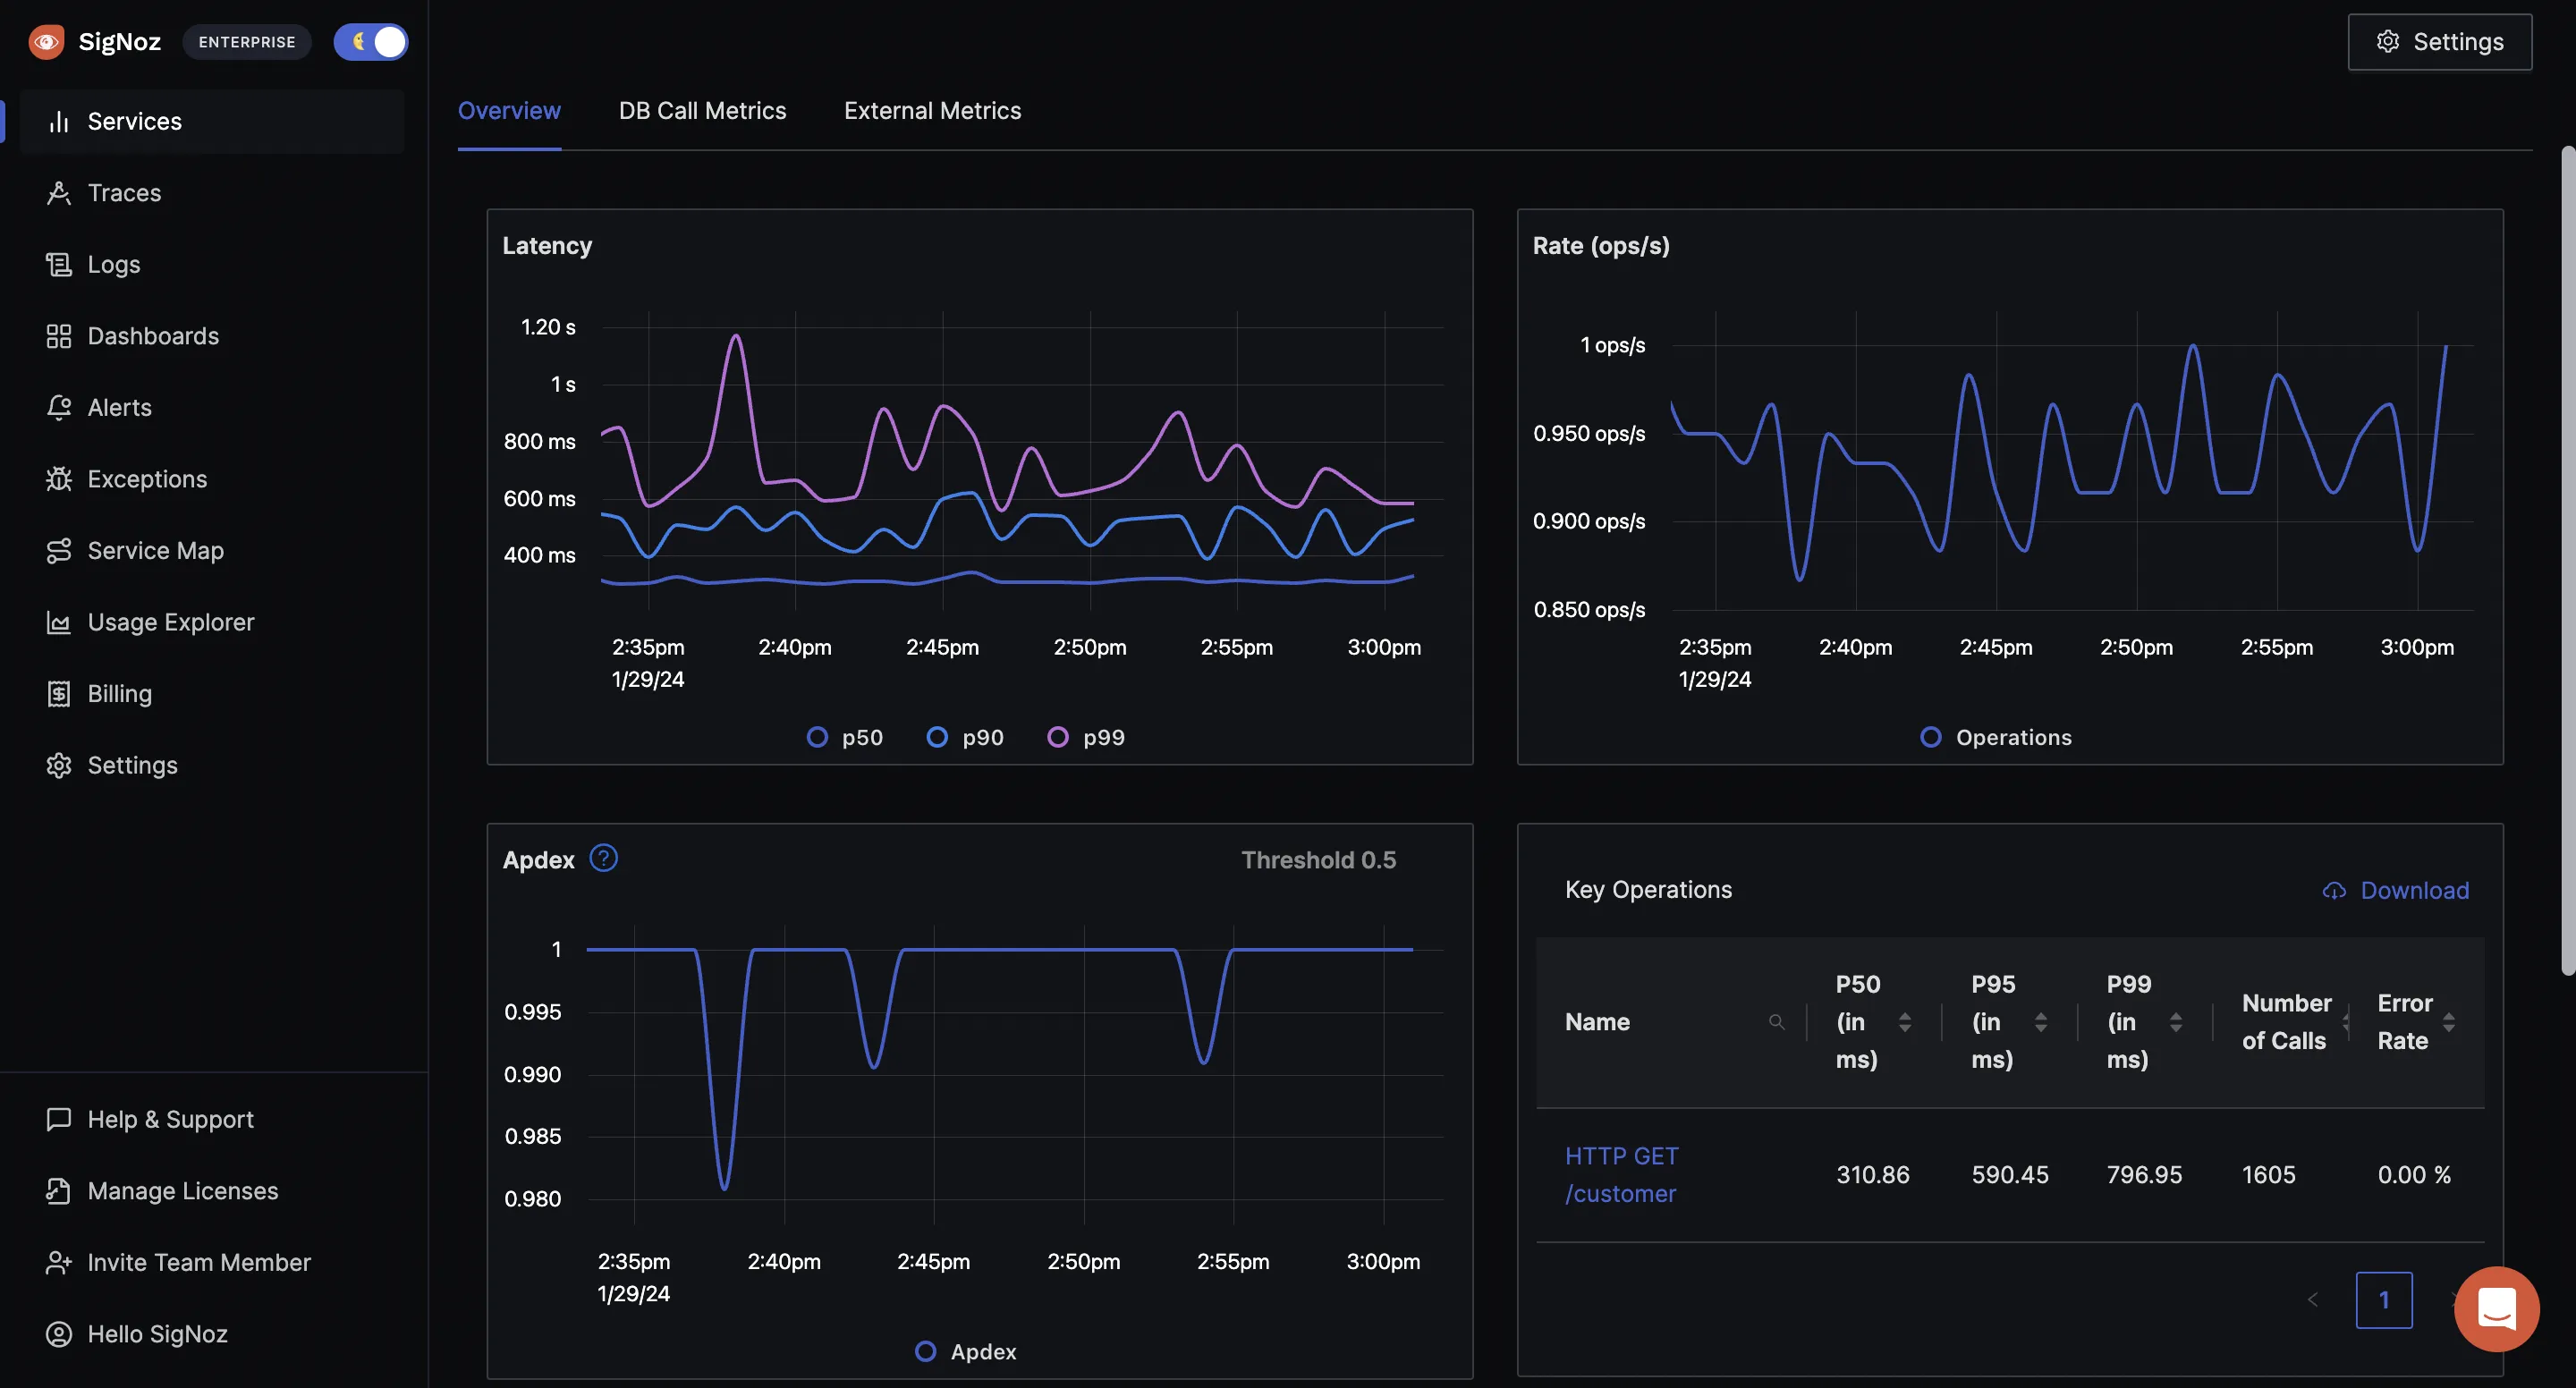
SigNoz provides out-of-box charts and visualization for popular RED(requests, errors, and duration) metrics. You can also track the top endpoints of your services under a single view.
Distributed Tracing
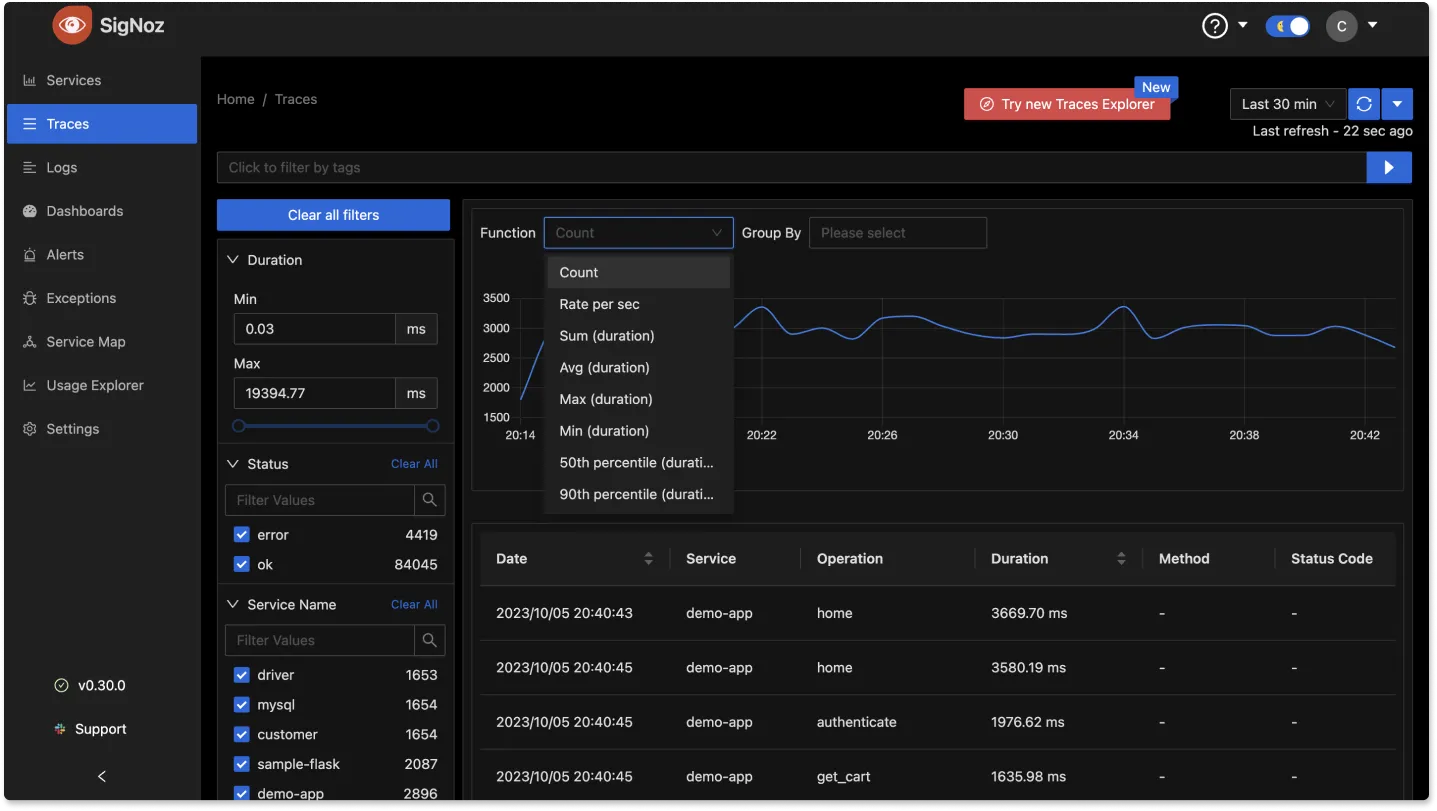
Distributed tracing is an important technology aimed at solving performance issues in distributed systems like applications based on microservices architecture. SigNoz provides the popular Flamegraph and Gantt chart view that breaks down a user request into all its components as it travels across services and protocols.

SigNoz also lets you run aggregates on trace data. Running aggregates on tracing data enables you to create service-centric views, providing insights to debug applications at the service level. It also makes sense for engineering teams as they own specific microservices.
Log Management
Logs are part of every developer's workflow, and gives the most granular information to debug applications quickly. Logs, metrics, and traces are often touted as three pillars of observability. But at its core, observability is about solving application issues fast. And rather than three pillars, logs, metrics, and traces can act as a single mesh that when correlated intelligently can help developers solve application issues quickly.
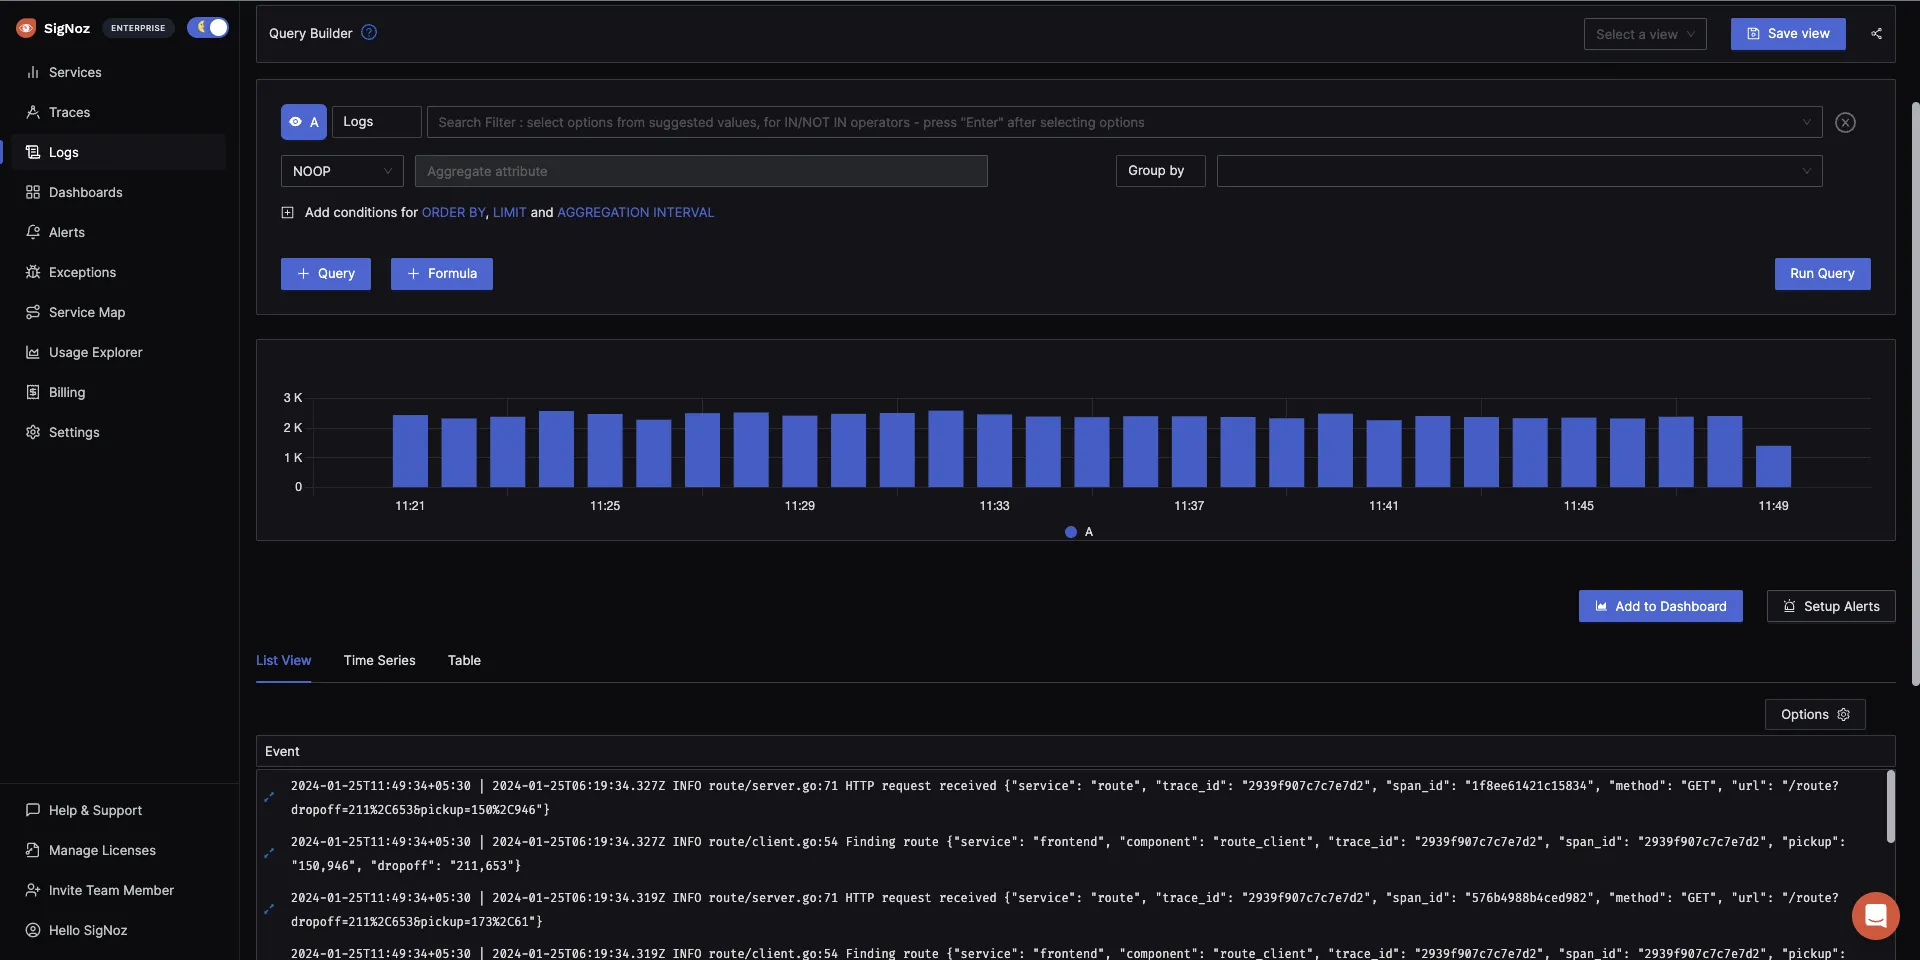
SigNoz also provides log management with advanced features like log query builder, search across multiple fields, structured table view, JSON view, etc.
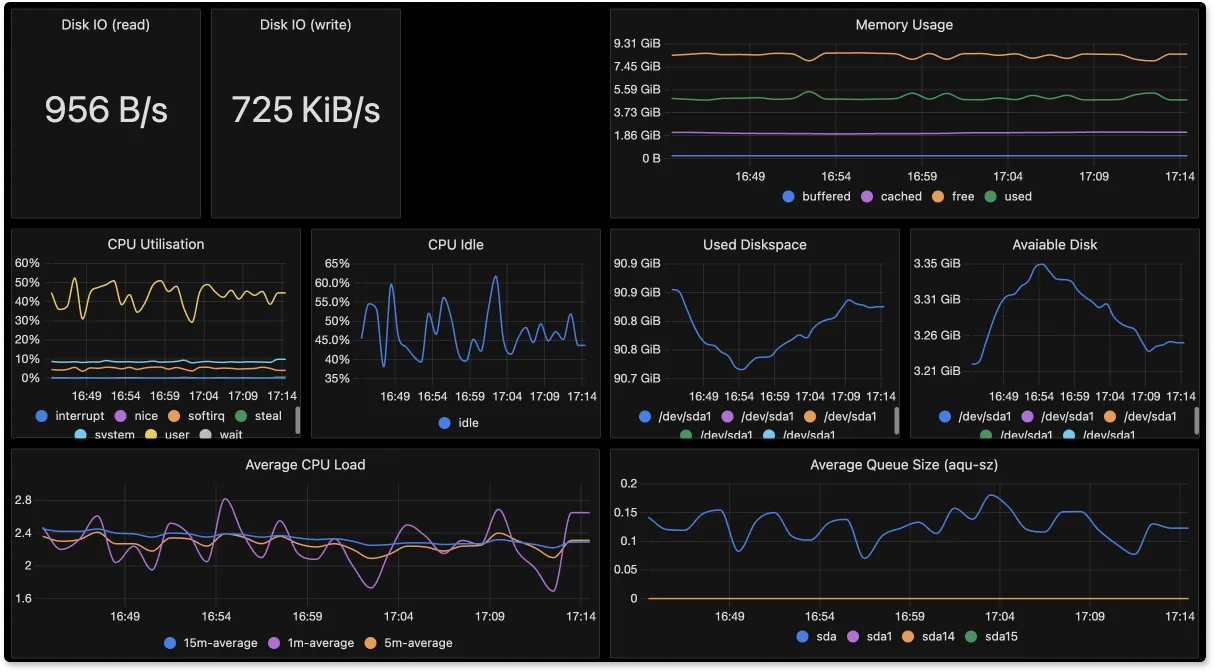
Infrastructure Monitoring
OpenTelemetry provides receivers for receiving metrics from metrics exporters of a lot of common technologies. Using these receivers, you can build custom dashboards for your infrastructure with SigNoz.
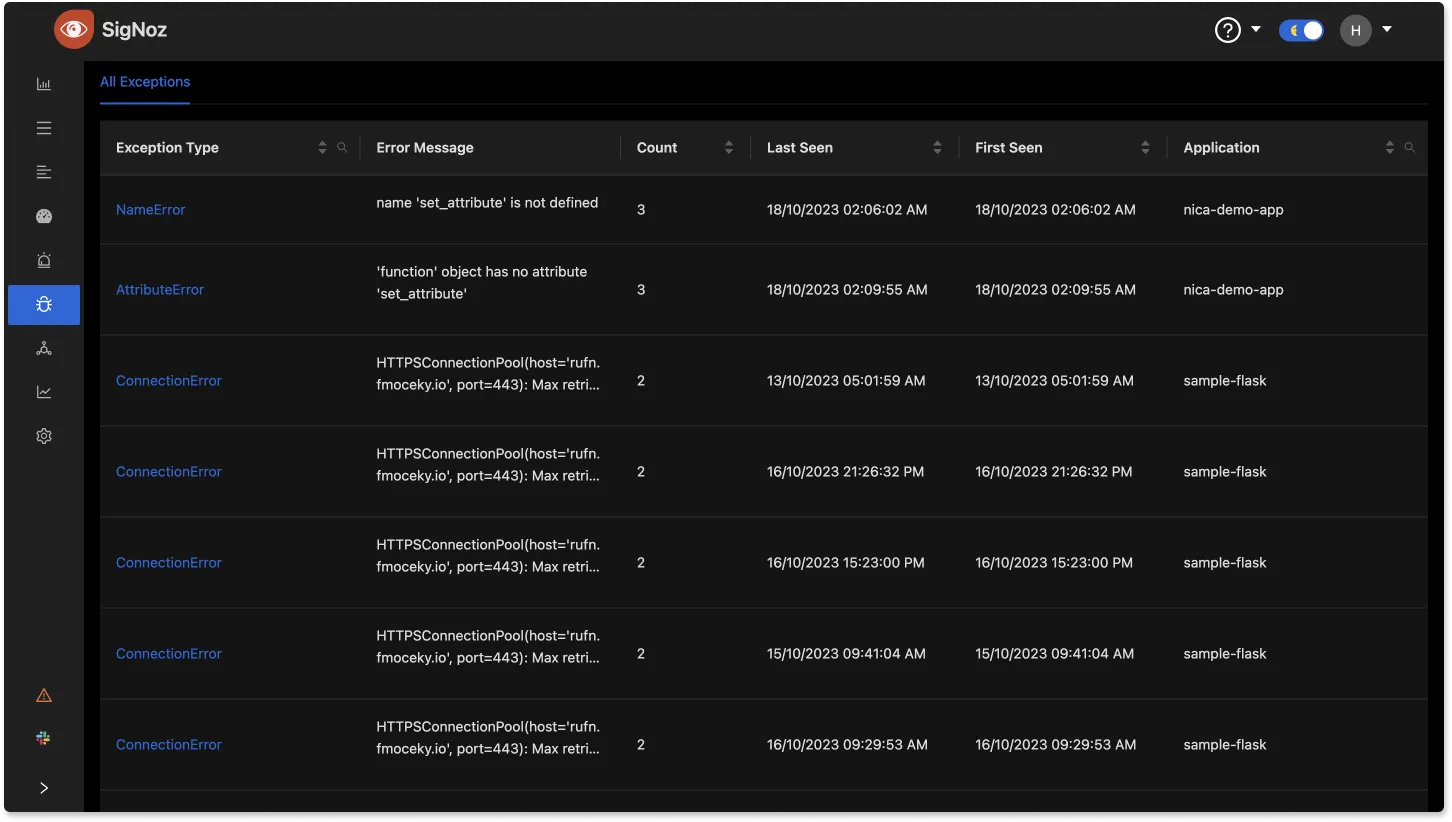
Exceptions & Errors
SigNoz can also help you monitor exceptions in your application code. You can monitor popular exceptions like SSLError, ZeroDivisionError, MaxRetryError, etc., occurring in your application code in one place.
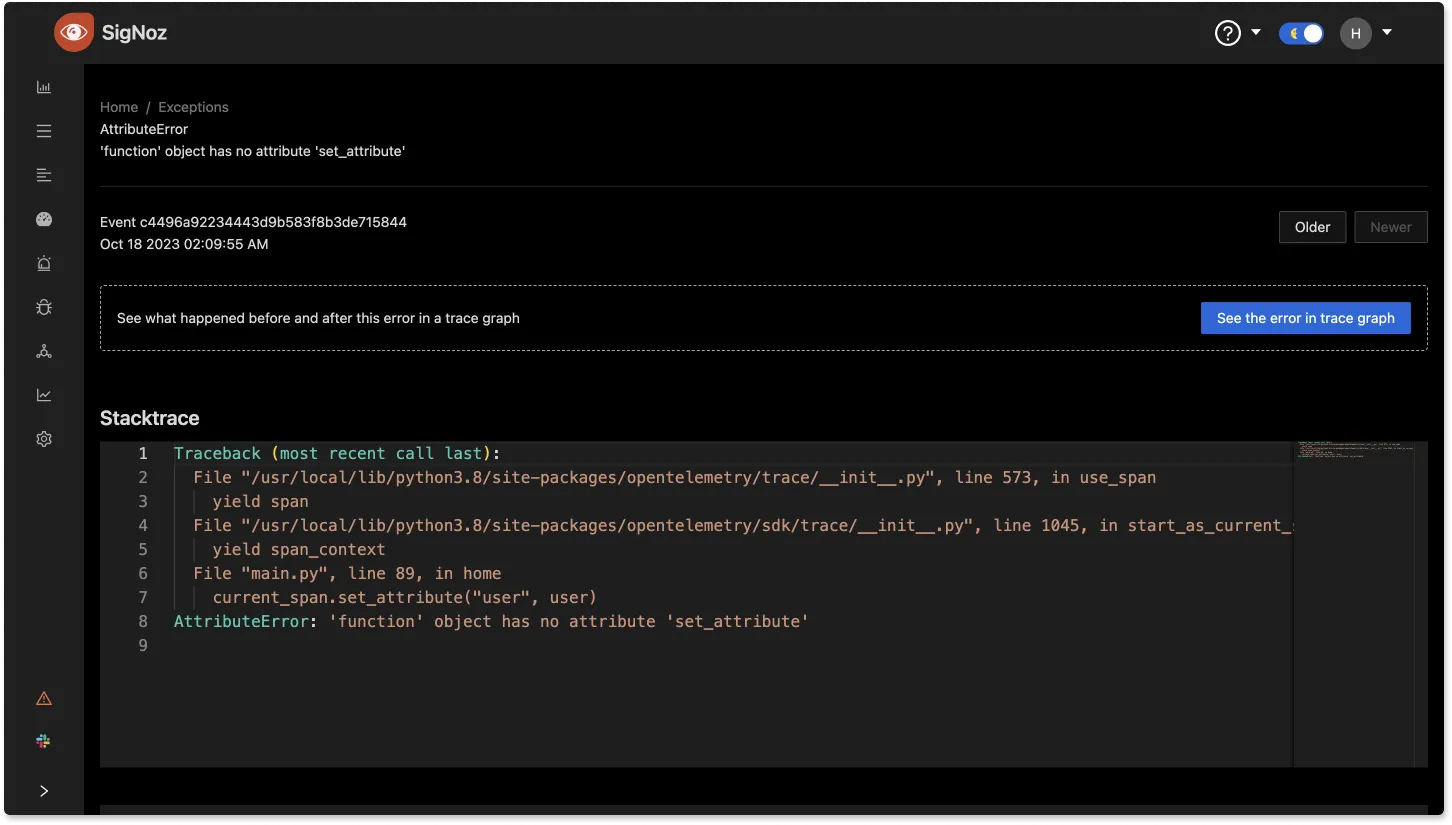
You can also dig deeper into the exceptions with its stacktrace.
Alerts
You can also set alerts on critical metrics to stay on top of your performance issues.

Getting started with Single Pane of Glass Monitoring
Getting started with SigNoz is easy. It is easy to get started with SigNoz. It can be installed on macOS or Linux computers in just three steps by using a simple installation script.
The install script automatically installs Docker Engine on Linux. However, you must manually install Docker Engine on macOS before running the install script.
git clone -b main https://github.com/SigNoz/signoz.git
cd signoz/deploy/
./install.sh
When you are done installing SigNoz, you can access the UI at http://localhost:3301
You can visit our documentation for instructions on how to install SigNoz using Docker Swarm and Helm Charts.
You can check out the SigNoz GitHub repo here:


