Quantile Aggregation for statsd-exporter in Prometheus
In this blog, we shall send observation frequencies in the bucket intervals chosen and aggregate those at the Prometheus back-end.

In our last blog post (Monitoring OpenMetrics for Gunicorn and Django application in Prometheus) we had 0.5, 0.9 and 0.99 quantiles from statsd-exporter for individual instances of statsd-exporter. In that blog, quantile was calculated at the client and the quantiles are exposed to prometheus as metrics. In this blog, we shall send observation frequencies in the bucket intervals chosen and shall aggregate those at the backend (prometheus).
Aggregation of quantiles using average does not make sense of the data.
Example:
data1 -> 100, 110, 110, 120, 125, 130, 105, 115, 130, 250, 145 -> median is 117.5
import numpy as np

arr = [100, 110, 110, 120, 125, 130, 105, 115, 130, 250, 145, 115]
print (np.median(arr))
Output: 117.5
data2 -> [405, 115, 390, 550, 250, 330, 440, 180, 525] -> median is 390
arr2 = [405, 115, 390, 550, 250, 330, 440, 180, 525]
print (np.median(arr2))
Output: 390
Actual Median of combined datasets is:
arr.extend(arr2)
print (np.median(arr))
Output: 130.0
Now how to aggregate medians of data1 and data2?
Average gives (117.5 + 390)/2 = 253.75 while the actual median of the combined data set is 130.0
If the above were response time of an application from 2 different nodes, the aggregation would give a misleading insight
Comes into picture Histogram metric type in prometheus. The idea is to send histogram of observations falling in bucketed time intervals like:
print (np.histogram(arr))
Output: (array([11, 2, 0, 2, 0, 1, 2, 1, 0, 2]), array([100., 145., 190., 235., 280., 325., 370., 415., 460., 505., 550.]))
A linear interpolation will give you 145 as the approximated median from histogram which is very close to the real median which is 130
To read more about quantile aggregation using summary and histogram in prometheus, go through the below link. It also explains the problems in linear interpolation and that one should have an idea about your buckets for better results.
We shall apply the histogram approach to aggregate quantile on prometheus. For that we will have to enable statsd-exporter to send metrics in buckets (number of observations falling in each bucket).
Let's try to implement this into our existing project. Checkout branch quantile_aggregation from our github repo. This contains config/statsd-mapping.conf file which includes:
defaults:
  timer_type: histogram
  buckets: [ 0.5, 0.7, 0.9, 1.1, 1.3, 1.5, 2.0 ]
  match_type: glob
  glob_disable_ordering: false
  ttl: 0 # metrics do not expire
mappings:
  - match: "gunicorn.request.status.*"
    #match_type: regex
    help: "gunicorn http response code"
    name: "gunicorn_http_response_code"
    labels:
      status: "$1"
We have a defaults section where we defined the timer_type as histogram and also defined the bucket ranges to collect observations.
The mappings section re-formats our statsd metrics to prometheus labels. This shall convert metrics like gunicorn.request.status.200 to gunicorn_http_response_code{status="200"} and similarly for others. This will help in filtering gunicorn_http_response_code based on status codes.
Now, we need to apply this configuration file to statsd-exporter using the argument --statsd.mapping= as shown in the code snippet below.
      containers:
      - name: statsd-exporter
        image: prom/statsd-exporter:latest
        args:
        - '--log.level=info'
        - '--statsd.mapping-config=/etc/config/statsd-mapping.conf'
To get this done, we need to place our local configuration file in the pod at the path specified in the above args, i.e, /etc/config/statsd-mapping.conf. This is achieved by creating a ConfigMap kubernetes resource and mount that config to volume.
We can create the ConfigMap by running below command from project root directory:
kubectl -n django-with-statsd create configmap statsd-mapping-config --from-file=./config/statsd-mapping.conf
The section which mounts volume looks like this in the deployment file.
    spec:
      containers:
      - name: statsd-exporter
        image: prom/statsd-exporter:latest
        args:
        - '--log.level=info'
        - '--statsd.mapping-config=/etc/config/statsd-mapping.conf'
        #- --statsd.event-flush-interval=16s

        volumeMounts:
        - name: config-volume
          mountPath: /etc/config/

      - name: django-sample-project
        image: ankitnayan/django_sample_project:quantiles_v1


      volumes:
      - name: config-volume
        configMap:
          name: statsd-mapping-config
          items:
          - key: statsd-mapping.conf
            path: statsd-mapping.conf
Next we apply our deployment file by kubectl -n django-with-statsd apply -f k8s/django-deployment.yml. The pod should now contain the file statsd-mapping.conf at /etc/config/. You can verify this by:
$ POD_NAME=`kubectl -n django-with-statsd get pods -o jsonpath='{.items[0].metadata.name}'`
$ kubectl -n django-with-statsd exec -it pod/$POD_NAME /bin/sh
If you can see the file by ls /etc/config/, then you are good to proceed.
Just to cross reference, we shall now take a look at the metrics which prometheus scrapes by ssh-ing into the cluster and fetching the metric endpoint exposed to prometheus as scrape target.
Since the prometheus expression browser is accessed via tunnel at port 9090 on localhost (as set up in previous blog). Visit http://localhost:9090/targets#job-kubernetes-pods, it gives you the list of pods as targets. Mine looks like this:

The endpoints contain the metrics that prometheus scrapes at scrape-interval. These endpoints are internal addresses and can be accessed only within the cluster. So ssh into any of the ec2 instances which are nodes in your cluster. I chose to do by EC2 Instance Connect (browser-based SSH connection)provided in aws console.
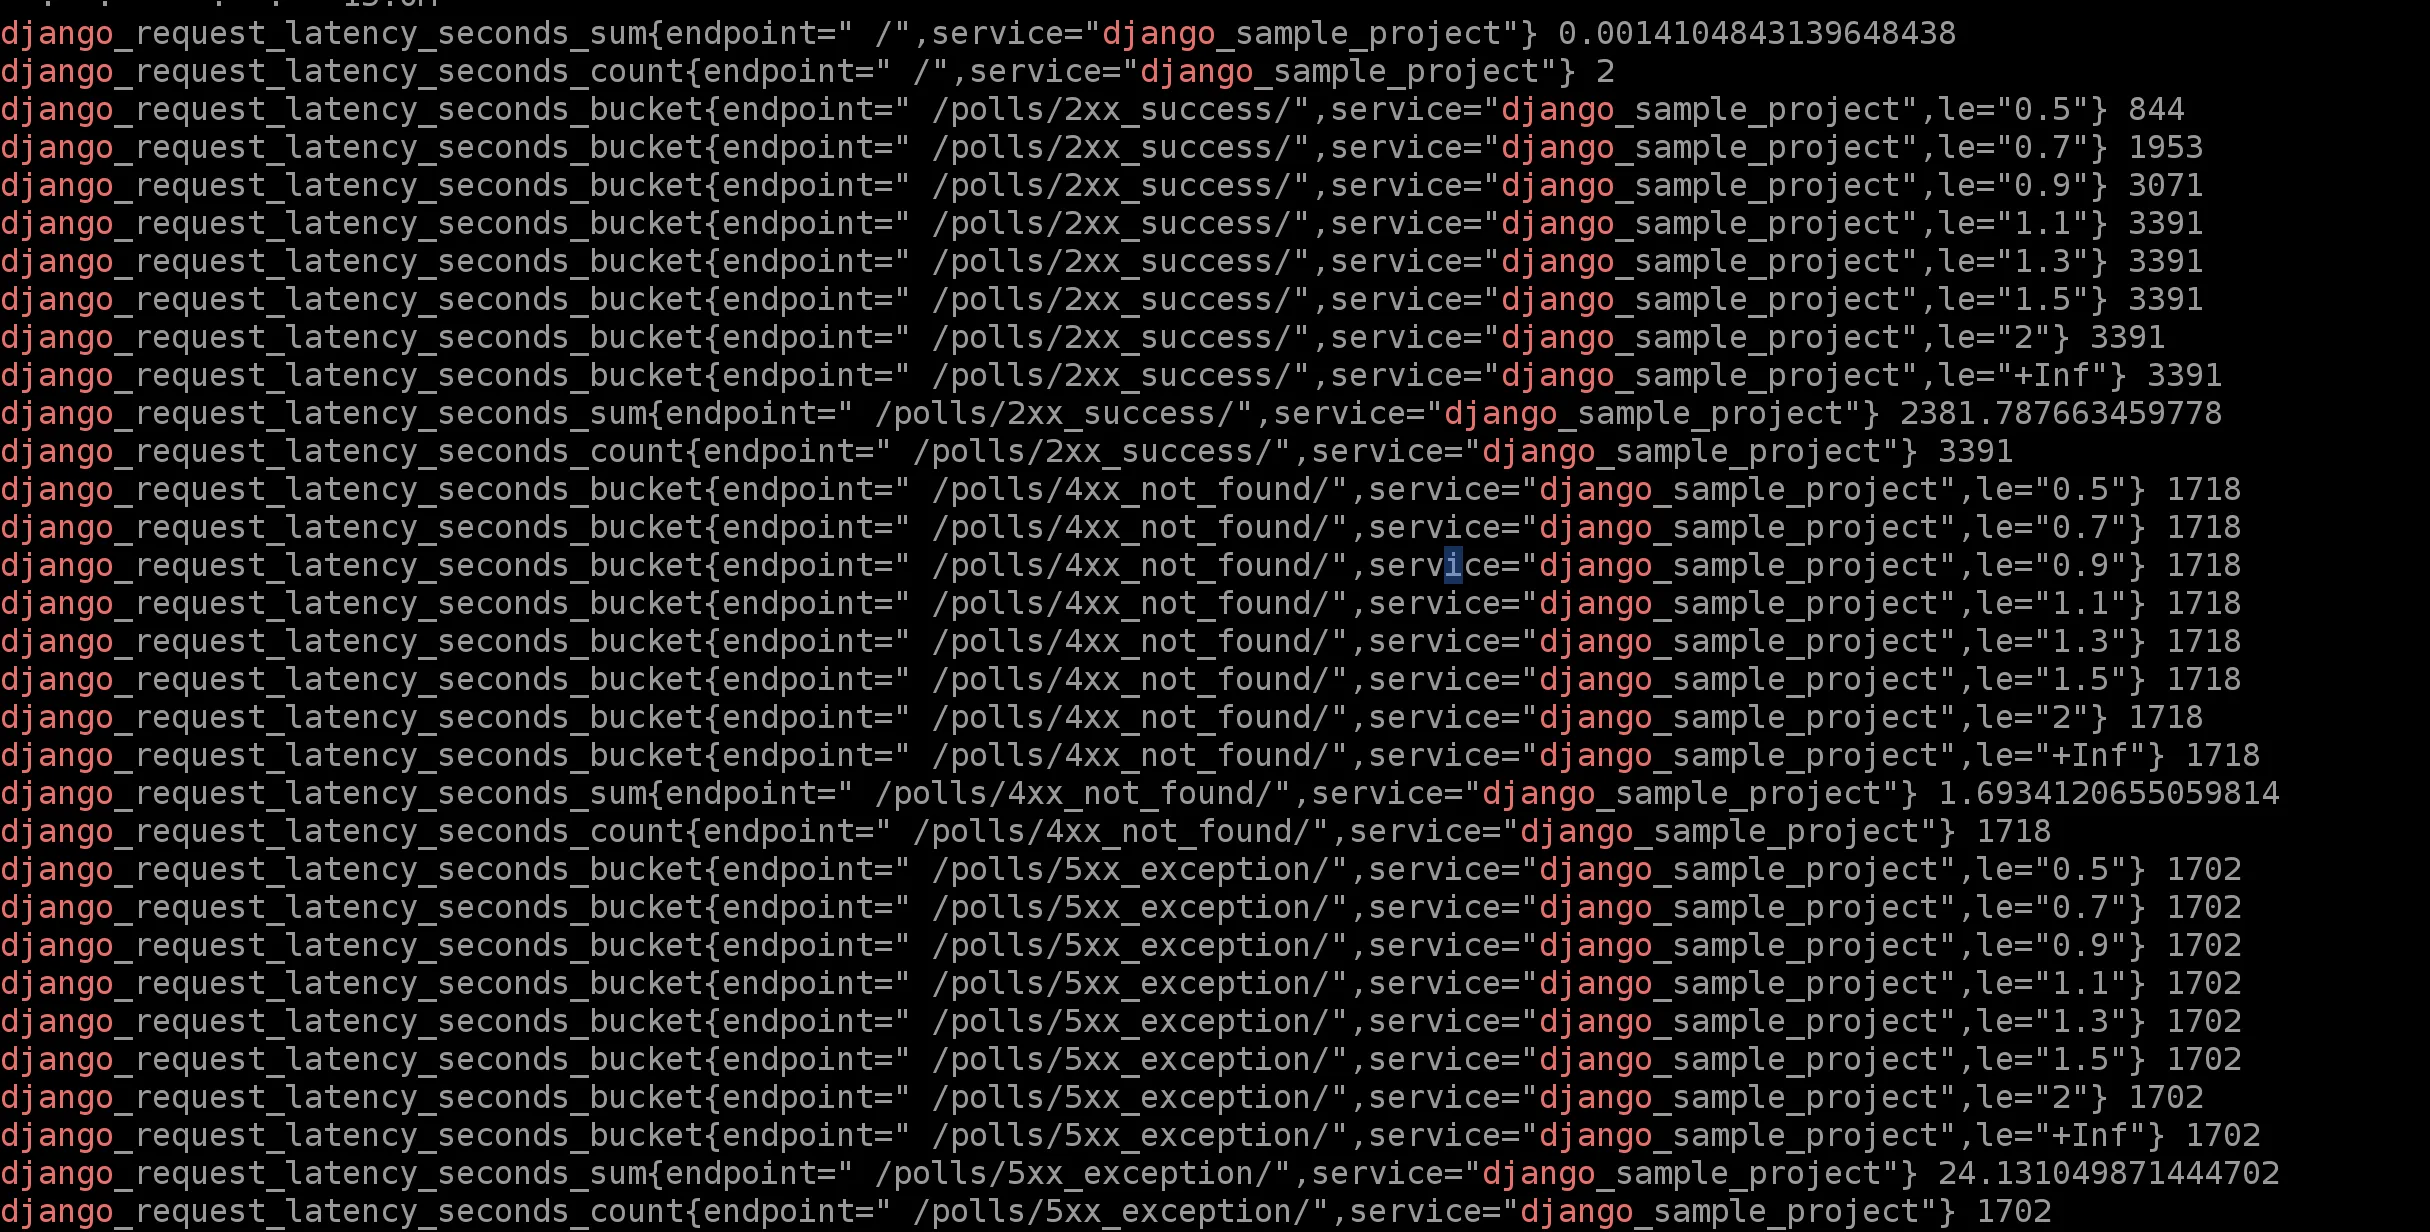
When you get into the instance, run curl http://192.168.19.6:9102/metrics | grep django and replace http://192.168.19.6:9102/metrics by your scrape target. The output will look something like this:

Now our application instrumented metrics does not contain quantiles but shall contain buckets and this can easily be aggregated in prometheus by running below command to your expression browser.
histogram_quantile(0.5, sum(rate(django_request_latency_seconds_bucket{endpoint="/polls/2xx_success/"}[1m])) by (le))
I usually get the output to be around 0.63-0.7. I hope you get something similar.
This is the aggregated 0.5 quantile (median) from all statsd-exporter instances. Similarly, in the above PromQL we can replace 0.5 by 0.9 and 0.95 to get the 90th percentile and 95th percentile respectively.
Keep in mind to generate load from locustio before running these promql queries since we are working on rate (per second) of metrics or else you shall get NaN in output
Plotting percentiles and 5 slowest endpoints in Grafana
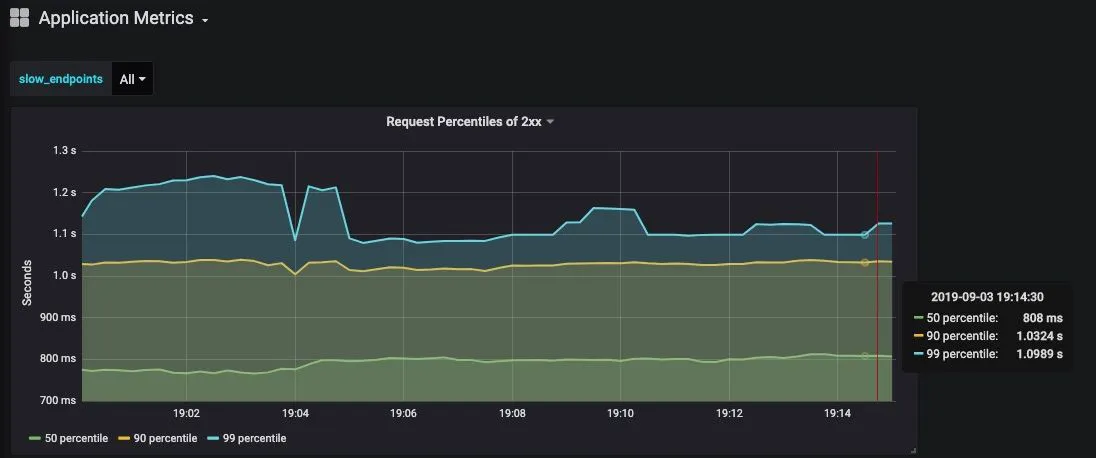
You can get the below graph by applying this query in grafana:
histogram_quantile(0.5, sum(rate(django_request_latency_seconds_bucket{endpoint="/polls/2xx_success/"}[5m])) by (le))
Add 2 more queries with 1st arg to histogram_quantile as 0.9 and 0.99.

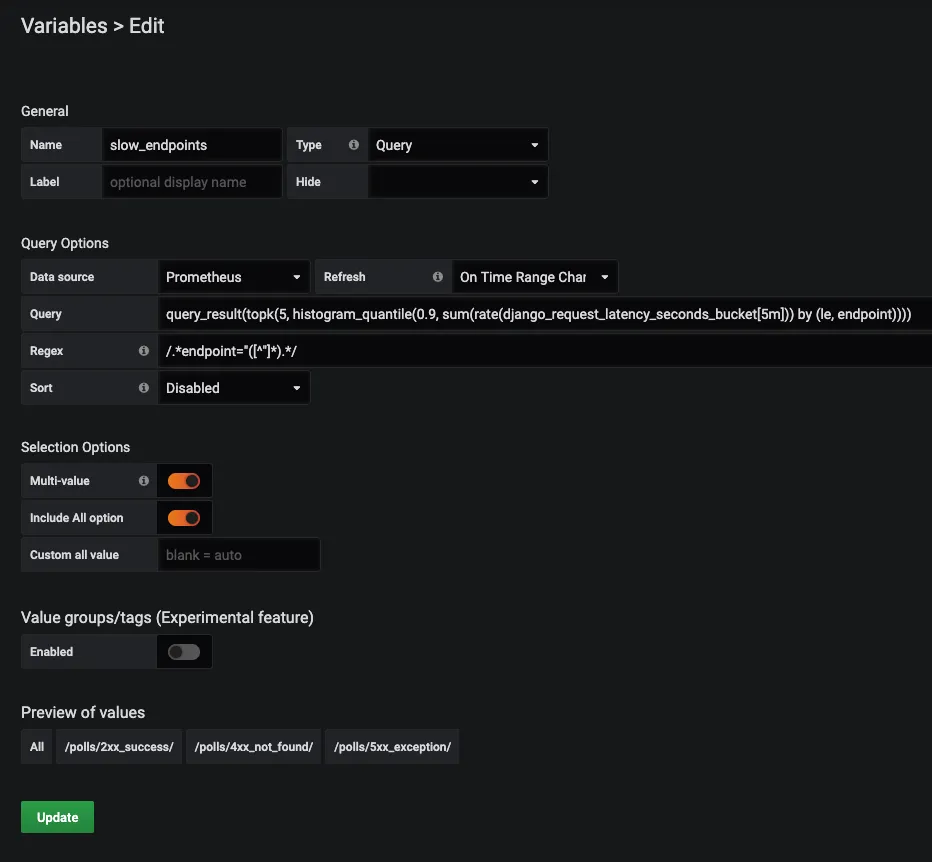
To get the 5 slowest endpoints follow blog Graph top N time series in Grafana. A slight change will be the Regex expression for the variable. Check mine from the below image.

And, the grafana query becomes histogram_quantile(0.9, sum(rate(django_request_latency_seconds_bucket{endpoint=~"$slow_endpoints"}[5m])) by (le, endpoint))
Finally the graph we plot is:

I have only 3 endpoints so it displays only 3 endpoints in the graph but this works for >5 endpoints also
I hope, this blog helped those looking for ways to aggregate percentiles/quantiles from multiple instances of statsd-exporter in prometheus.
For any Prometheus related query reach me out on Twitter or mail me at ankit@signoz.io

