Prometheus vs InfluxDB - Key Differences, concepts, and similarities
Prometheus and InfluxDB are open-source projects created to make application performance monitoring a breeze. That is, of course, if you choose the option that covers your entire observability scope.

This article compares and contrasts the extent to which Prometheus and InfluxDB remedy the need for real-time insights into your applications’ operations. We’ll highlight similarities and overlaps in both usability and practicality.
Typically, every reader’s choice ultimately depends on their use case. As such, the knowledge we’ll expose you to should help you make informed choices on which tool works best.
No prior experience with either tool is necessary. However, some query language knowledge and some understanding of metrics will go a long way in assimilating the content to follow.
A Crash Course to Prometheus

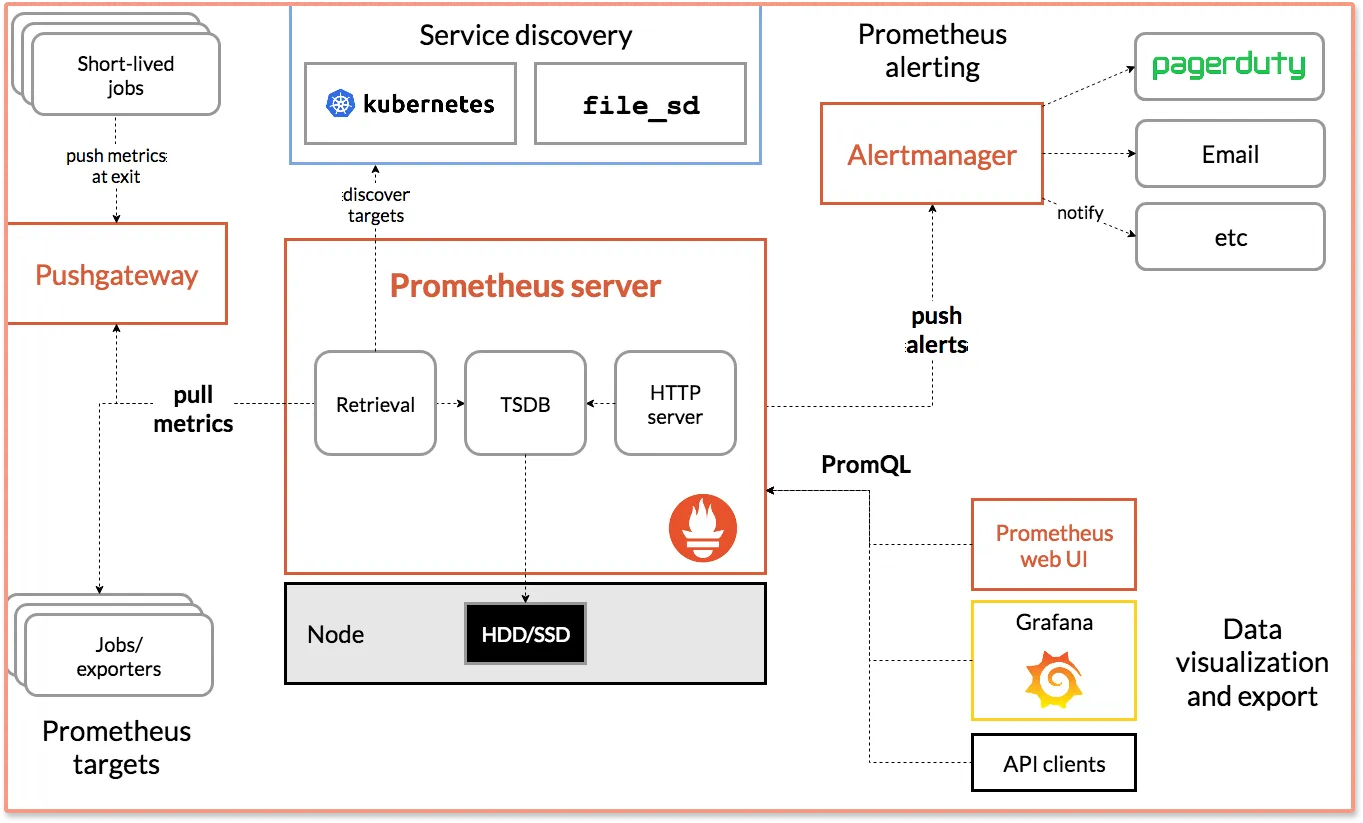
First deployed for open use by SoundCloud, Prometheus is a package of system monitoring and event alerting tools. Since 2016, it's been a part of the Cloud Native Computing Foundation (CNCF.) The same governance body for other revolutionary tools, such as the Kubernetes project.
A typical Prometheus instance execution exposes a time-series model multi-dimensional database. It binds metrics and key/value arrays. The metrics data stored can be rendered in easy-to-evaluate visualizations through the default Expression Browser. But Prometheus provides a basic visualization layer. It is often teamed up with Grafana, an open-source data visualization tool to create richer dashboards.

Currently, data streams from the instrumentation of Prometheus' various client libraries are converted into time series models and formats. However, plans are underway to reveal system insights in an assortment of metric options:
Gauge - This is the metric type typically responsible for fluctuating readings on dashboards. For example, where resource usage (compute, storage, etc.) varies over time. So a gauge metric would suffice to push metrics for effective observability.
Counter - A metric that exposes a quality that only increases (positive count or reset). A good application area would be showing how many times an application has been visited over an observed duration.
Summary - In addition to the counter metric's ability, a summary exposes the intensity of an observed event. This facilitates comparative analysis of metrics, especially when they emerge from multiple telemetry collection sources/edges.
Histogram - Much like the summary metric, histogram metrics show a multi-variable sample result. They further group output into bars over the duration of observation. This facilitates comparative analysis of metrics. Especially when they emerge from multiple telemetry collection sources/edges.
InfluxDB 101 - A Crash Course

Available as an open-source tool, alongside a paid distribution of the same, InfluxDB provides a time-series data platform. InfluxDB is a capable time-series engine with a wide range of application areas. It’s designed to ingest and process multiple data points ingesting anything from metrics, traces, logs, and events.
InfluxDB was penned in Go, backed by the Y Combinator accelerator initiative, and officially deployed for public access in 2013 by then Errplane (now InfluxData).
InfluxDB comes filled to the brim with tools that facilitate the full range of data manipulation activity spectrum. These include:
A CLI (Telegraf) that is used to streamline read and write tasks from the actual data storage location. It comes in handy across all hosting options, cloud, local, and hybrid.
Querying and processing data from InfluxDB instances is made possible through the use of either InfluxQL or the proprietary Flux language, solely created for data scripting. With some practice, low-code end users can configure and schedule complex tasks through the InfluxDB UI to process data into valuable insights.
Monitoring and notifying users when triggers go off. With a variety of endpoints (Slack, email, HTTP, etc.), admins/analysts can keep tabs on environment variable statuses or simple event occurrences stored in the time series engine. This gives them the edge to react quickly and maintain optimal system performance when notifications chime.
Multiple visualization options become the go-to window for enhanced visibility into systems once all APIs and client libraries have been configured correctly.
Key Similarities Between Prometheus and InfluxDB
Apart from their key intentions being congruent, the most obvious commonality is that both are OSS. This means you could get away with using either, or both platforms at no cost. While this is a good way to onboard and prove their effectiveness on your projects, it also means you'd be using the very base of their distros.
Once they fetch telemetry data, they spit out compatible data types. Being multi-dimensional time-series data storage engines, you could create a pipeline including both Prometheus and InfluxDB to squeeze the most value from every byte of data extracted through query-based results or any logs trickling in from live applications.
One implemented both Prometheus and InfluxDB platforms' performance can be extended through plugins. Plugins add functionality above and beyond the collectors and extractors crucial to fetching and provisioning telemetry data.
Key Differences: InfluxDB vs. Prometheus
Despite being clearly useful for application performance monitoring, InfluxDB and Prometheus approach their objectives differently. To start with, they use different query languages (InfluxQL and PromQL) to explore underlying data pools.
Flux and FluxQL At A Glance
Flux is the official querying language for a vast array of operations in InfluxDB. Depending on the actual task at hand, InfluxQL will resemble the regular SQL most developers are familiar with.
join(
tables: {mem:memUsed, proc:procTotal},
on: ["_timestamp", "_halt", "_begin", "host"],
)
Take, for instance, a data transformation operation above, which looks and writes like regular SQL at first glance.
Typical PromQL Commands
Prometheus implements its own command language for data operations - PromQL. We'll use the same join function to demonstrate the difference in syntax.
label_join(up{job="api-server",src1="a",src2="b",src3="c"}, "foo", ",", "src1", "src2", "src3")
Although we have condensed the code above to just a single sentence, this is not to imply relative ease of use. Code density and complexity will vary depending on prior scripting experience and the scope of operations underway.
Also, all snippets of code above are extracts from the official PromQL and InfluxQL scripting documentation volumes.
Even the way time-series data is kept in data engines is different. Approaches to data storage (append-only vs. in-memory indexing and time structured merge trees). In addition to this disparity, the degree of accuracy for event timestamps is more precise within InfluxDB compared to Prometheus time-series stores.
Although both tools are OSS projects, InfluxDB also has a paid tier offering a fully-managed experience hosted in the cloud. InfluxDB also offers an enterprise-grade user-managed version. Prometheus is free unless you decide to use distros hosted by cloud services providers (AWS, GCP, AZURE, etc.).
Conclusion: How To Select a monitoring tool
When all is said and done, one should ensure the closer fit of either Prometheus or InfluxDB to their specific monitoring requirements. Given how you can use InfluxDB to scrape data from Prometheus' collector endpoints when doing custom instrumentation, it might be worthwhile experimenting with their paired use to get the best experience.
Better still, when your application metrics monitoring scope is considerably large, going back to the fundamentals can be the way to go. Metrics are just one aspect of monitoring your application for performance issues. Today’s distributed applications need a combination of metrics, logs, and traces to debug performance issues quickly.
For that you can explore OpenTelemetry based full-stack APM, SigNoz. With SigNoz you can monitor metrics and track transactions across services with distributed tracing. There are other features like exceptions monitoring, custom dashboards, and alerts too.
You can check out SigNoz GitHub repo here:
If you want to know more about SigNoz, read this blog:


