OpenTelemetry vs Prometheus Detailed Comparison
Both OpenTelemetry and Prometheus are open-source projects under the Cloud Native Computing Foundation. OpenTelemetry is a more comprehensive observability framework with support for metrics, traces, and logs. In contrast, Prometheus is focused specifically on time-series metrics. OpenTelemetry is more versatile, and if you’re confused between choosing between the two, go for OpenTelemetry. We will delve deeper into the reason for choosing OpenTelemetry over Prometheus in this article.
In this post, we will cover:
- What is OpenTelemetry?
- What is Prometheus?
- Key Differences between OpenTelemetry and Prometheus
- Interoperability between OpenTelemetry and Prometheus
- Future-proofing your Observability with OpenTelemetry
The difference between OpenTelemetry and Prometheus originates from the projects’ scope.
While OpenTelemetry is meant to serve as a telemetry(metrics, traces, and logs) generation and collection toolkit, Prometheus is an end-to-end metrics monitoring tool.
If your use case is just metrics monitoring, then you can choose Prometheus. But that is almost never the case. You will need other signals like logs and traces for monitoring your application performance holistically. In that case, OpenTelemetry is the right choice. Not only does it cover all the use cases of metrics monitoring, but it also provides support for logs and traces as well. You can also correlate your signals when you’re using OpenTelemetry for much better contextual information while debugging application issues.
If your software system is already integrated with Prometheus, you can switch to Opentelemetry easily, as OpenTelemetry provides a way to collect Prometheus metrics.
Before we dive deeper into the differences between OpenTelemetry and Prometheus, let us have a brief overview of both.
What is OpenTelemetry?
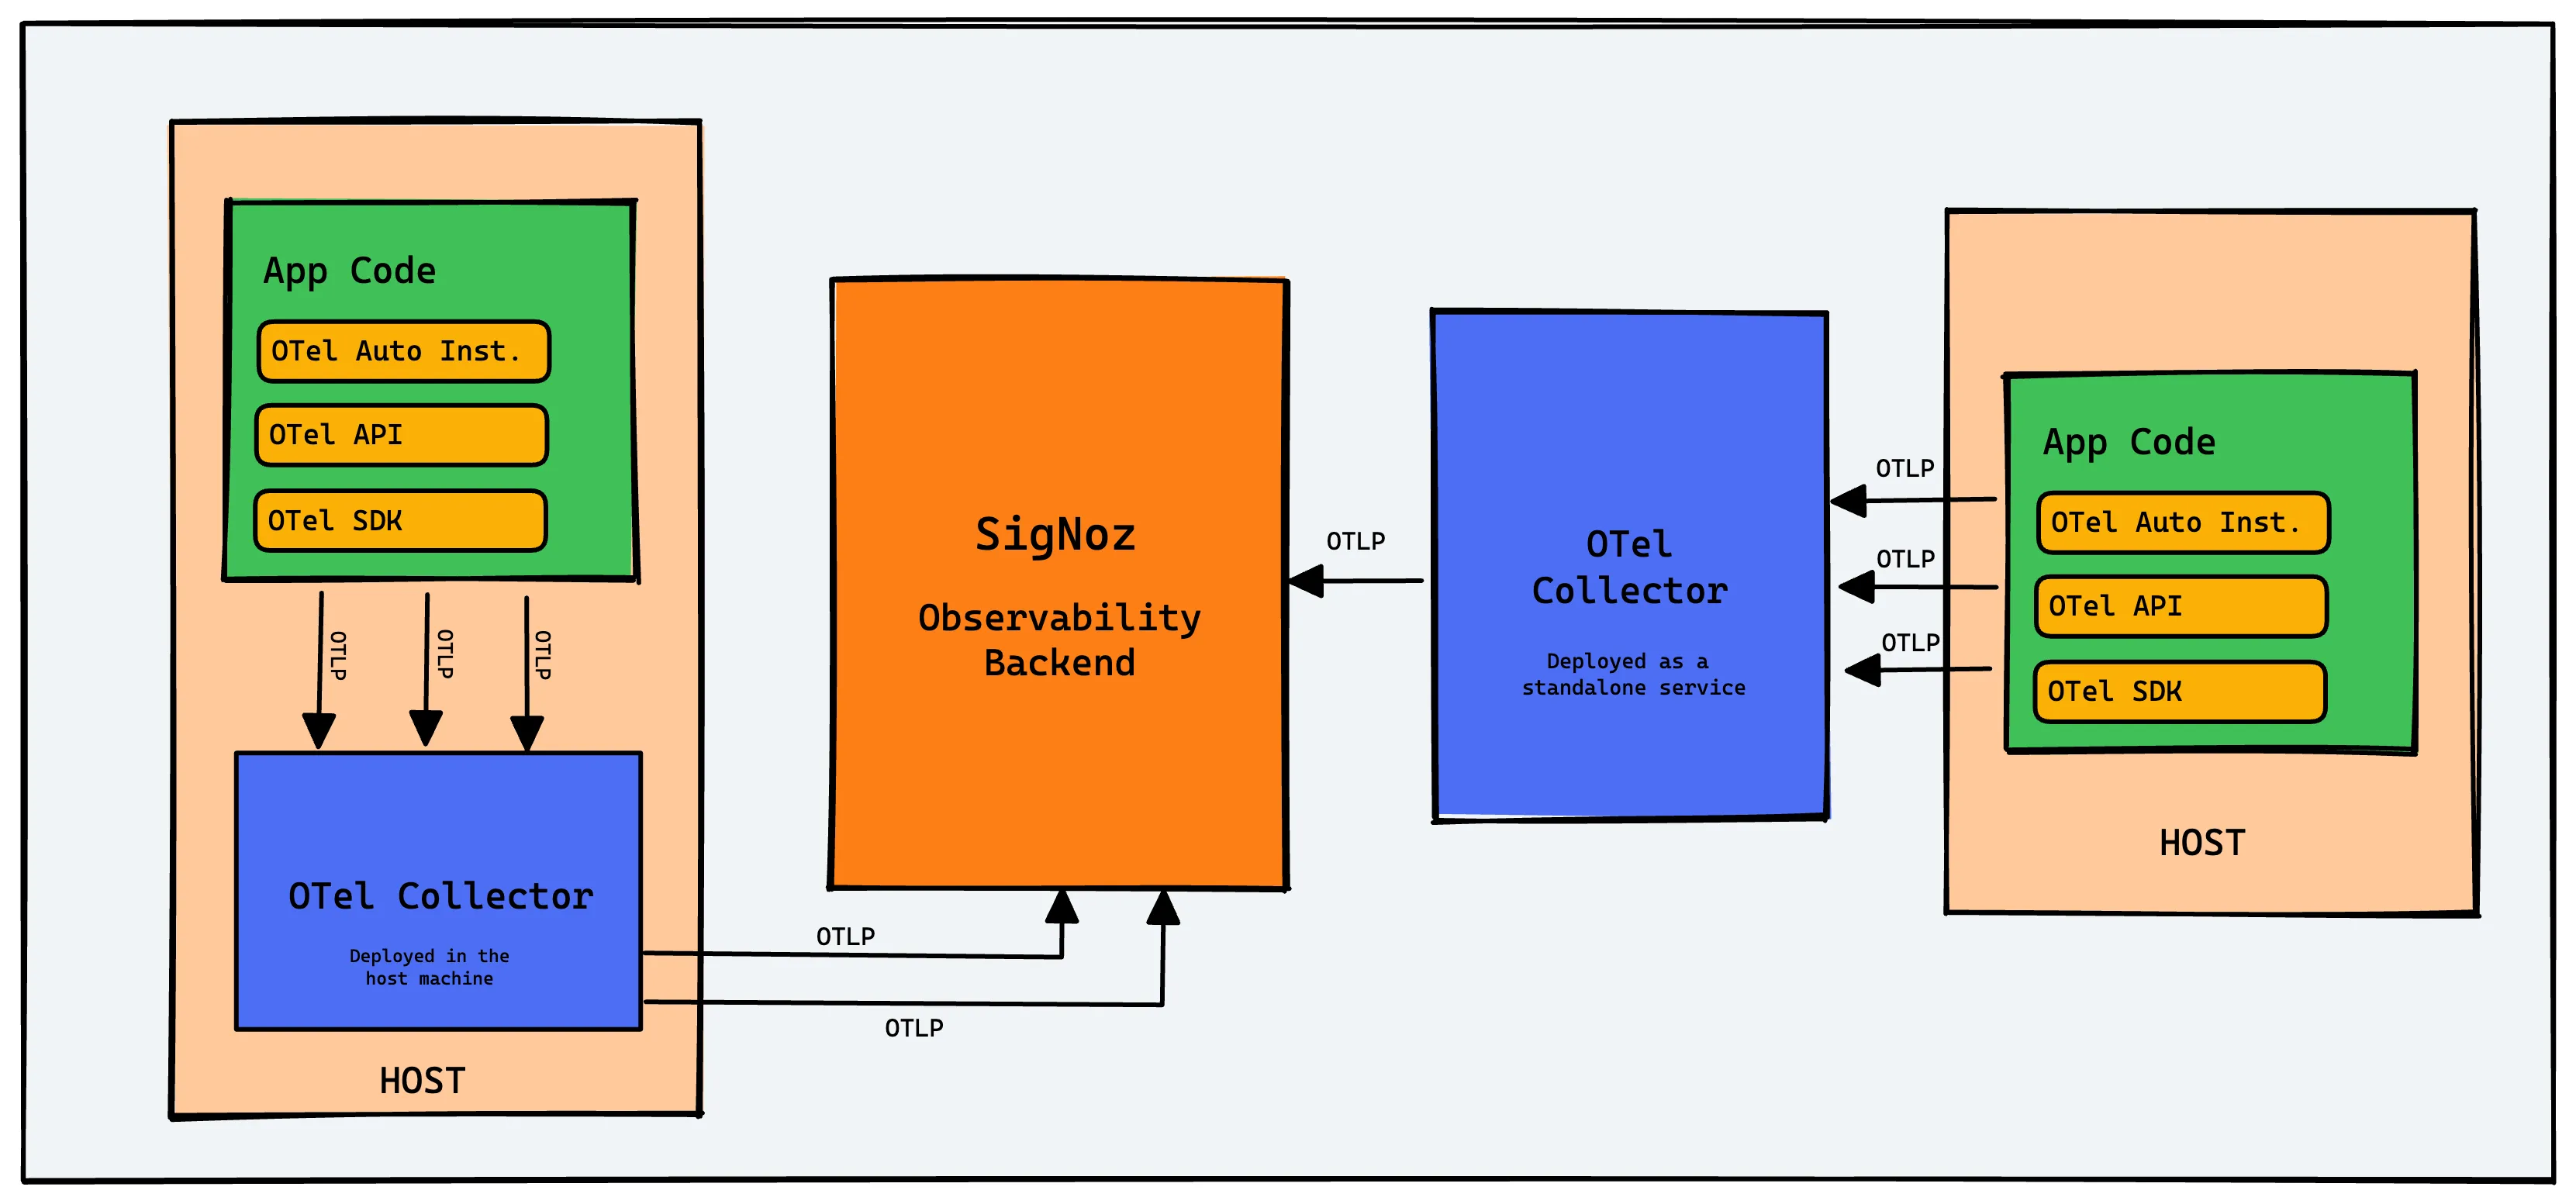
OpenTelemetry is like a toolbox for gathering information about how software is performing and behaving. It provides a set of APIs, SDKs, libraries, and integrations that aim to standardize the generation, collection, and management of telemetry data(logs, metrics, and traces). OpenTelemetry is a Cloud Native Computing Foundation project created after the merger of OpenCensus(from Google) and OpenTracing(from Uber). CNCF is the same foundation that incubated Kubernetes, too.
Once the data is collected, OpenTelemetry can process it (like adding extra information, aggregating it, or formatting it) and then export it to any analysis tool like SigNoz, which supports OpenTelemetry data for monitoring and visualization.

Key Components of OpenTelemetry
OpenTelemetry has a lot of components in its ecosystem. Everything in OpenTelemetry is based on OpenTelemetry specification, which are a detailed set of rules and guidelines. It defines what telemetry data (like traces, metrics, and logs) should look like and how it should be collected, processed, and exported.
Users who are getting started with OpenTelemetry sometimes get confused with so many components in the OpenTelemetry ecosystem. But as an end-user, you only need to know about two key components to get started.
OpenTelemetry Client libraries
These are specific implementations of the OpenTelemetry API and SDK for different programming languages. They are the actual packages or modules that developers integrate into their software applications to collect, process, and export telemetry data (metrics, logs, and traces).OpenTelemetry Collector
The OpenTelemetry Collector is a standalone service or agent that can collect, process, and export telemetry data (metrics, traces, and logs). It plays a crucial role in the OpenTelemetry architecture by acting as a central component that can receive data from various sources, process and enrich this data, and then send it to multiple backends for analysis and monitoring.
OpenTelemetry Collector - architecture and configuration guide
Apart from these two, there are a few other OpenTelemetry components too which are useful for end-users. For example, OpenTelemetry Operator is a Kubernetes operator designed to simplify the deployment and management of the OpenTelemetry Collector in Kubernetes environments.
What is Prometheus?
Prometheus is used as an end-to-end metrics monitoring tool. But if we have to answer what Prometheus is, we will go with - Prometheus is a time-series database and provides efficient mechanisms to store, retrieve, and manage time-series data.
Specifically, it focuses on the collection and storage of metrics data. Metrics are a type of time-series data commonly used for monitoring purposes, such as tracking the number of requests to a server over time.
A Prometheus data point comprises of:
- Metric name
- Labels: Labels provide additional dimensions for the metric.
- Timestamp
- Value
An example Prometheus datapoint will look like:
At 10:00 AM: http_requests_total{job="webserver", method="GET", status="200"} = 340

Key Components of Prometheus
As we mentioned earlier, Prometheus is an end-to-end metrics monitoring system. Its components cover the entire spectrum of generating, collecting, storing, and visualizing metrics data.
Here are the key components of Prometheus:
- Client libraries
It provides client libraries for several programming languages that allow you to instrument your code to expose internal metrics. - Prometheus Server
The core component of Prometheus, the server, is responsible for scraping and storing time-series data. It collects metrics from configured targets at given intervals, evaluates rule expressions, displays the results, and can trigger alerts if some condition is observed to be true. - Time-series database
Prometheus stores all scraped samples locally and runs rules over this data to either aggregate and record new time series from existing data or generate alerts. - PromQL
It’s a query language used to select and aggregate time-series data in real-time. - A basic web interface
Prometheus provides a basic web interface where you can visualize data. It is often combined with Grafana for metrics visualization.
Now that you have an idea of what both projects encompass, let’s understand their differences.
A fair comparison between OpenTelemetry and Prometheus should focus on the instrumentation layer, where you configure what type of metrics can be collected. If you’re comparing OpenTelemetry and Prometheus, then we suppose your use case is metrics monitoring only.
Key Differences between OpenTelemetry and Prometheus
A fair comparison between OpenTelemetry and Prometheus should focus on the instrumentation layer, where you configure how and what type of metrics can be collected. Whatever metrics you can collect with Prometheus can be collected with OpenTelemetry too.
OpenTelemetry supports delta representations
OpenTelemetry is more versatile in terms of metrics collection when compared to Prometheus. For example, OpenTelemetry supports delta representations while Prometheus does not. The concept of "delta representation" refers to a way of capturing and representing metric data that emphasizes the change in the measured value over a period of time, rather than its absolute value. This can be crucial in monitoring and alerting systems where sudden changes in metrics need to be detected and acted upon. Delta metrics can simplify certain calculations, like rate determination, and can be more efficient in terms of storage and processing.
OpenTelemetry supports correlation with other signals
The key idea behind OpenTelemetry is providing a single open-source standard for all types of telemetry data - metrics, logs, and traces. The advantage of using OpenTelemetry over Prometheus is you can correlate your metrics with other signals like logs and traces. For example, metrics can be used to monitor overall application performance, such as response times and request rates.While traces provide detailed information about individual user requests and the path they take through the application.
OpenTelemetry supports exporters for various backends
Prometheus is an end-to-end monitoring tool. While, OpenTelemetry can export data to a variety of backends, including Prometheus, giving users the flexibility to choose their preferred monitoring and analysis tools.
Prometheus provides storage and visualization layer
As OpenTelemetry is meant to address the generation and collection of telemetry data, it does not provide a storage or visualization layer. You can configure OpenTelemetry SDKs to send data to any analysis tool of your choice. For example, you can use OpenTelemetry-native APM like SigNoz to store and visualize your OpenTelemetry data.
Whereas Prometheus provides a time-series database and basic web visualization layer for metrics monitoring. It also provides an alert manager to create alerts on metrics. Prometheus if often clubbed with Grafana for better visualization of metrics data.
Interoperability between OpenTelemetry and Prometheus
Prometheus supports OpenTelemetry metrics. On the other hand, you can configure OpenTelemetry Collector to collect metrics from Prometheus targets. This interoperability means you can use both the tools to monitor your software systems based on your use case.
OpenTelemetry Collector provides various receivers including a receiver for Prometheus which you can use to collect Prometheus metrics. The data flow for this setup will look like below:
Prometheus target —> OpenTelemetry Collector —> Backend of your choice
A smaple config file of OpenTelemetry collector for the above set up will look like below:
receivers:
  otlp:
    protocols:
      grpc: {}
      http: {}
  prometheus:
    config:
      global:
        scrape_interval: 15s # Adjust this interval as needed
      scrape_configs:
        - job_name: 'flask'
          static_configs:
            - targets: ['127.0.0.1:5000'] # Adjust the Prometheus address and port

processors:
  batch:
    send_batch_size: 1000
    timeout: 10s

exporters:
  otlp:
    endpoint: "ingest.{region}.signoz.cloud:443"
    tls:
      insecure: false
    timeout: 20s # Adjust the timeout value as needed
    headers:
      "signoz-access-token": "<SIGNOZ_INGESTION_KEY>"
  logging:
    verbosity: detailed

service:
  telemetry:
    metrics:
      address: localhost:8888
  pipelines:
    metrics:
      receivers: [otlp, prometheus]
      processors: [batch]
      exporters: [otlp]
In the above config file, we are configuring a Prometheus receiver that has a scrape interval of 15 seconds for collecting metrics exposed at this endpoint: 127.0.0.1:5000.
How to Monitor Prometheus Metrics with OpenTelemetry Collector?
Future-proofing your Observability with OpenTelemetry
With Prometheus, you can monitor metrics. But your engineering teams will never be able to identify the root cause of issues in your application using just metrics. For that, you also need distributed tracing and logs.
OpenTelemetry is becoming the world standard for instrumenting application code due to its multi-language support and ease of use. But OpenTelemetry helps only to generate and collect telemetry data. You need to export the telemetry data to a backend analysis tool so that your teams can store, query, and visualize the collected data.
OpenTelemetry when combined with a OpenTelemetry-native APM like SigNoz can provide a one-stop solution to your observanbility needs. SigNoz is built to support OpenTelemetry natively. Once you instrument your application with OpenTelemetry libraries, you can send the collected data to SigNoz.
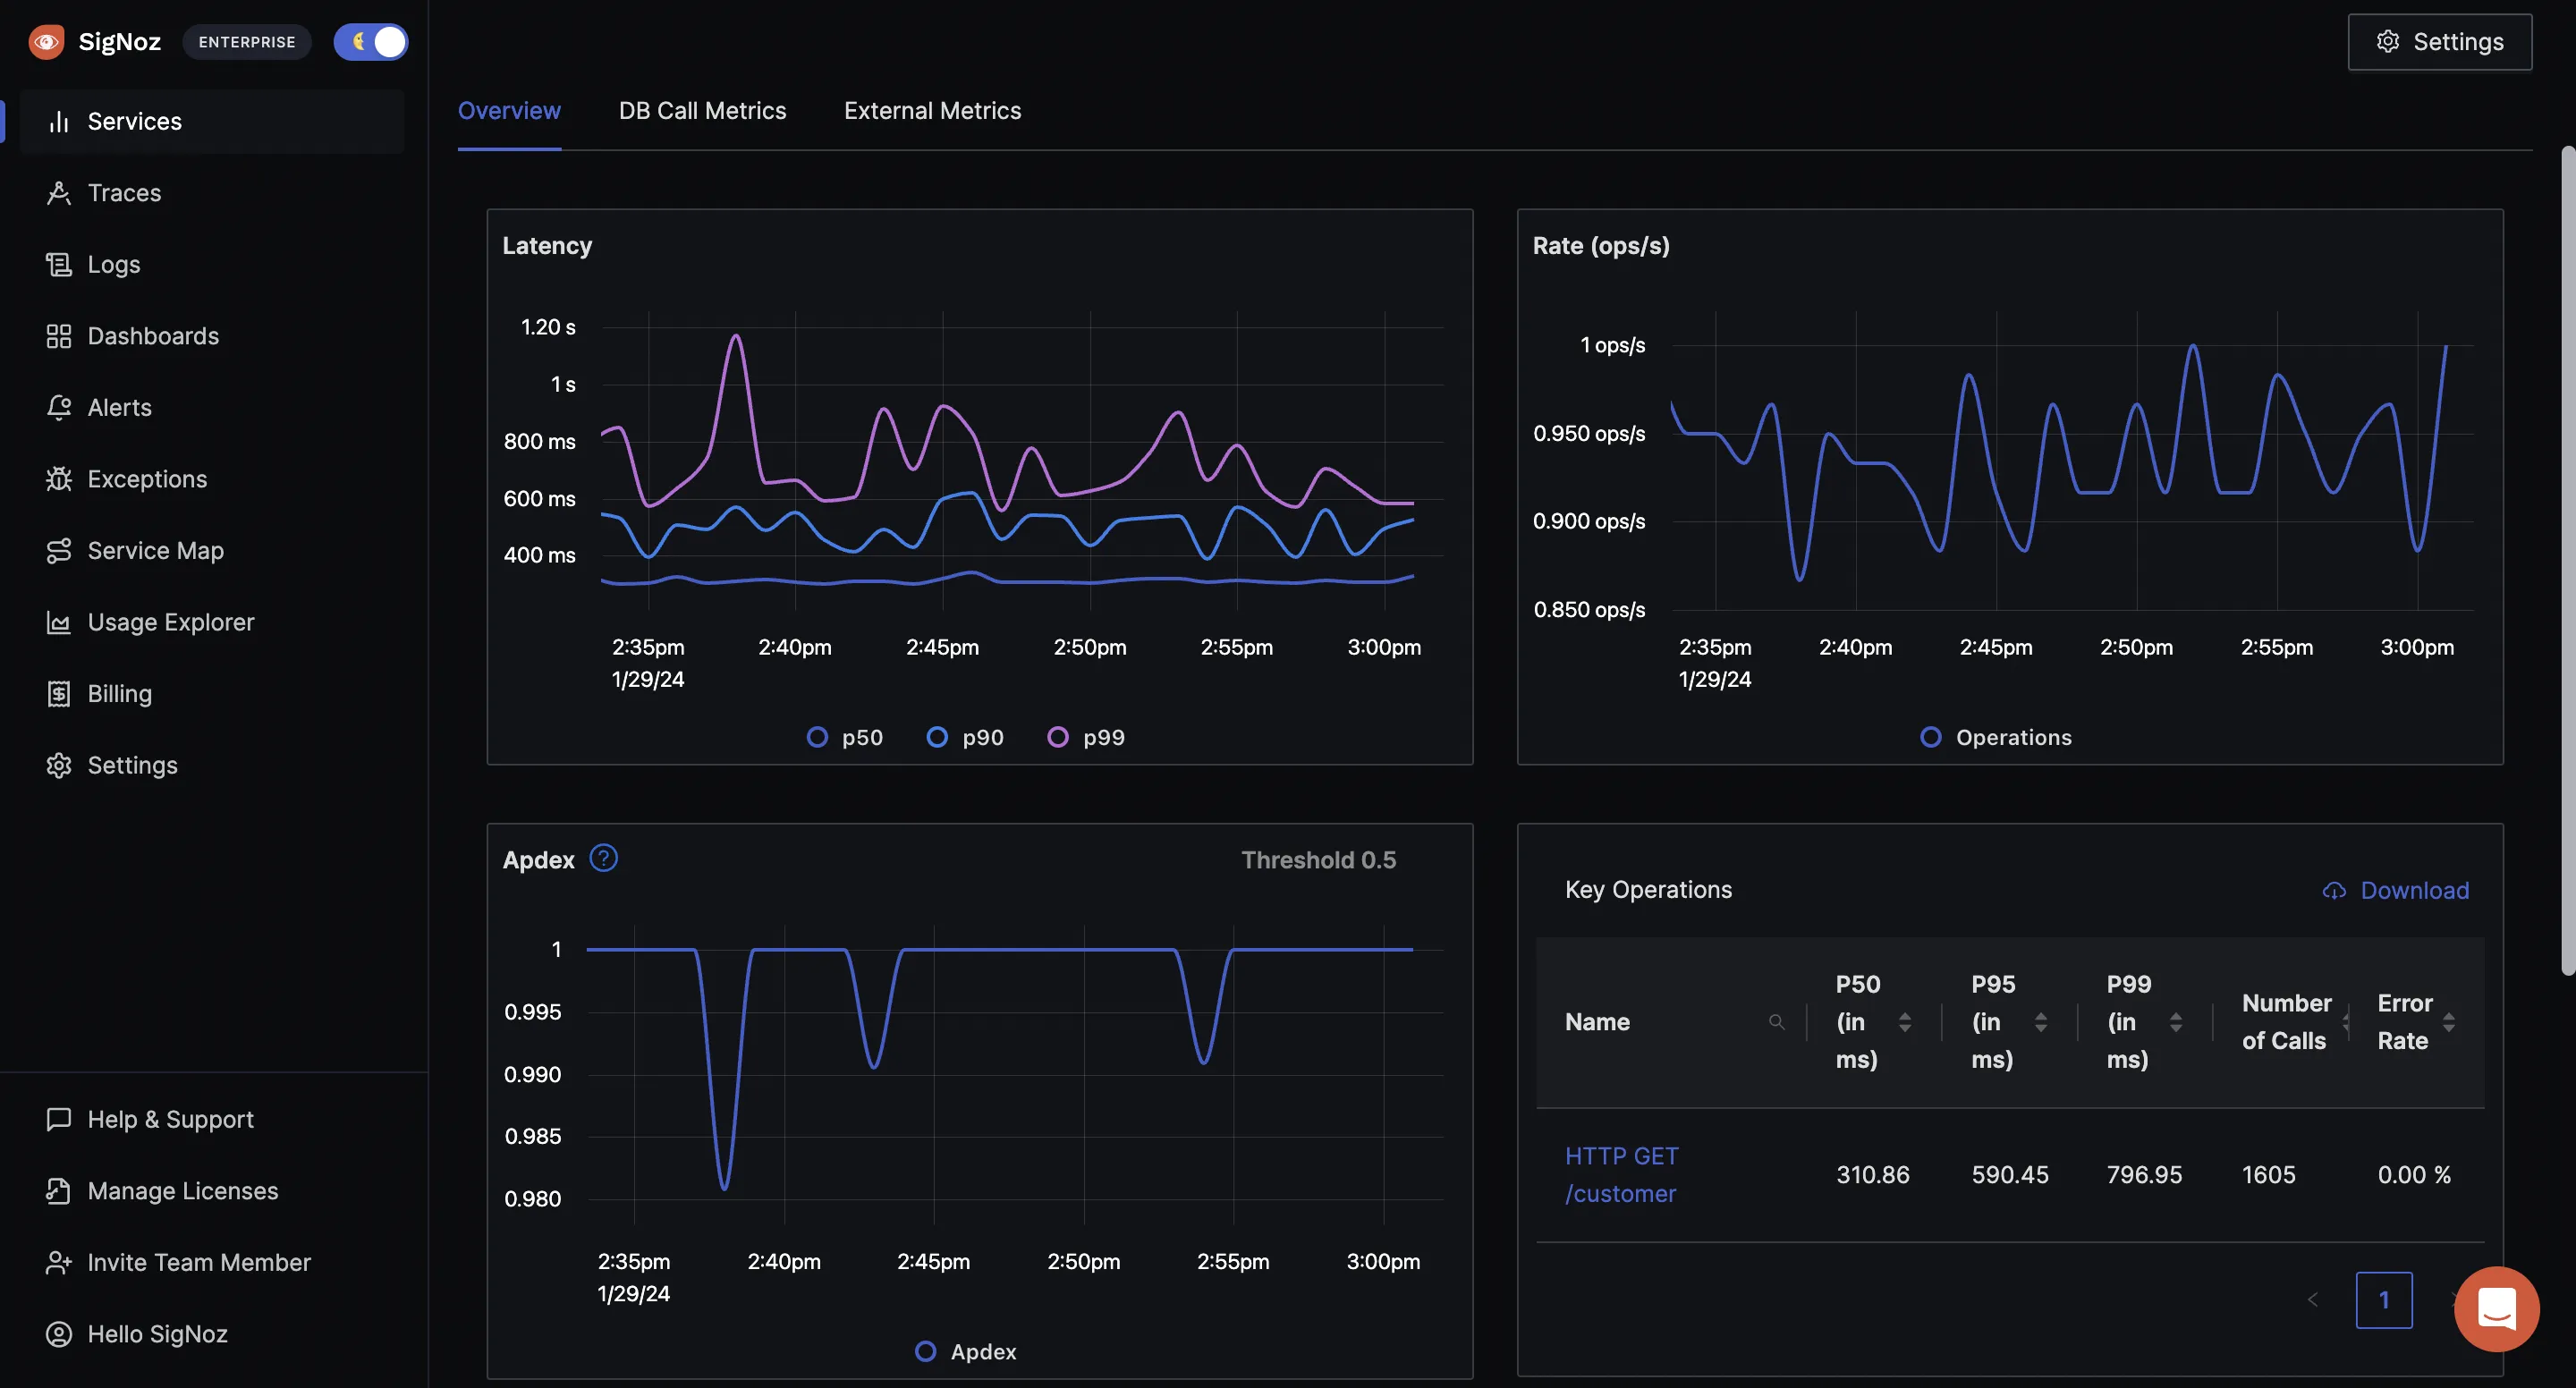
SigNoz comes with out of box visualization of things like RED metrics. There is a unified UI of logs, metrics, and traces so that you can easily identify the root cause of issues causing things like latency in your apps.


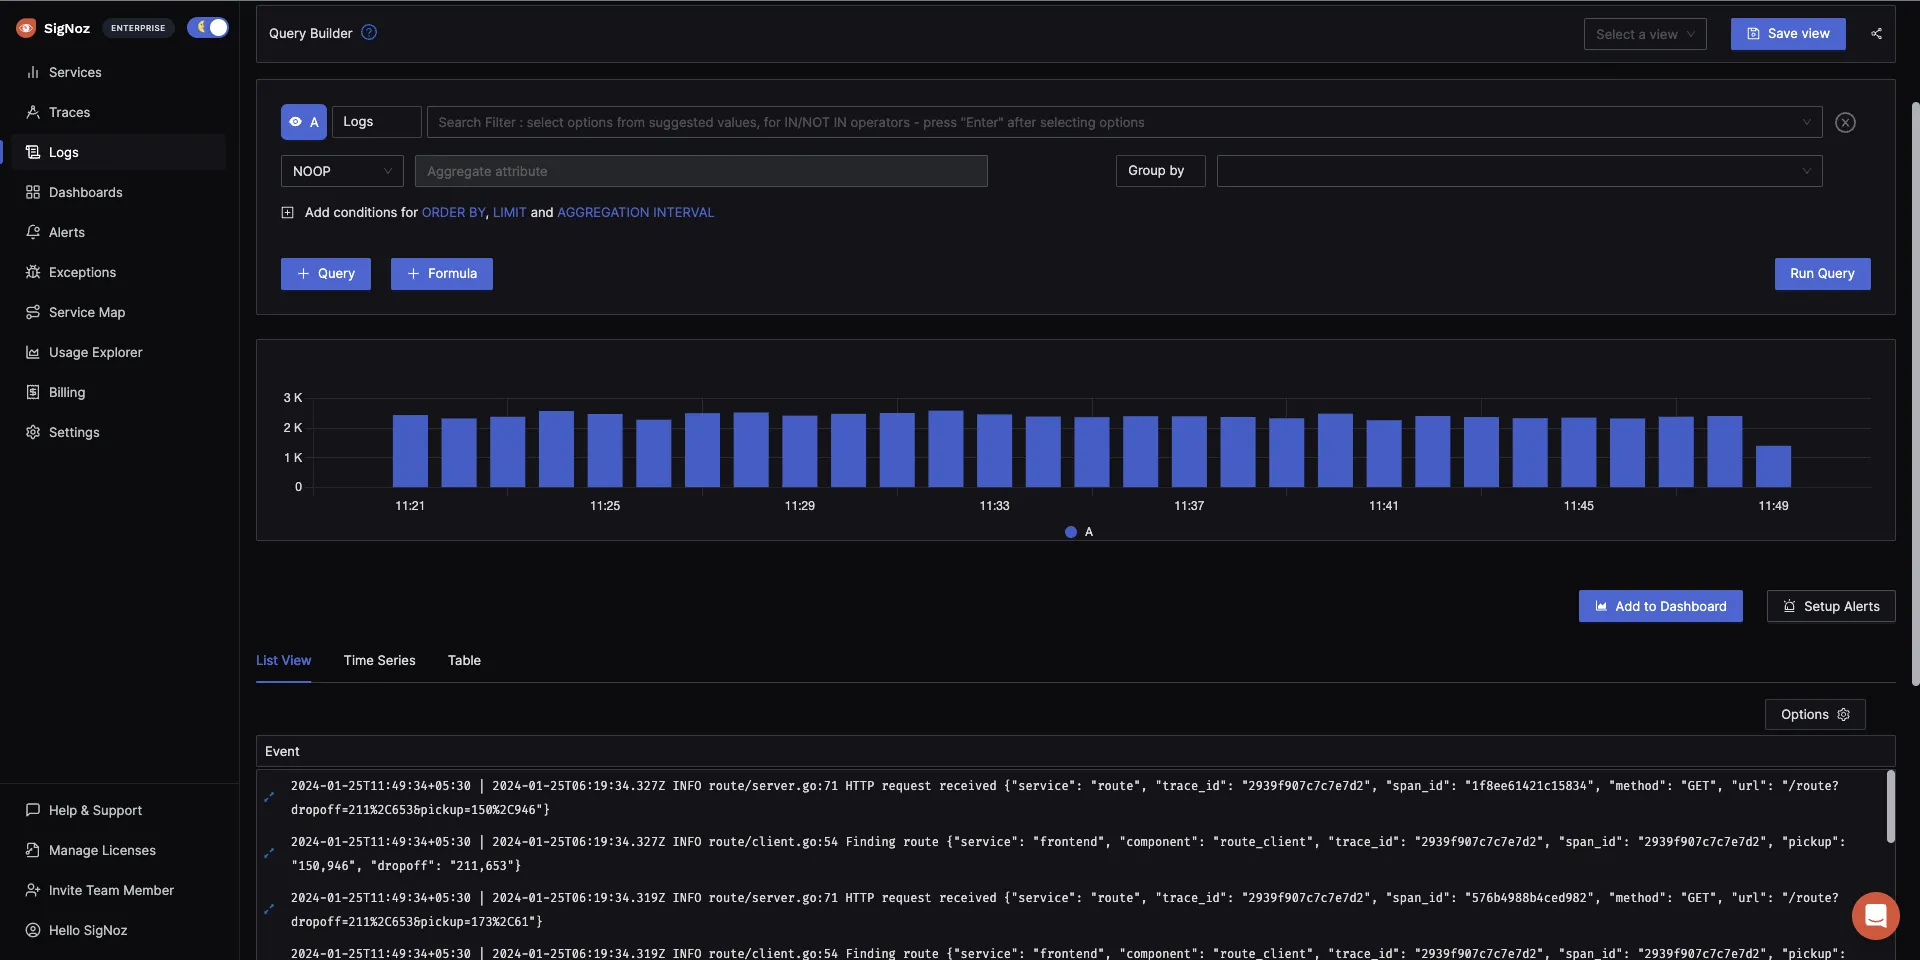
SigNoz also provides log management. Using logs, you can dive deeper into your application issues. Logs can also be intelligently correlated to other telemetry signals like traces and metrics.

Getting started with SigNoz
SigNoz cloud is the easiest way to run SigNoz. Sign up for a free account and get 30 days of unlimited access to all features.
You can also install and self-host SigNoz yourself since it is open-source. With 16,000+ GitHub stars, open-source SigNoz is loved by developers. Find the instructions to self-host SigNoz.
Related Content
OpenTelemetry Collector - Complete Guide
OpenTelemetry Tracing - things you need to know
Dynatrace vs New Relic


