Getting Started with OpenTelemetry Visualization
OpenTelemetry is a Cloud Native Computing Foundation(CNCF) project aimed at standardizing the way we instrument applications for generating telemetry data(logs, metrics, and traces). However, OpenTelemetry does not provide storage and visualization for the collected telemetry data. For OpenTelemetry visualization, you need to use a backend that can ingest the collected data and provide a web UI to visualize it.
OpenTelemetry is quietly becoming the web standard for instrumenting cloud-native applications. For applications based on distributed systems, OpenTelemetry becomes a natural choice for instrumentation. Few reasons why OpenTelemetry is the preferred choice for generating telemetry data:
Lightweight
OpenTelemetry APIs are lightweight and are completely decoupled from any implementation. By default, OpenTelemetry APIs are no-op implementation.Diverse
OpenTelemetry provides instrumentation in almost all the major programming languages. It also covers instrumentation for a large number of open source libraries and frameworks.Community
OpenTelemetry is backed by a huge community and is incubating under CNCF. It is also backed by major cloud vendors. The huge community support makes it a safe choice for future-proofing your instrumentation layer.
But once the telemetry data is collected with OpenTelemetry, it needs to be stored and visualized for end-user consumption. A good visualization of telemetry data collected by OpenTelemetry can lead to quicker insights to debug performance issues.
What is OpenTelemetry?
OpenTelemetry is an open-source collection of tools, APIs, and SDKs that aims to standardize the way we generate and collect telemetry data. It follows a specification-driven development. The OpenTelemetry specification has design and implementation guidelines for how the instrumentation libraries should be implemented. In addition, it provides client libraries in all the major programming languages which follow the specification.
OpenTelemetry was formed after the merger of two open-source projects - OpenCensus and OpenTracing in 2019. Since then, it has been the go-to open-source standard for instrumenting cloud-native applications.
The specification is designed into distinct types of telemetry known as signals. Presently, OpenTelemetry has specifications for these three signals:
- Logs
- Metrics and
- Traces
Together these three signals form the three pillars of observability. OpenTelemetry is the bedrock for setting up an observability framework. The application code is instrumented using OpenTelemetry client libraries, which enables the generation of telemetry data. Once the telemetry data is generated and collected, OpenTelemetry needs a backend analysis tool to which it can send the data for storage and visualization.
OpenTelemetry can send to multiple backends. You can use different backends for each signal in OpenTelemetry. But managing different tools is not recommended. Engineering teams also need to correlate all signals for effective analysis. And that’s where SigNoz comes into the picture.
SigNoz - an open source APM built natively for OpenTelemetry
SigNoz is a full-stack open source APM built natively to support OpenTelemetry. It supports OpenTelemetry semantic conventions and provides visualization for all three distinct types of signals(log management is under active development) supported by OpenTelemetry.
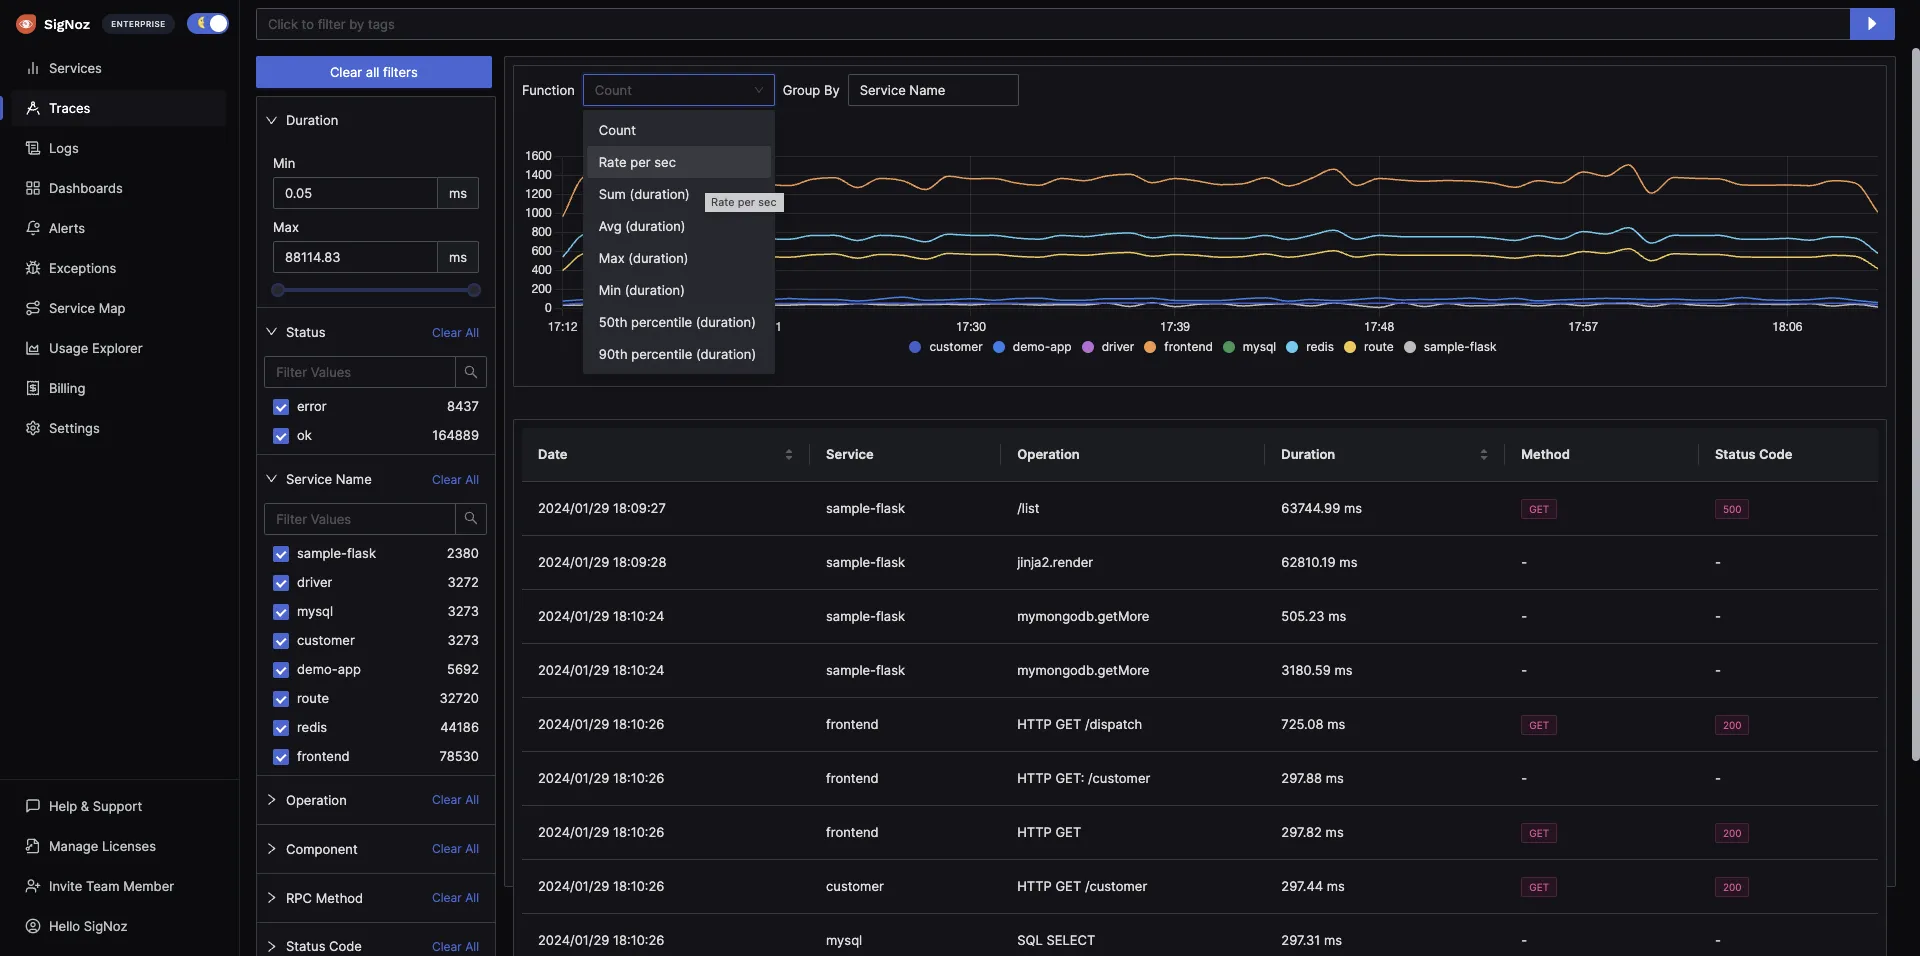
It also provides advanced OpenTelemetry visualizations of trace aggregates which can be analyzed with a powerful set of filters.
It is easy to get started with SigNoz. It can be installed on macOS or Linux computers in just three steps by using a simple installation script.
The install script automatically installs Docker Engine on Linux. However, you must manually install Docker Engine on macOS before running the install script.
git clone -b main https://github.com/SigNoz/signoz.git
cd signoz/deploy/
./install.sh
You can visit our documentation for instructions on how to install SigNoz using Docker Swarm and Helm Charts.
Once your application is instrumented with OpenTelemetry client libraries, the data can be sent to the SigNoz backend by specifying a specific port on the machine where SigNoz is installed.
You can then use Signoz to monitor application metrics with out-of-box charts and visualization.
Visualizing OpenTelemetry data with SigNoz
A sample application comes bundled with SigNoz to explore the dashboard capabilities. Let us see what kind of visualizations are possible with OpenTelemetry data.
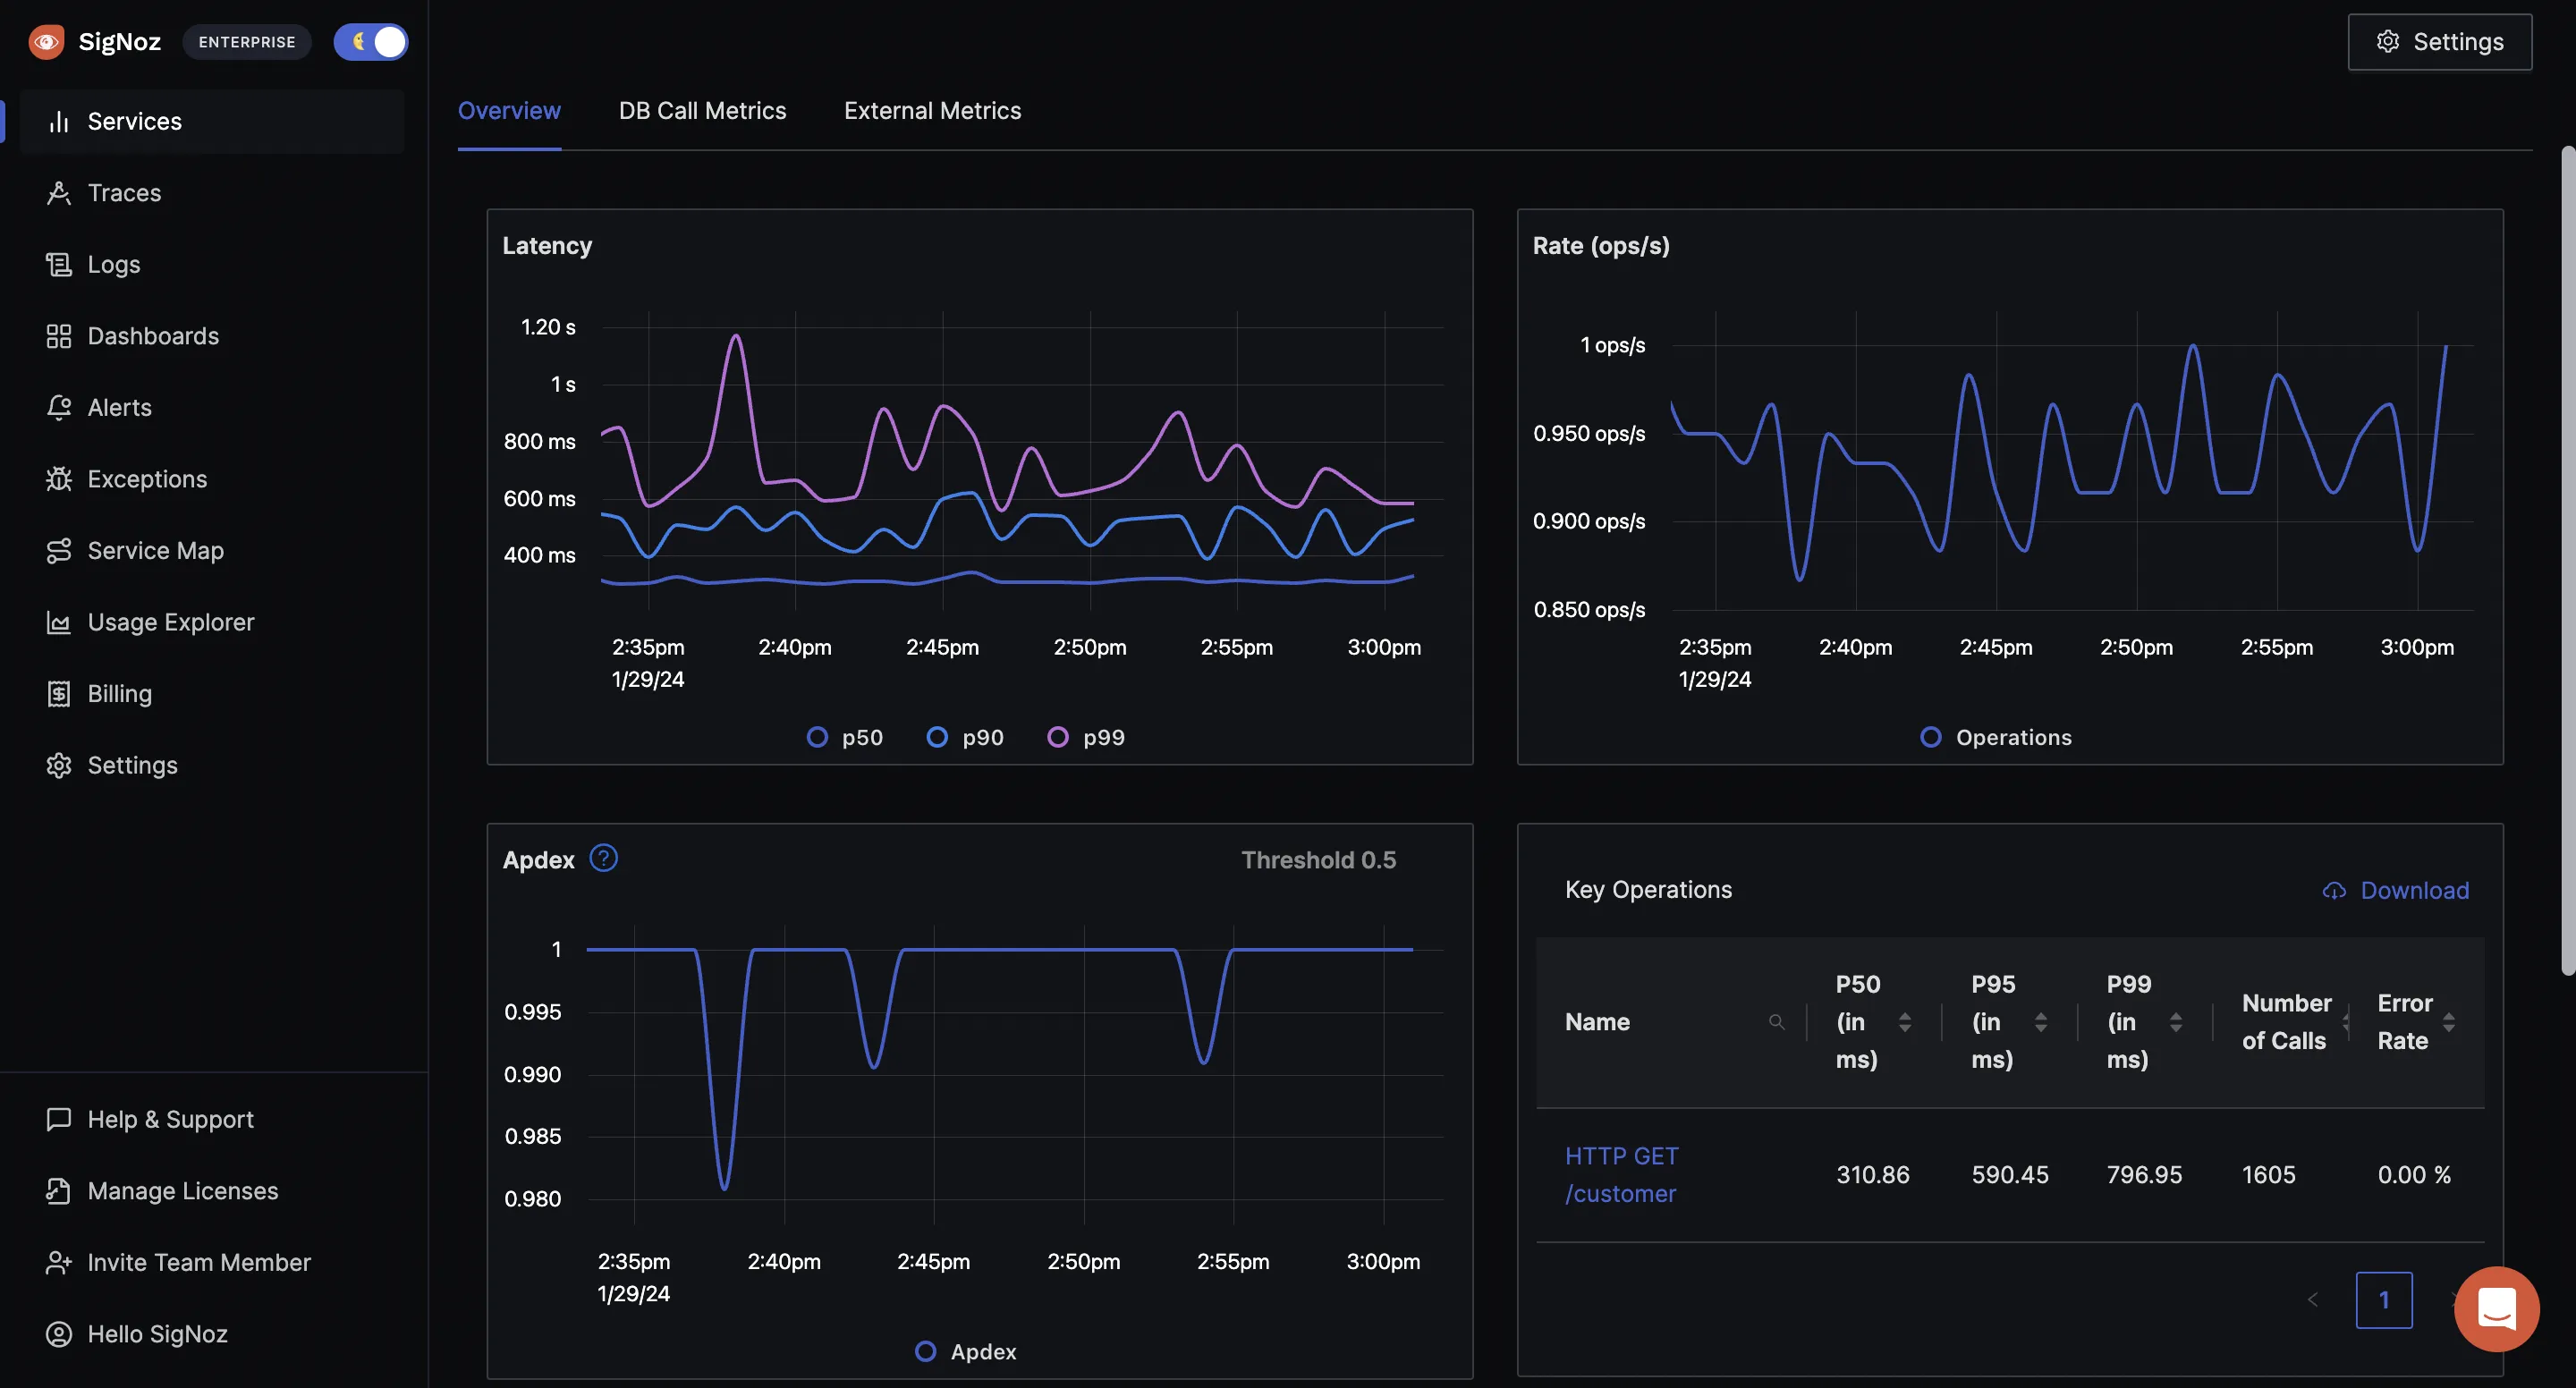
Application Metrics
SigNoz comes with out-of-box charts for the popular RED(requests, error, and duration) metrics.
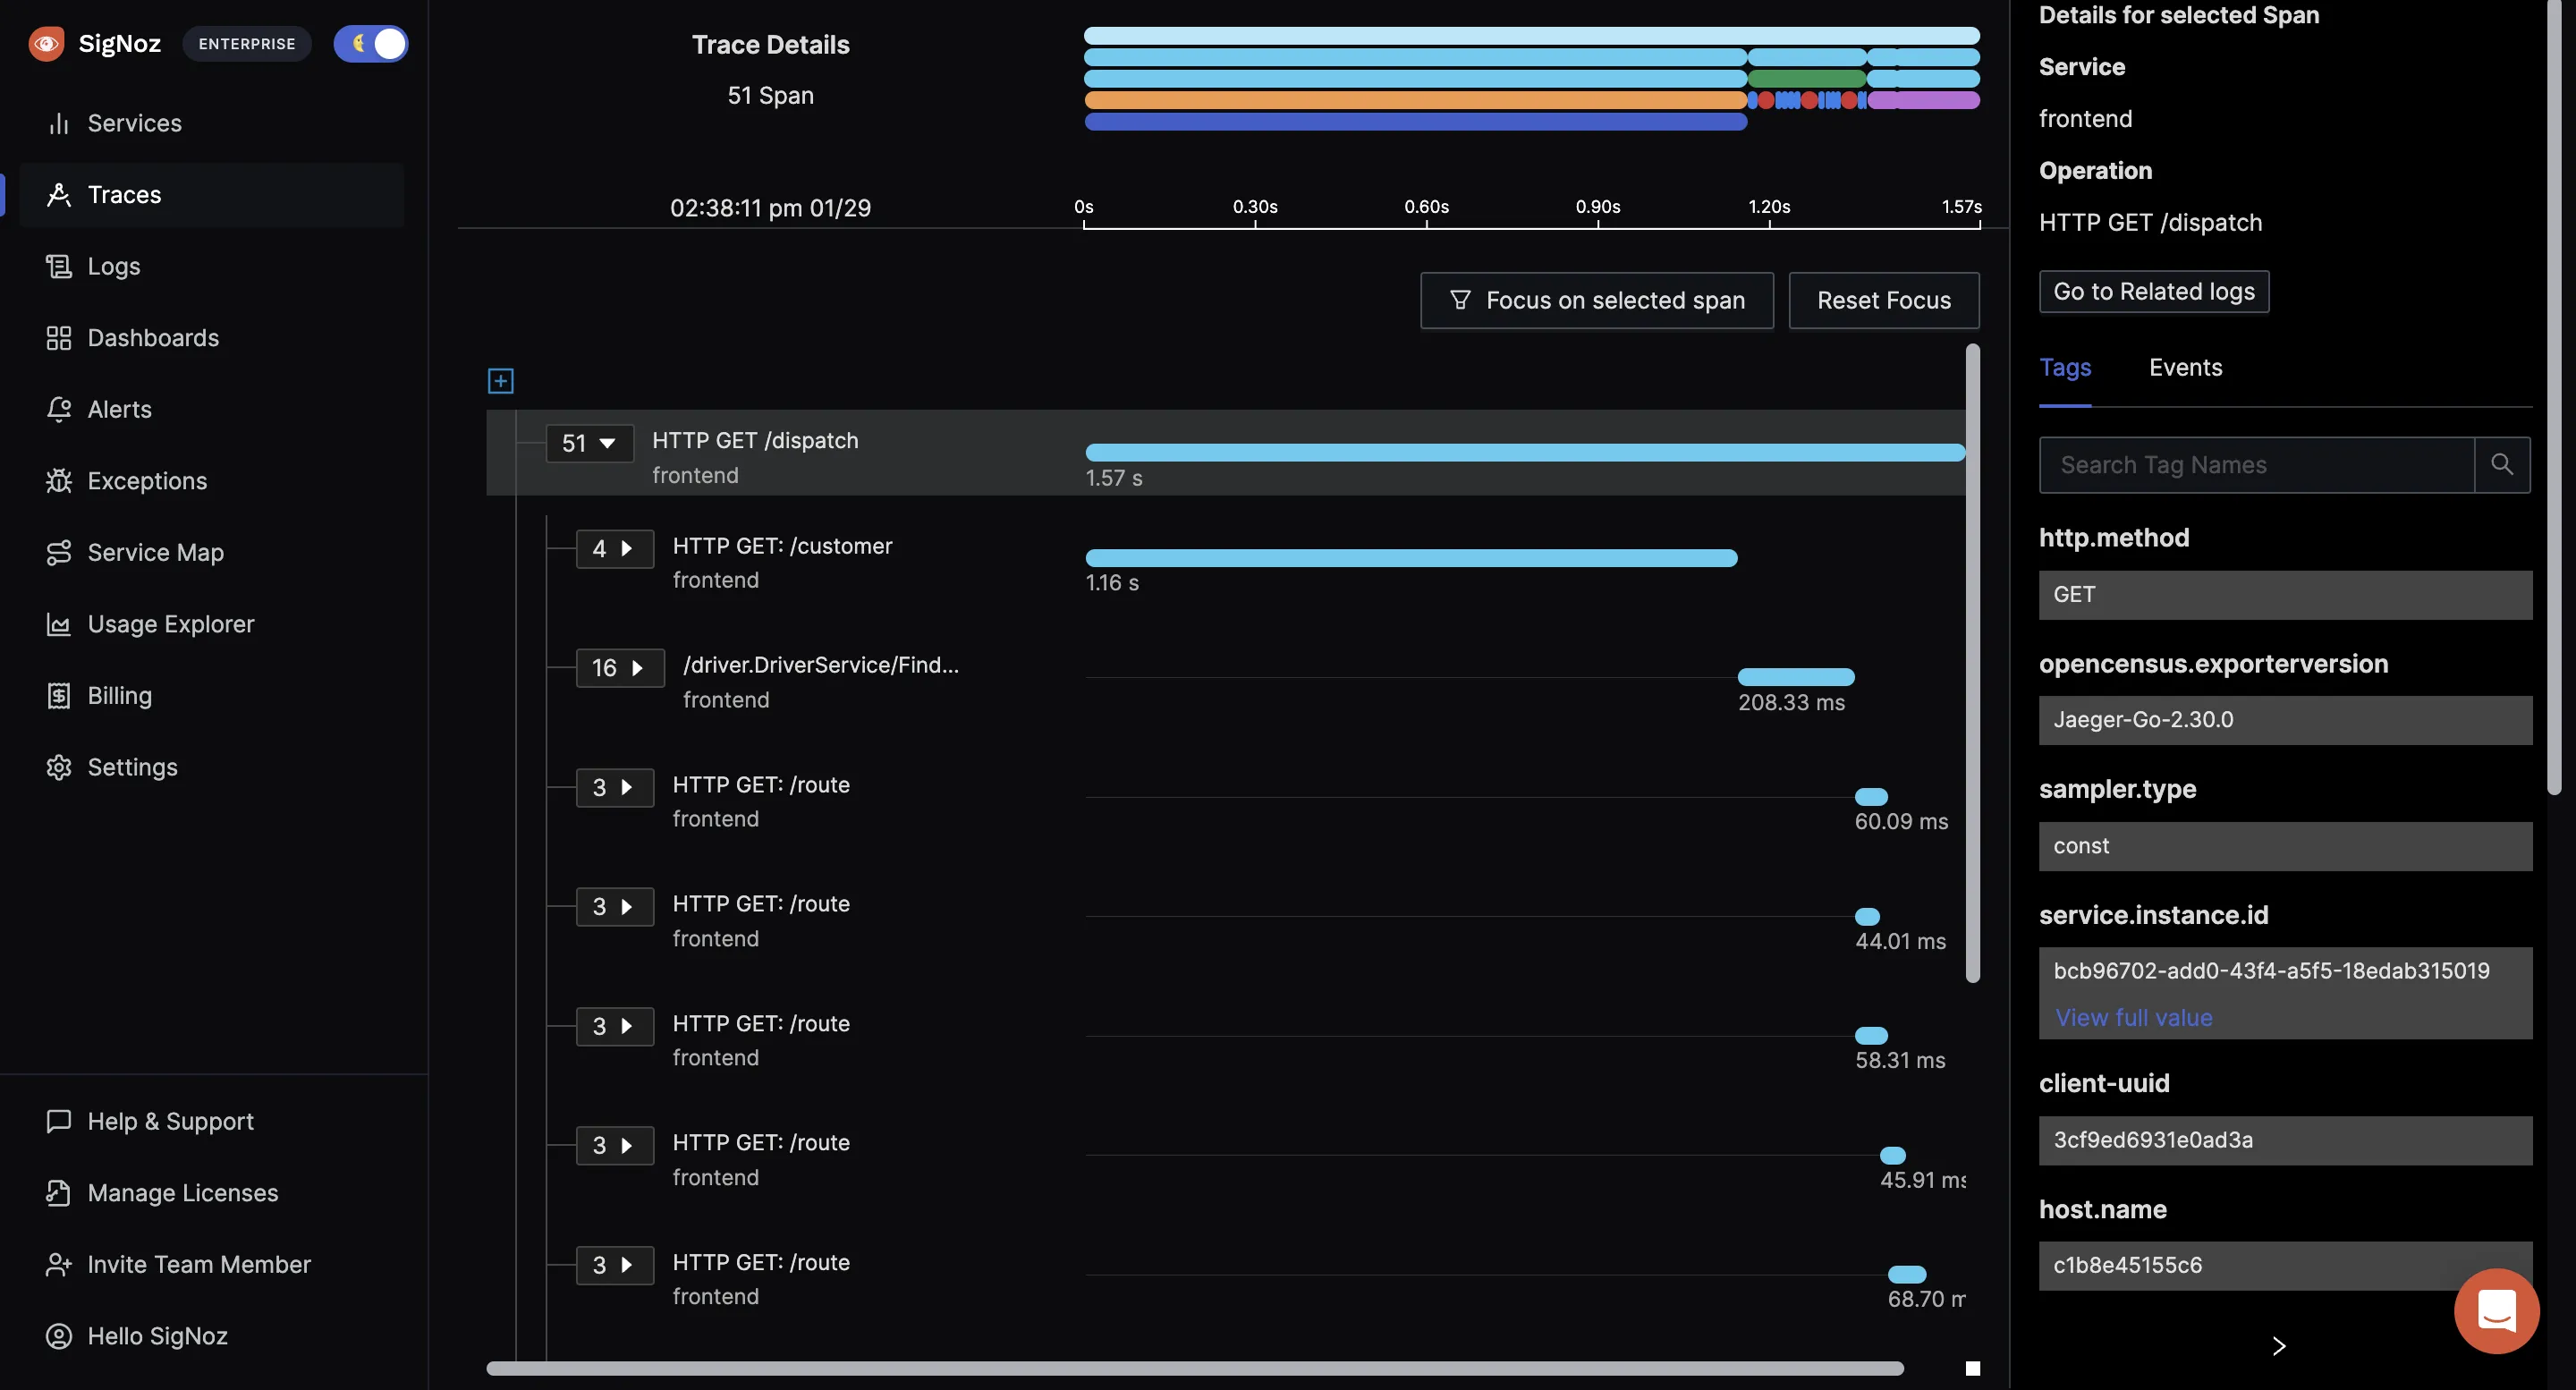
Distributed tracing with Flamegraphs and Gantt Charts
The tracing data captured with OpenTelemetry can be visualized with the help of Flamegraphs and Gantt charts. This view gives you a complete breakdown of a single user request as it travels across services and protocols.
Trace aggregates
Using SigNoz dashboards, you can run and visualize aggregated trace data collected with OpenTelemetry. Create trace aggregates visualizations helps you create service-centric views. For example, you can see the P99 latency of all your services to pinpoint the one causing performance issues.
You can also analyze the trace data using a set of powerful filters like status, operation, HTTP codes, etc. SigNoz uses OpenTelemetry semantic conventions to visualize this data.
Custom Dashboards
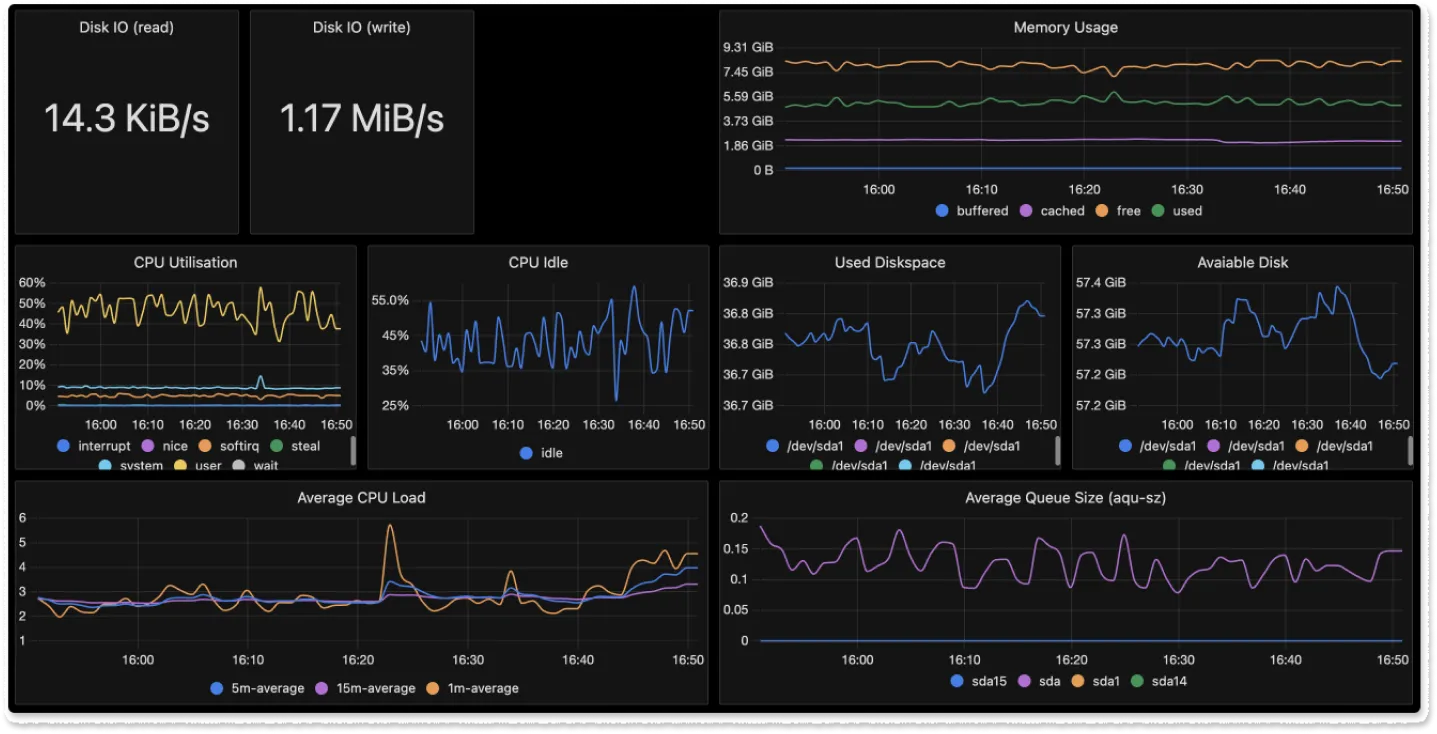
OpenTelemetry provides receivers for receiving metrics from metrics exporters of a lot of common technologies. For example, there are receivers for Redis, AWS container insights, Docker stats, etc. Using these receivers, you can build custom dashboards with SigNoz.
Getting started with OpenTelemetry visualization
To start with OpenTelemetry visualization, you first need to instrument your application code with OpenTelemetry client libraries. Opentelemetry also provides auto-instrumentation agents for some programming languages like Java. With auto-instrumentation, you can start to monitor your application with minimal code changes.
Below are the steps required to start with OpenTelemetry visualization:
- Instrument application code with language-specific OpenTelemetry libraries
- Configure OpenTelemetry Exporters to send data to SigNoz
- Visualize and analyze telemetry data using SigNoz dashboards
OpenTelemetry has language-specific instrumentation steps. You can explore our docs for specific instructions for different programming languages:
SigNoz cloud is the easiest way to run SigNoz. Sign up for a free account and get 30 days of unlimited access to all features.
You can also install and self-host SigNoz yourself since it is open-source. With 16,000+ GitHub stars, open-source SigNoz is loved by developers. Find the instructions to self-host SigNoz.


