Monitoring your Spring Boot Application using OpenTelemetry
OpenTelemetry can auto-instrument your Java Spring Boot application to capture telemetry data from a number of popular libraries and frameworks that your application might be using. It can be used to collect logs, metrics, and traces from your Spring Boot application. In this tutorial, we will integrate OpenTelemetry with a Spring Boot application for traces and logs.
OpenTelemetry is a vendor-agnostic instrumentation library that is used to generate telemetry data like logs, metrics, and traces. Using OpenTelemetry and SigNoz, you can collect logs, metrics, and traces and visualize everything under a single pane of glass.
For Java applications, OpenTelemetry provides a handy Java agent Jar that can be attached to any Java 8+ application and dynamically injects bytecode to capture telemetry from a number of popular libraries and frameworks.
In this tutorial, you will learn how to use the Java agent for generating traces and logs automatically from your Spring Boot application. You can use tracing data to visualize the flow of requests in your application. If you're using an OpenTelemetry-native APM like SigNoz, you can also get application performance metrics like request rates, latency (p99, p90, etc.), and error rates with your tracing data.
Before the demo begins, let's have a brief overview of OpenTelemetry.
What is OpenTelemetry?
OpenTelemetry is a set of API, SDKs, libraries, and integrations aiming to standardize the generation, collection, and management of telemetry data(logs, metrics, and traces). OpenTelemetry is a Cloud Native Computing Foundation project created after the merger of OpenCensus(from Google) and OpenTracing(From Uber).The data you collect with OpenTelemetry is vendor-agnostic and can be exported in many formats. Telemetry data has become critical to observe the state of distributed systems. With microservices and polyglot architectures, there was a need to have a global standard. OpenTelemetry aims to fill that space and is doing a great job at it thus far.
There are two important components in OpenTelemetry that comes in handy to collect telemetry data:
Client Libraries
For Java applications, OpenTelemetry provides a JAR agent that can be attached to any Java 8+ application. It can detect a number of popular libraries and frameworks and instrument applications right out of the box for generating telemetry data.OpenTelemetry Collector
It is a stand-alone service provided by OpenTelemetry. It can be used as a telemetry-processing system with a lot of flexible configurations to collect and manage telemetry data.
Typically, here's how an application architecture instrumented with OpenTelemetry looks like.
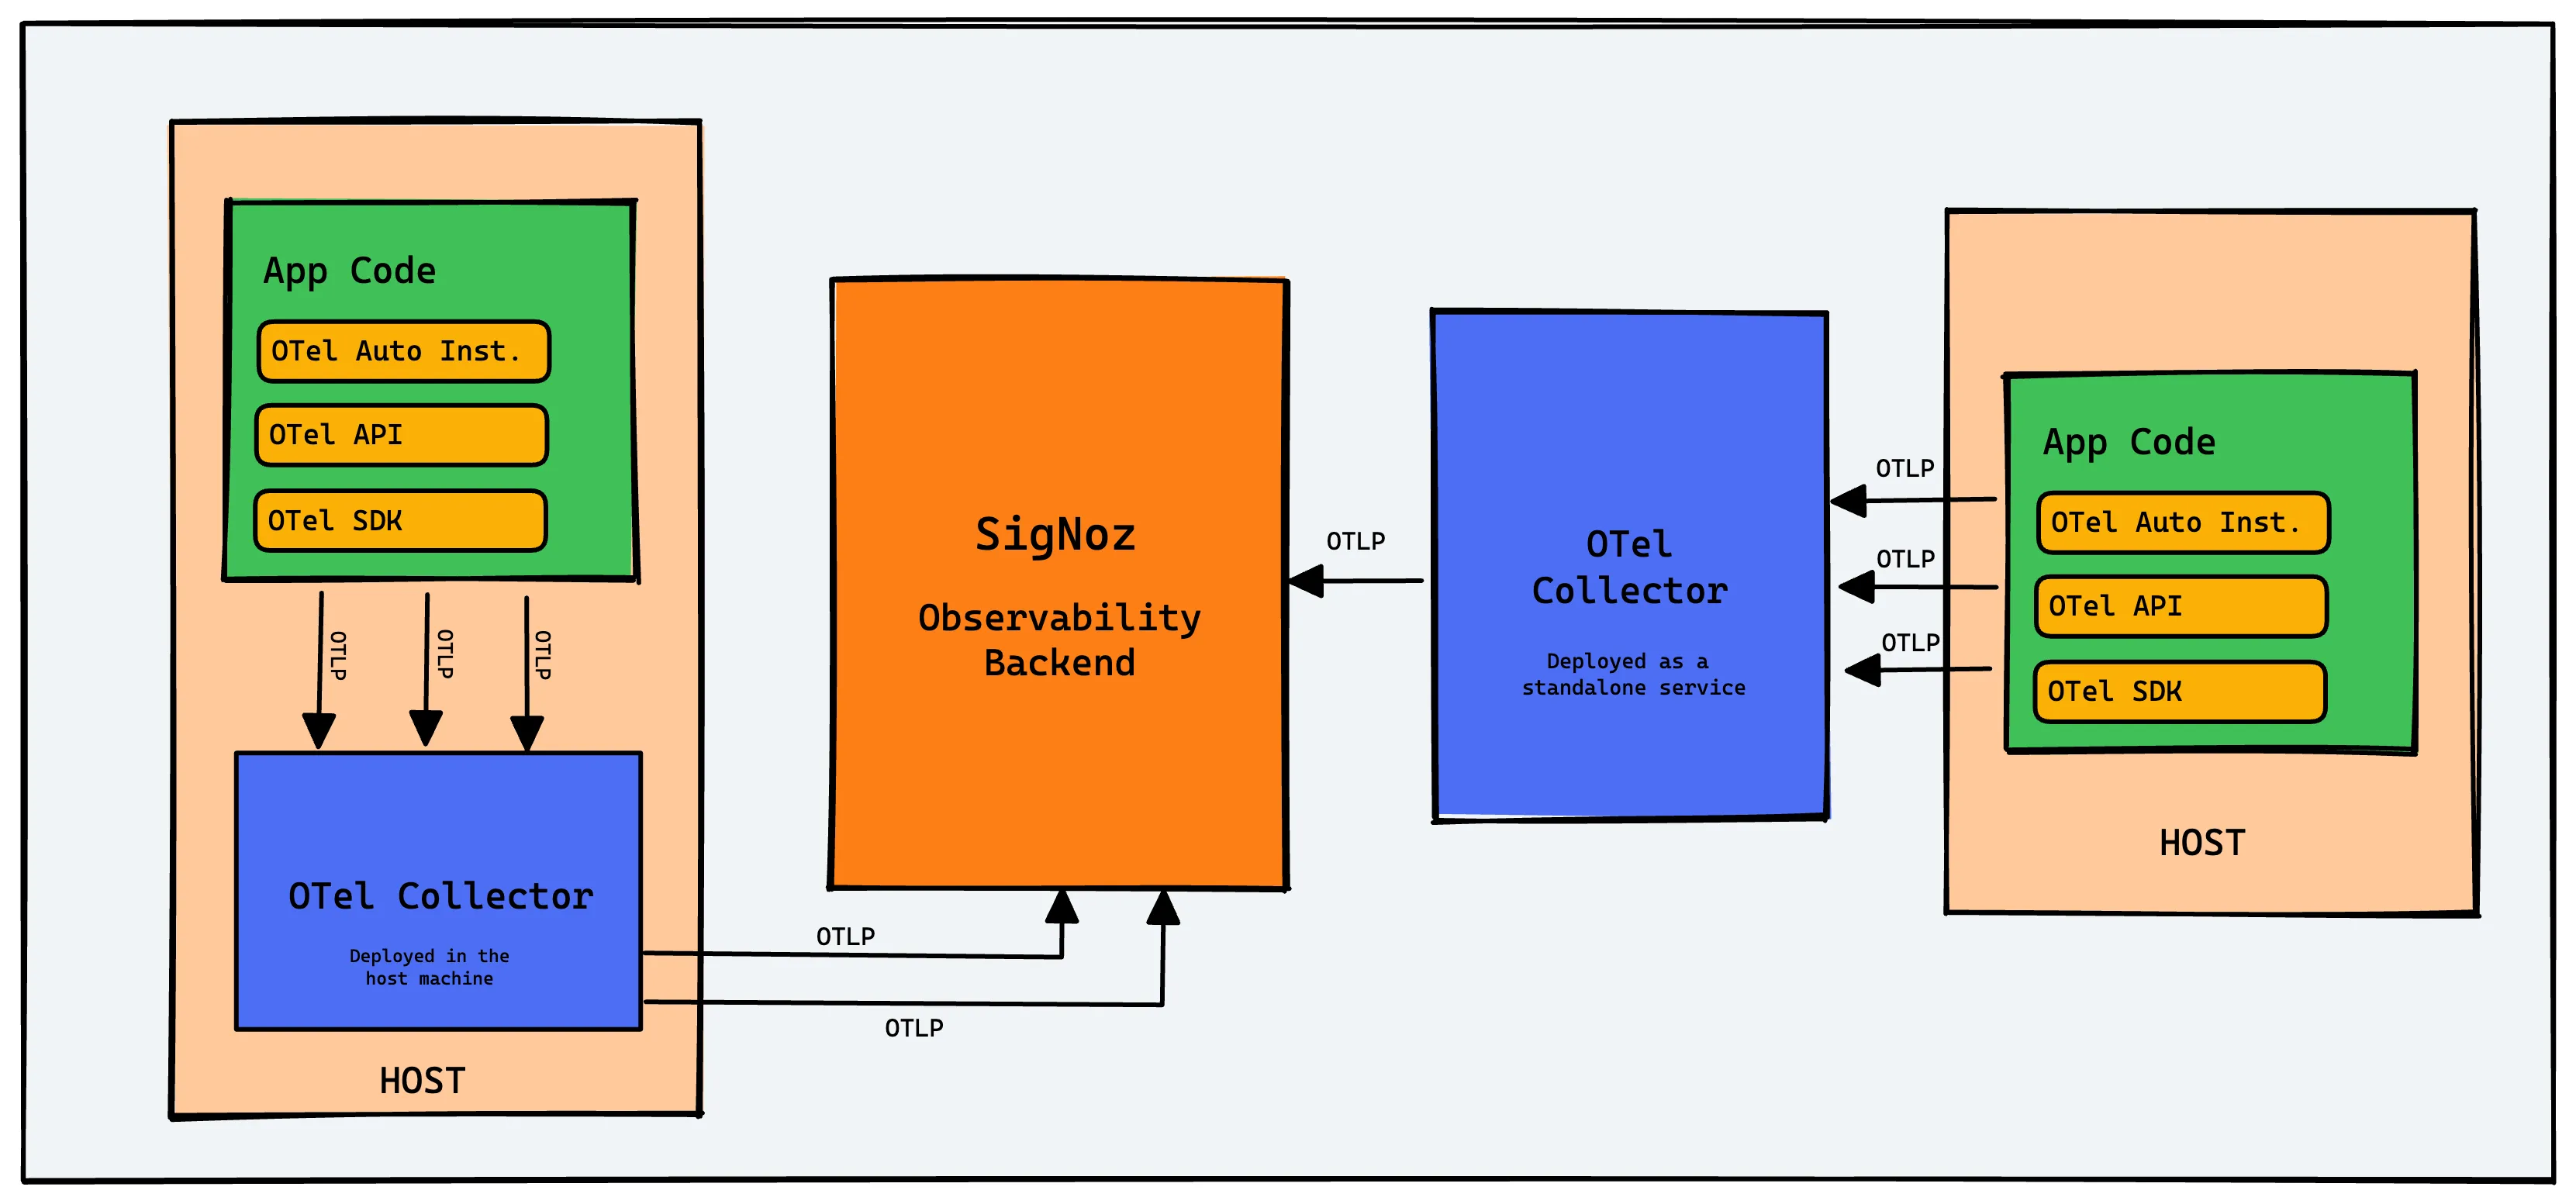
OpenTelemetry provides client libraries and agents for most of the popular programming languages. There are two types of instrumentation:
- Auto-instrumentation
OpenTelmetry can collect data for many popular frameworks and libraries automatically. You don’t have to make any code changes. - Manual instrumentation
If you want more application-specific data, OpenTelemetry SDK provides you with the capabilities to capture that data using OpenTelemetry APIs and SDKs.
For a Java Spring Boot application, we can use the OpenTelemetry Java Jar agent to instrument the application. The agent is capable of capturing telemetry data from various popular libraries and frameworks used in the application.
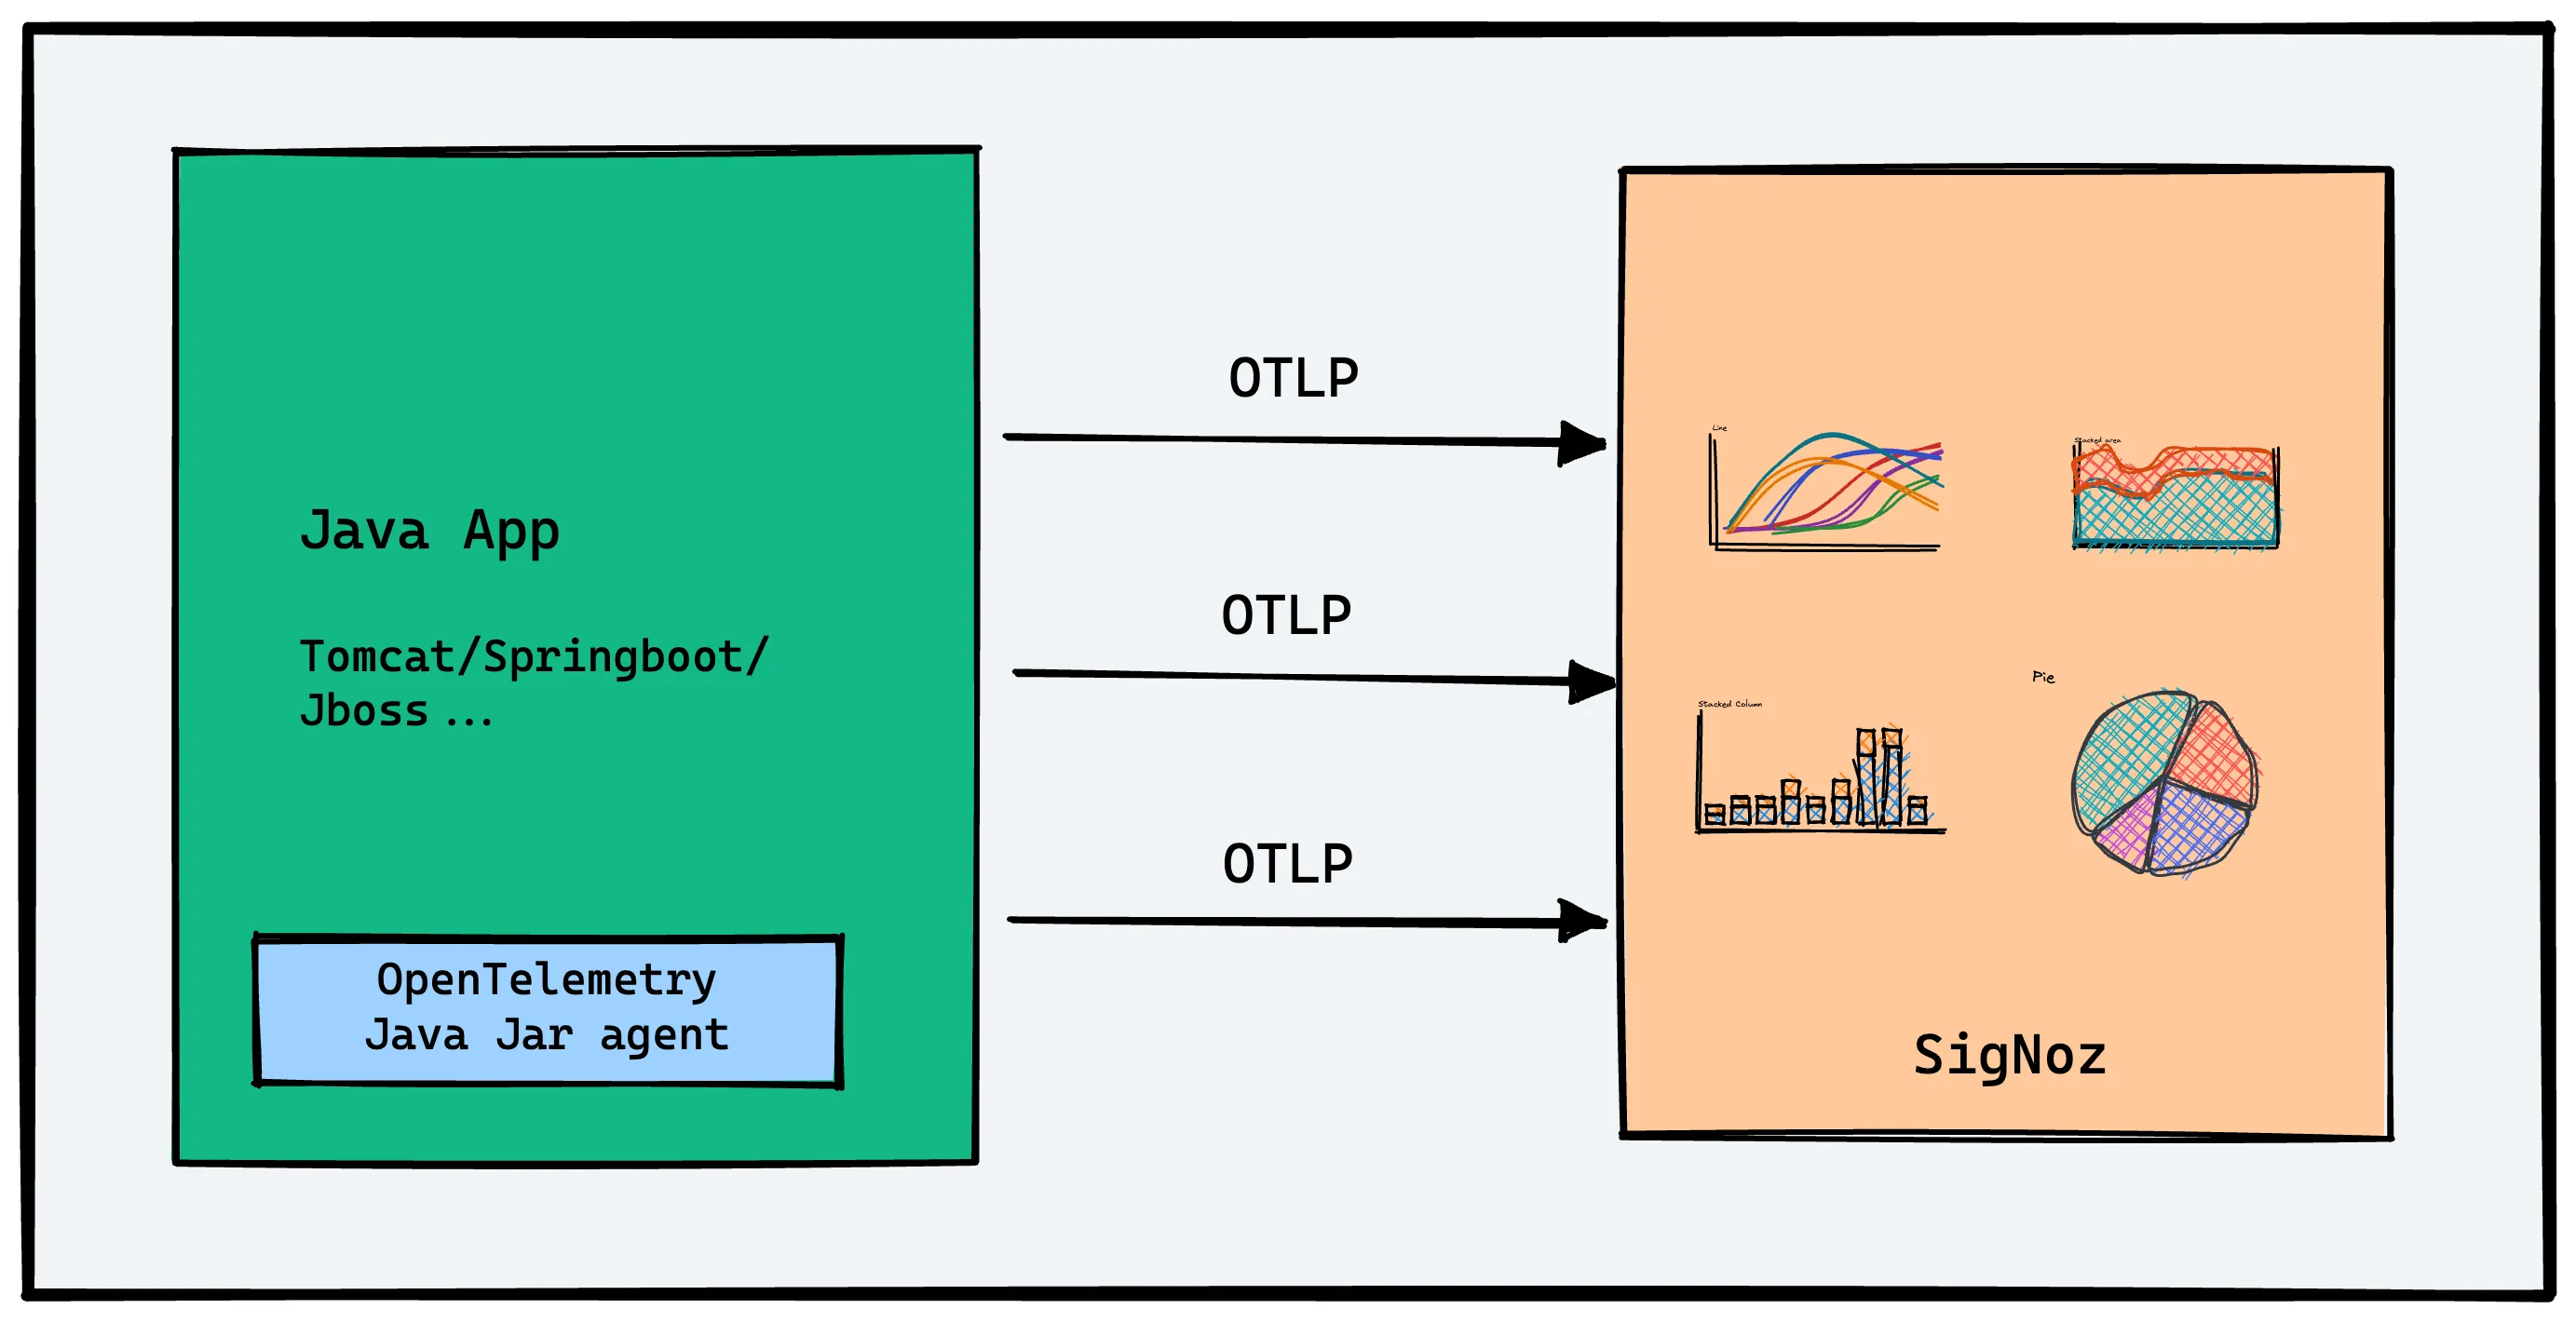
OpenTelemetry does not provide storage and visualization layer for the collected data. The advantage of using OpenTelemetry is that it can export the collected data in many different formats. So you're free to choose your telemetry backend.
In this tutorial, we will use SigNoz, an OpenTelemetry-native APM as the backend and visualization layer.
Steps to integrate OpenTelemetry with your Spring Boot application.
- Seting up SigNoz
- Setting up Sample Spring Boot Application
- Downloading OpenTelemetry Java Agent Jar
- Running the application with Java Agent Jar
- Monitoring application with SigNoz
Prerequisites
- SigNoz Cloud account
- Java 8 or Higher (Download here)
Step 1 - Setting up SigNoz
You need a backend to which you can send the collected data for monitoring and visualization. SigNoz is an OpenTelemetry-native APM that is well-suited for visualizing OpenTelemetry data.
SigNoz cloud is the easiest way to run SigNoz. You can sign up here for a free account and get 30 days of unlimited access to all features.
You can also install and self-host SigNoz yourself. Check out the docs for installing self-host SigNoz.
Step 2 - Setting up Sample Spring Boot application
For this tutorial, we will use the popular Spring PetClinic application and integrate it with OpenTelemetry.
The Spring PetClinic application is a well-known sample application used to demonstrate the capabilities of the Spring Framework in Java. It is a web application that uses Spring MVC (Model-View-Controller) to handle web requests, manage controllers, and render views. You can read more about it here.
Git clone the repository and go to the root folder:
git clone https://github.com/SigNoz/spring-petclinic.git
cd spring-petclinic
Run the application using the following commands:
./mvnw package
java -jar target/*.jar
If your application runs successfully, you will be able to access the application UI here: http://localhost:8090/
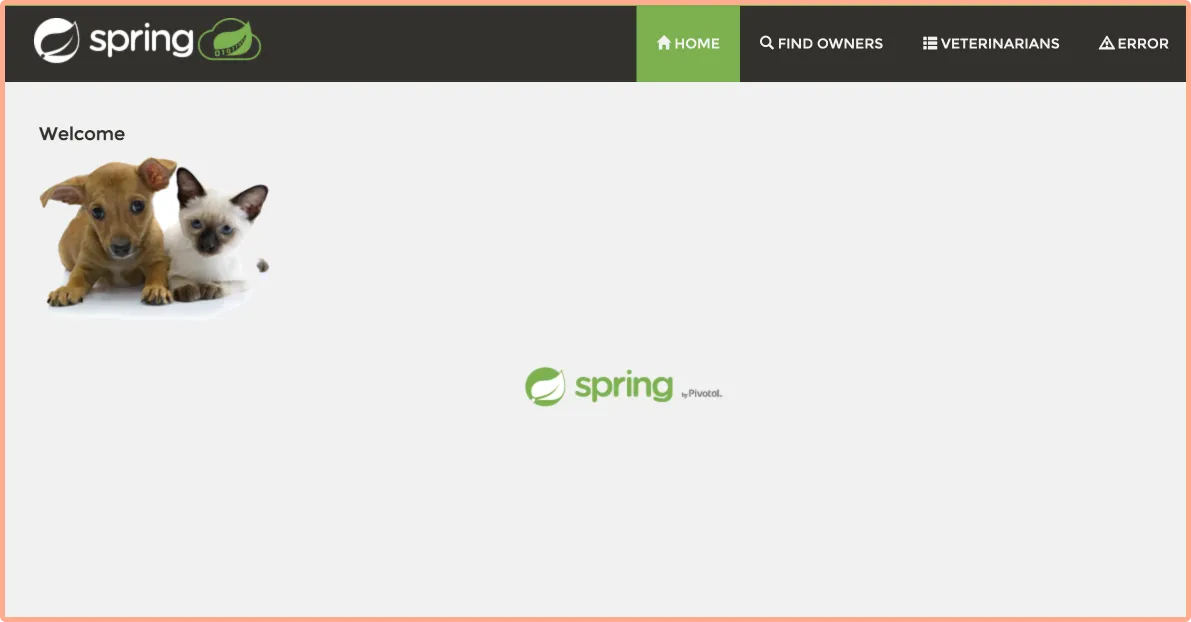
Once you ensure that your application runs fine, stop it with ctrl + c on mac, as we will be launching the application with the Java agent downloaded from OpenTelemetry.
Step 3 - Downloading OpenTelemetry Java agent JAR
Download the latest Java agent JAR. You will need the path of this file, so note it down somewhere. You can also use the terminal to get this file using the following command:
wget https://github.com/open-telemetry/opentelemetry-java-instrumentation/releases/latest/download/opentelemetry-javaagent.jar
OpenTelemetry Java agent JAR can be attached to any Java 8+ application. The agent JAR can detect a number of popular libraries and frameworks and instrument it right out of the box. You don't need to add any code for that.
The auto-instrumentation takes care of generating traces and logs from the application. SigNoz uses the trace data to report key application metrics like p99 latency, request rates, and error rates with out-of-box charts and visualization.
You will also be able to capture logs with it and send it to SigNoz.
Step 4 - Running the application with relevant environment variables
You need to run your Spring Boot application along with the instrumentation agent. You can do so by the following command:
OTEL_RESOURCE_ATTRIBUTES=service.name=<app_name> \
OTEL_EXPORTER_OTLP_HEADERS="signoz-access-token=SIGNOZ_INGESTION_KEY" \
OTEL_EXPORTER_OTLP_ENDPOINT=https://ingest.{region}.signoz.cloud:443 \
java -javaagent:java-agent/opentelemetry-javaagent.jar -jar target/*.jar
You can get SigNoz ingestion key and region from your SigNoz cloud account in Settings --> Ingestion Settings.
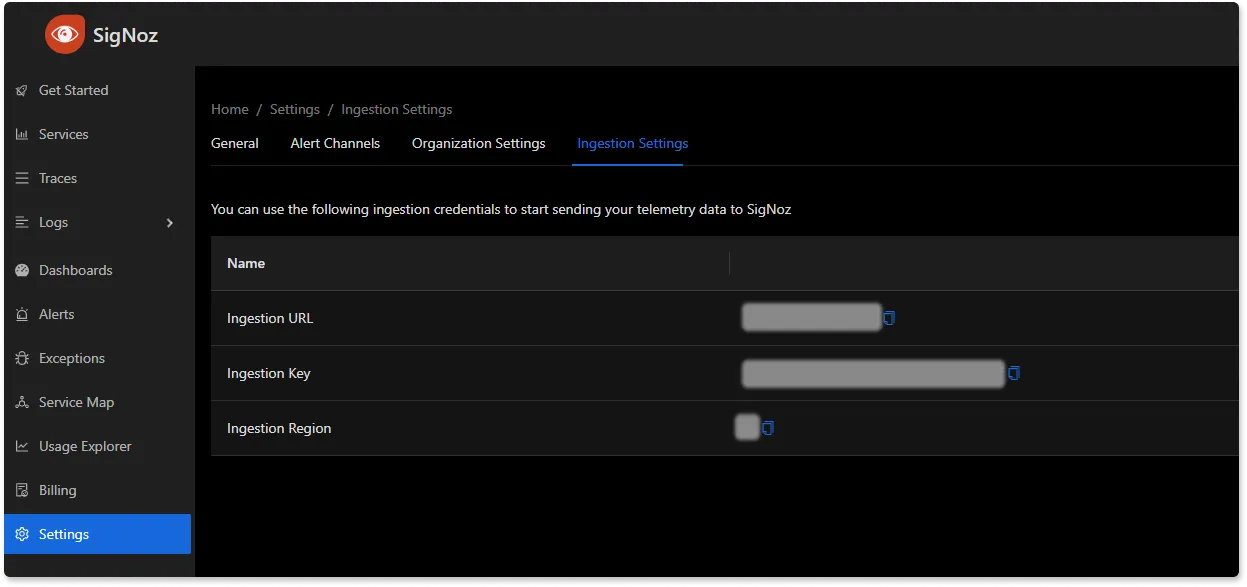
Your final command might look like this:
OTEL_RESOURCE_ATTRIBUTES=service.name=spring-boot-app \
OTEL_EXPORTER_OTLP_HEADERS="signoz-access-token=7XXXXX7-6XXxX-45ff-9XX1-3bXxXXf9cdc3" \
OTEL_EXPORTER_OTLP_ENDPOINT=https://ingest.in.signoz.cloud:443 \
java -javaagent:java-agent/opentelemetry-javaagent.jar -jar target/*.jar
Note that you would need to use the environment variables from your SigNoz cloud account.
Step 5 - Monitoring your Spring Boot Application in SigNoz
Check out the Spring Pet Clinic app at: http://localhost:8090/ and play around with it to generate some load. You can try refreshing the endpoint multiple times to generate load. Now you open the Services tab of SigNoz dashboard to see your Spring Boot Application being monitored.
When you sign up, you will get an onboarding flow for Java application. You can follow it to instrument your own Spring Boot application too.
Below you can find your Spring Boot application in the list of applications being monitored.
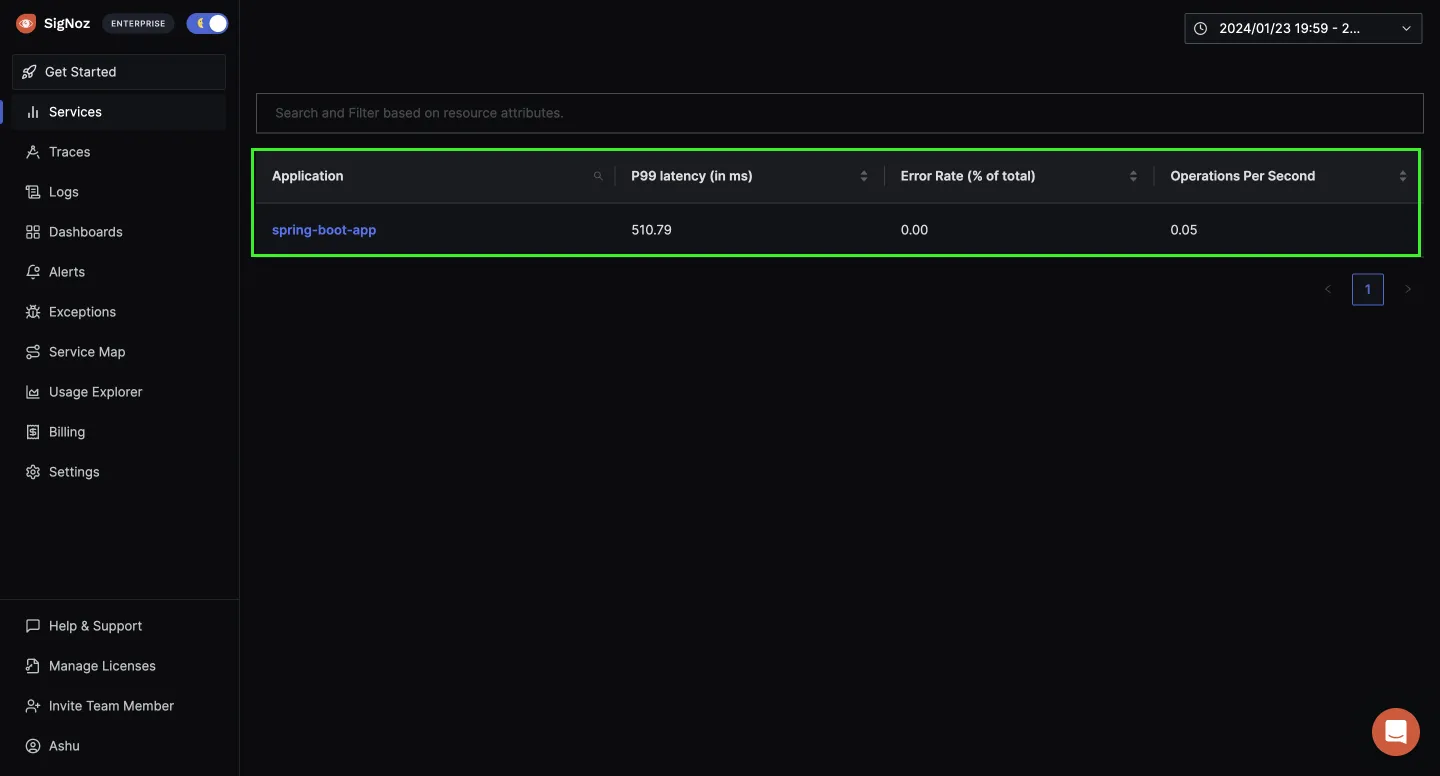
Application Metrics and Traces of the Spring Boot application
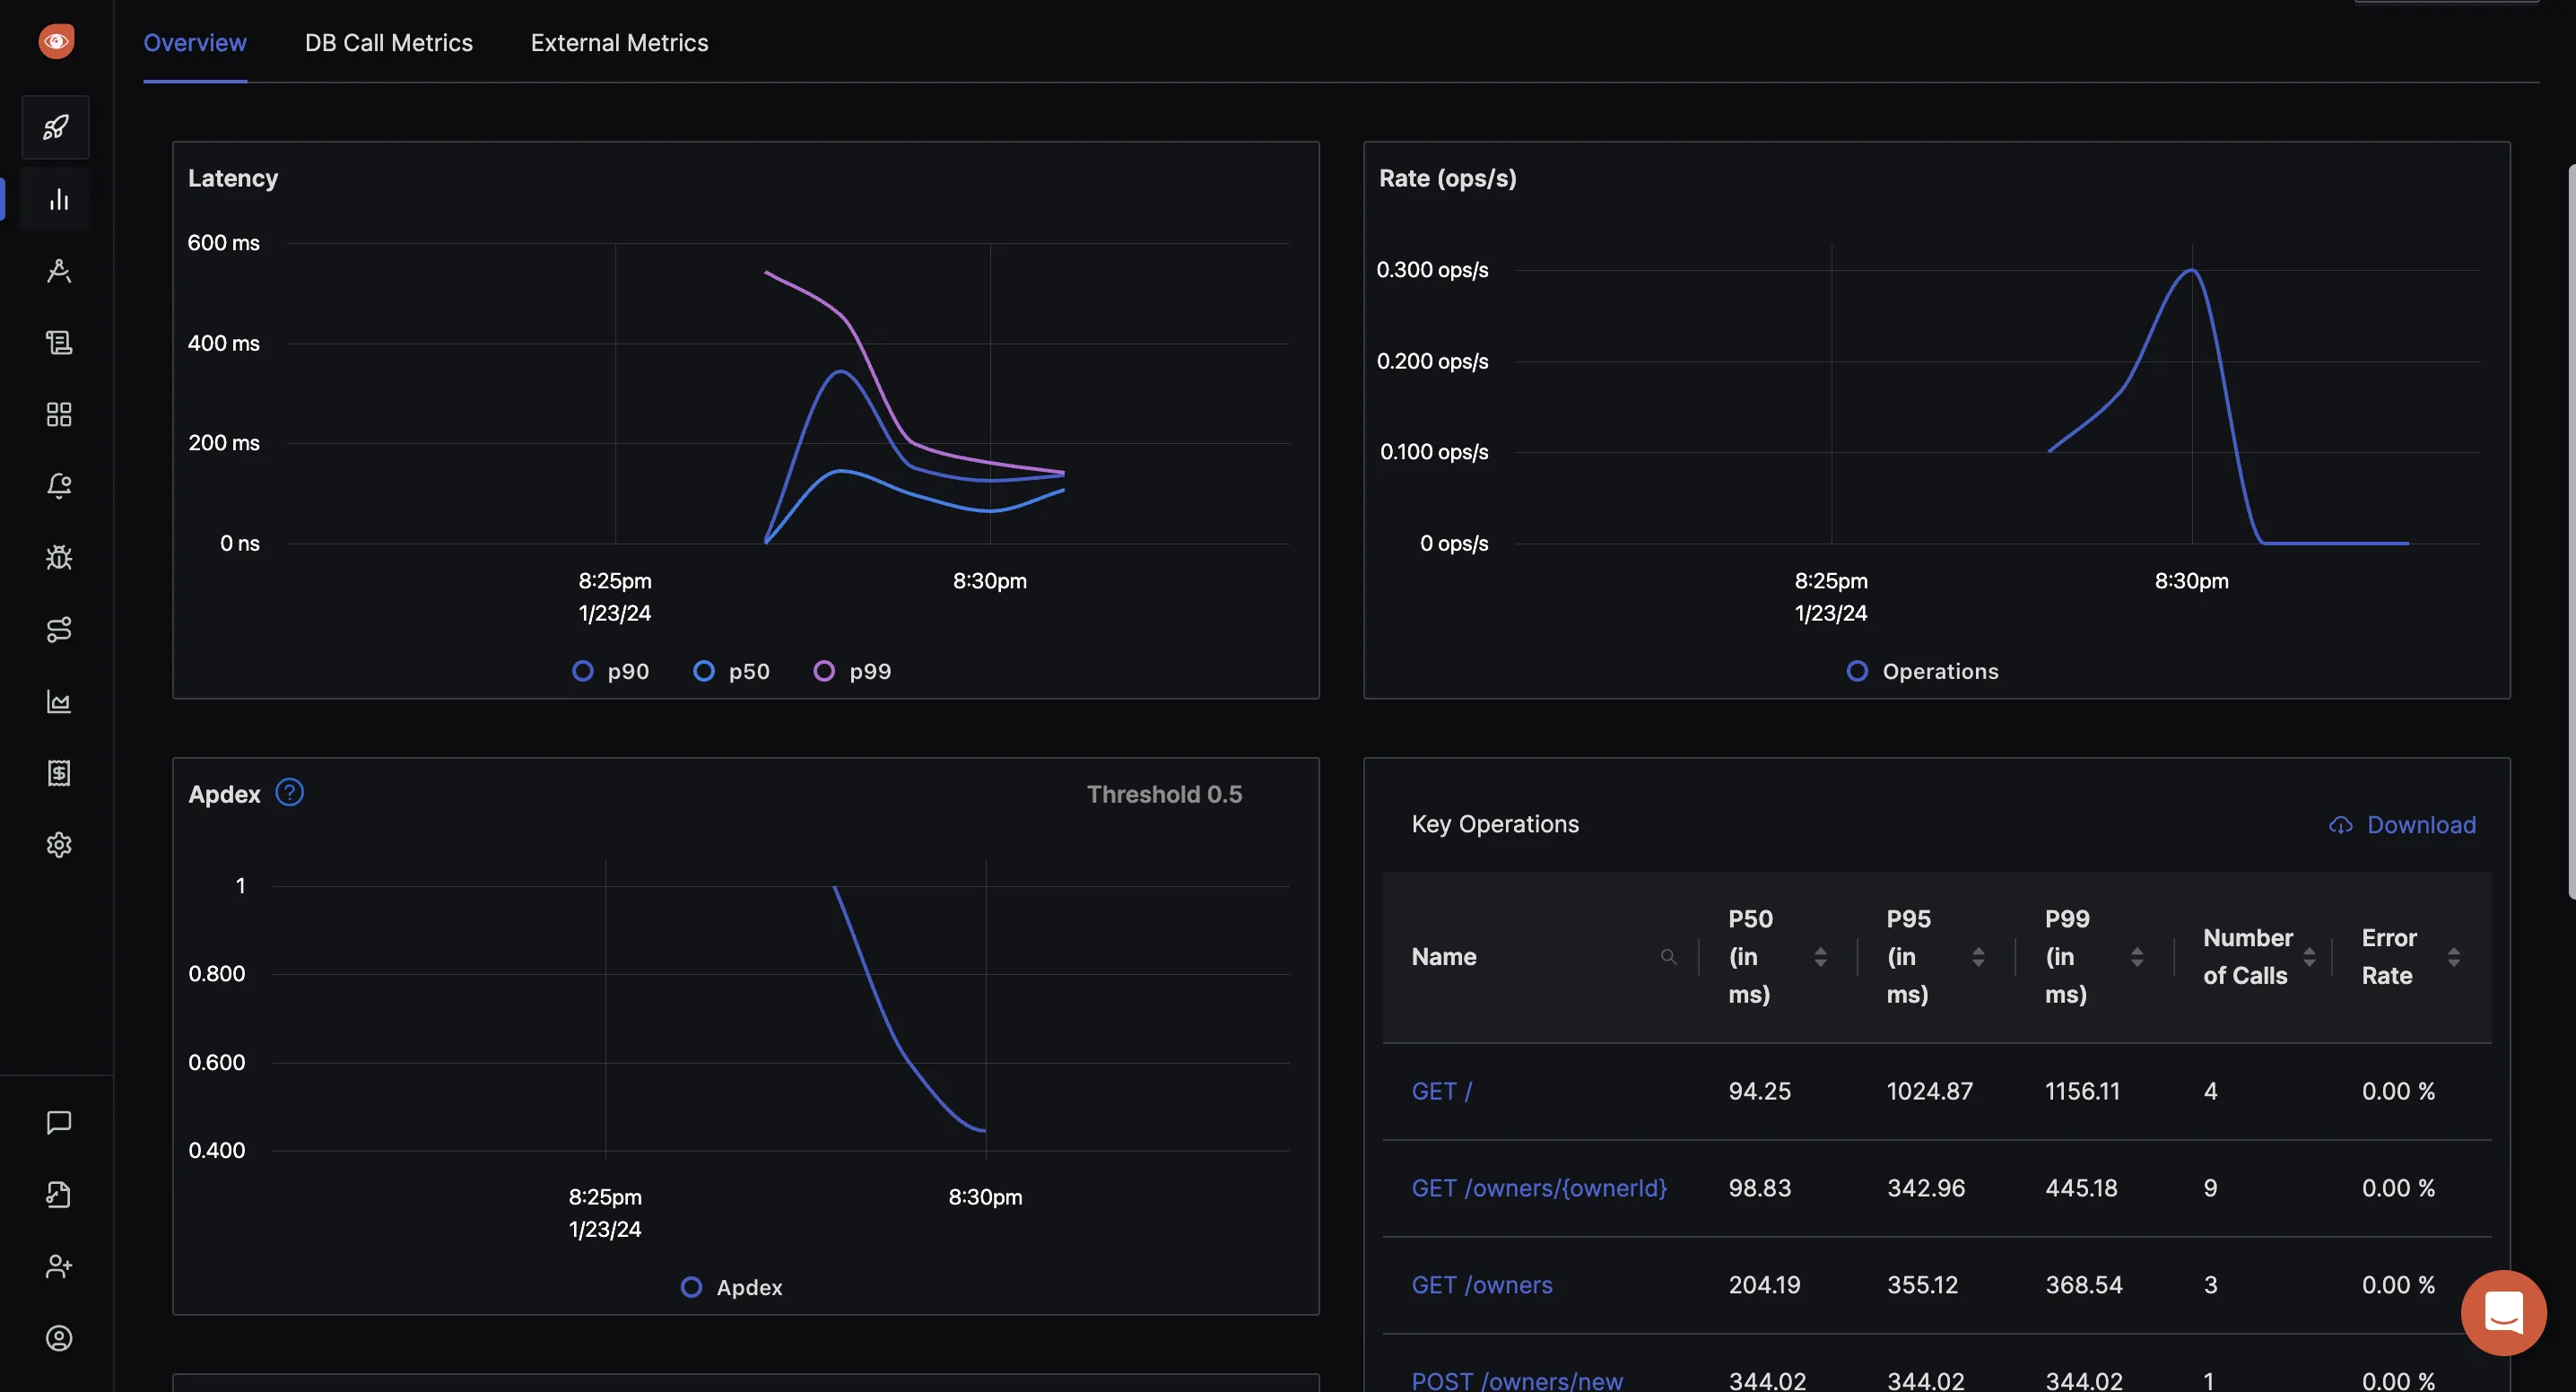
SigNoz makes it easy to visualize metrics and traces captured through OpenTelemetry instrumentation.
SigNoz comes with out of box RED metrics charts and visualization based on your trace data. You get following out-of-box charts for your Spring Boot application:
- Rate of requests
- Error rate of requests
- Duration taken by requests
- Apdex
- Top endpoints in your application
And you can monitor all of this without any code change, just by integrating your Spring Boot application with OpenTelemetry Java agent JAR.
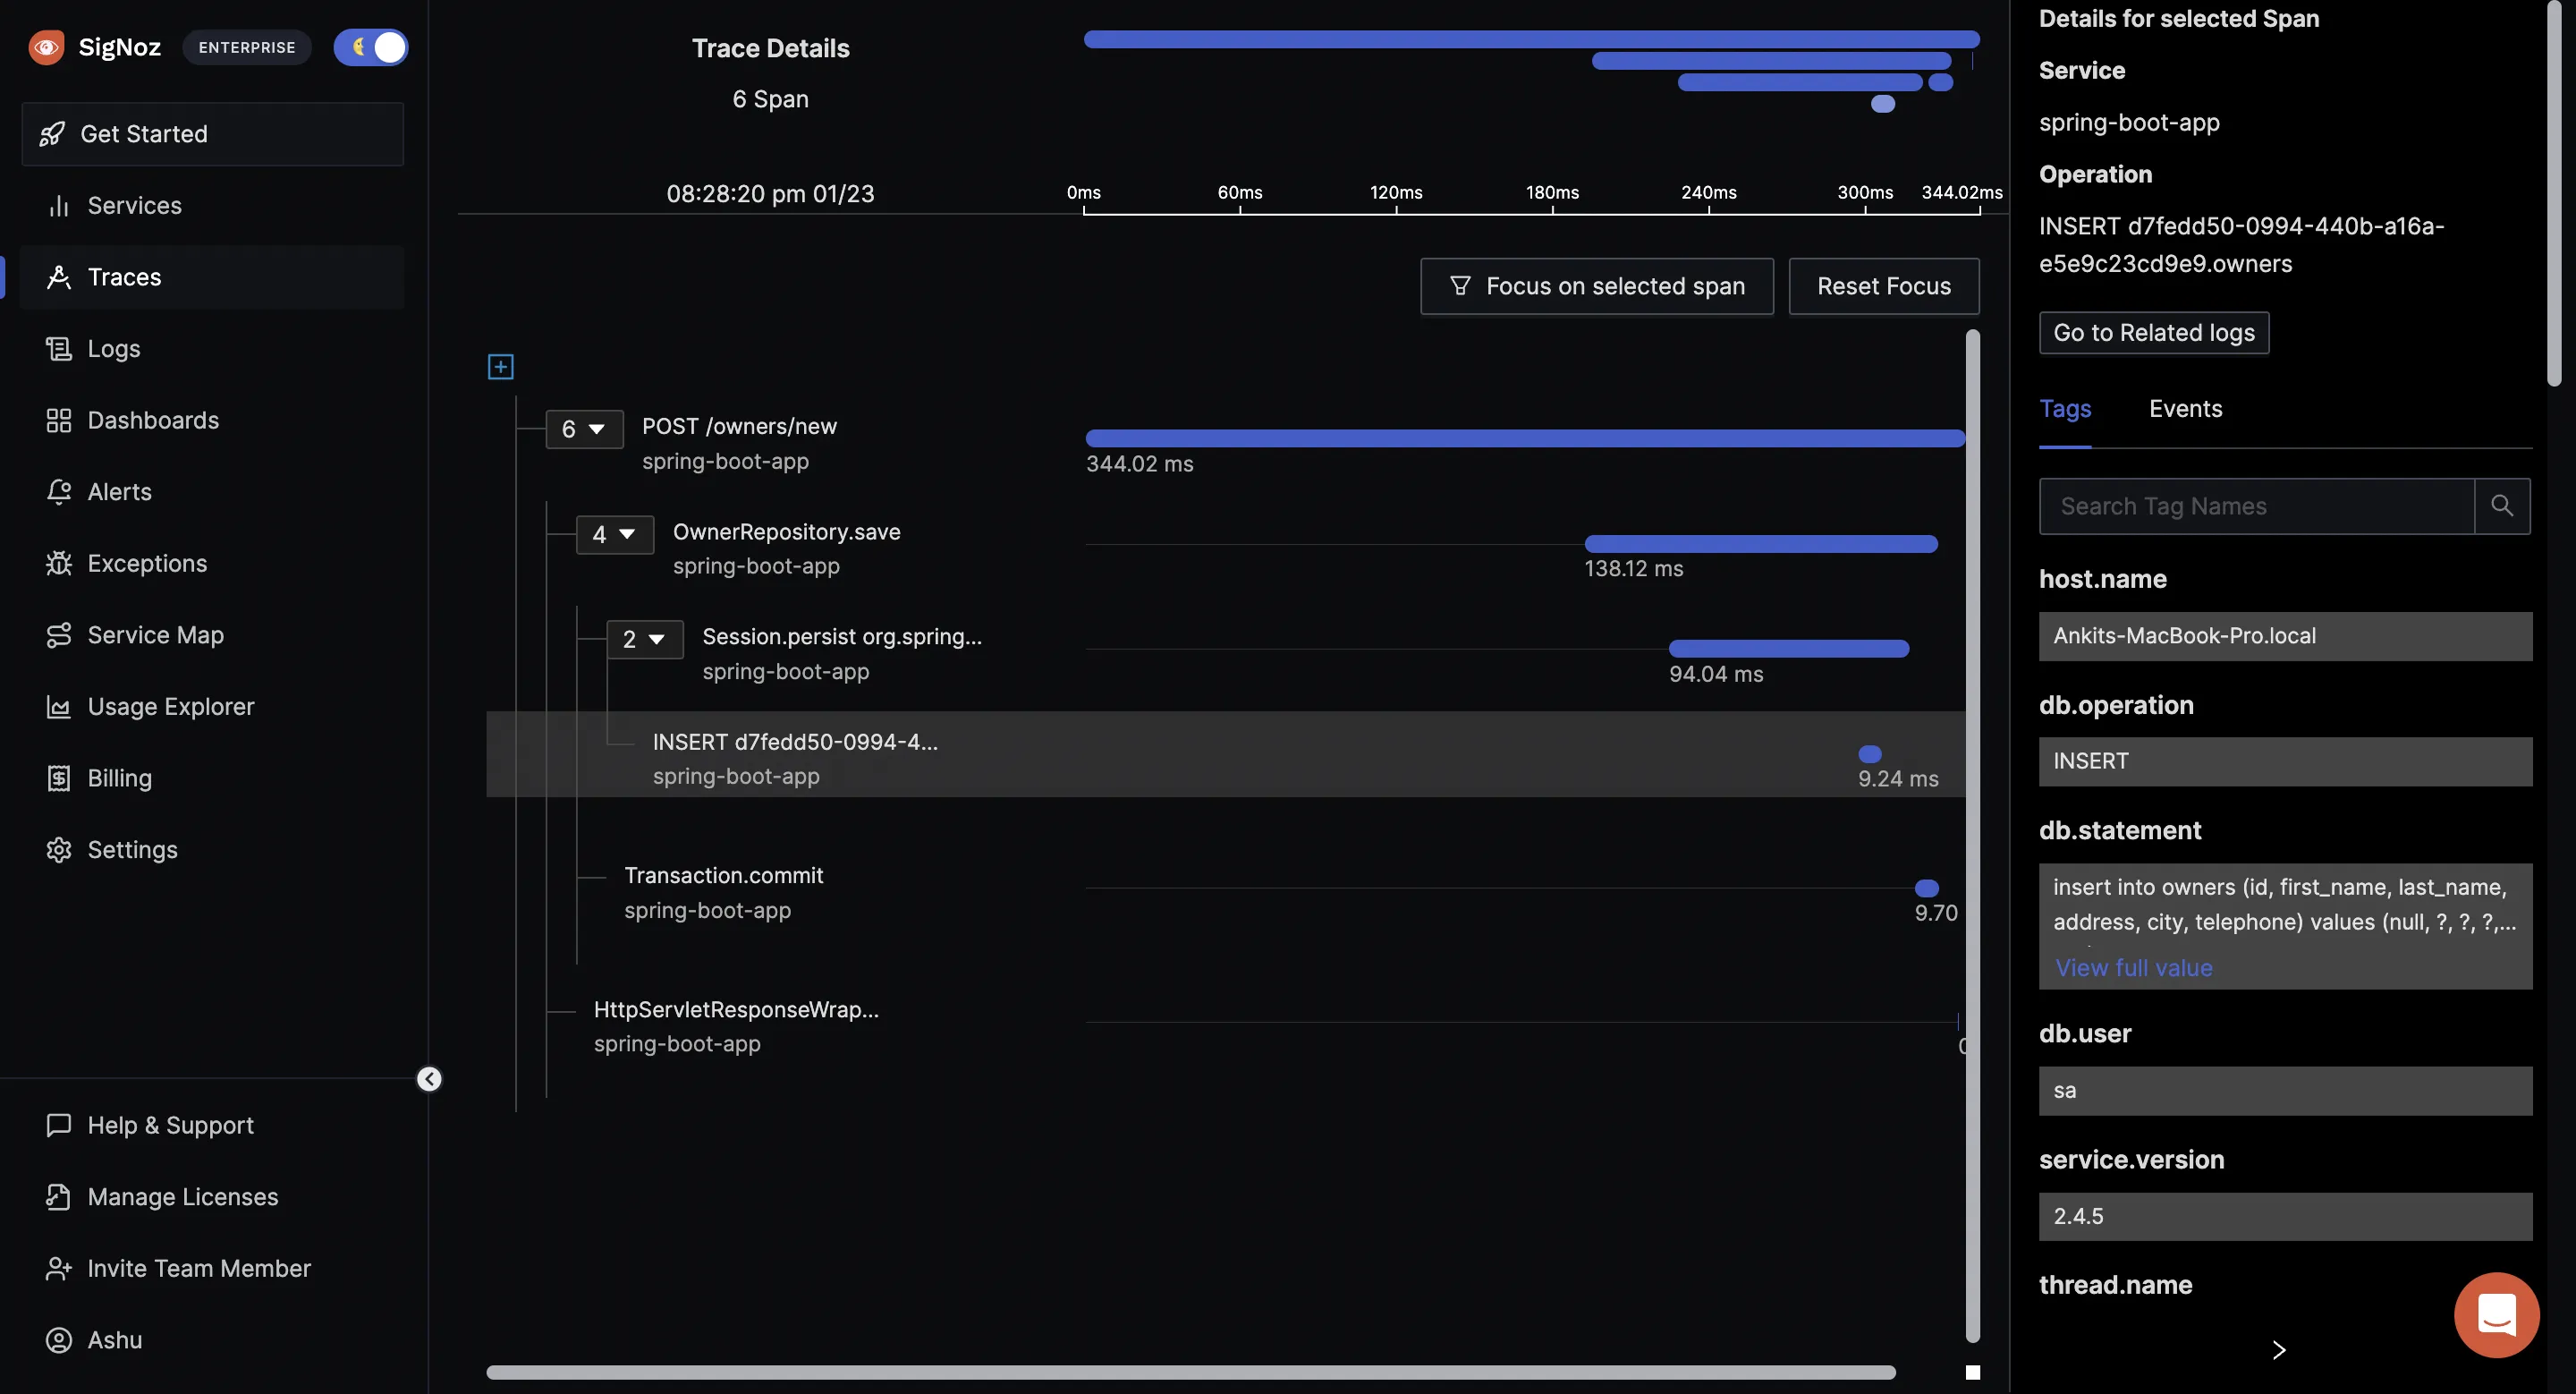
You can also visualize your trace data with flamegraphs and Gantt charts to see the flow of requests. This comes in very handy while debugging performance related issues.
Collecting Spring Boot application logs with OpenTelemetry Java agent JAR
The OpenTelemetry Java agent JAR also captures logs from Java applications. You can also configure popular Java logging libraries like Log4j2 and logback to work with OpenTelemetry Java agent JAR.
For getting logs, you need to add an environment variable OTEL_LOGS_EXPORTER to your run command. Your run command will look like below:
OTEL_LOGS_EXPORTER=otlp \
OTEL_RESOURCE_ATTRIBUTES=service.name=spring-boot-app
OTEL_EXPORTER_OTLP_HEADERS=signoz-access-token="7XXXXX7-6XXxX-45ff-9XX1-3bXxXXf9cdc3" \
OTEL_EXPORTER_OTLP_ENDPOINT=https://ingest.in.signoz.cloud:443 \
java -javaagent:java-agent/opentelemetry-javaagent.jar -jar target/*.jar
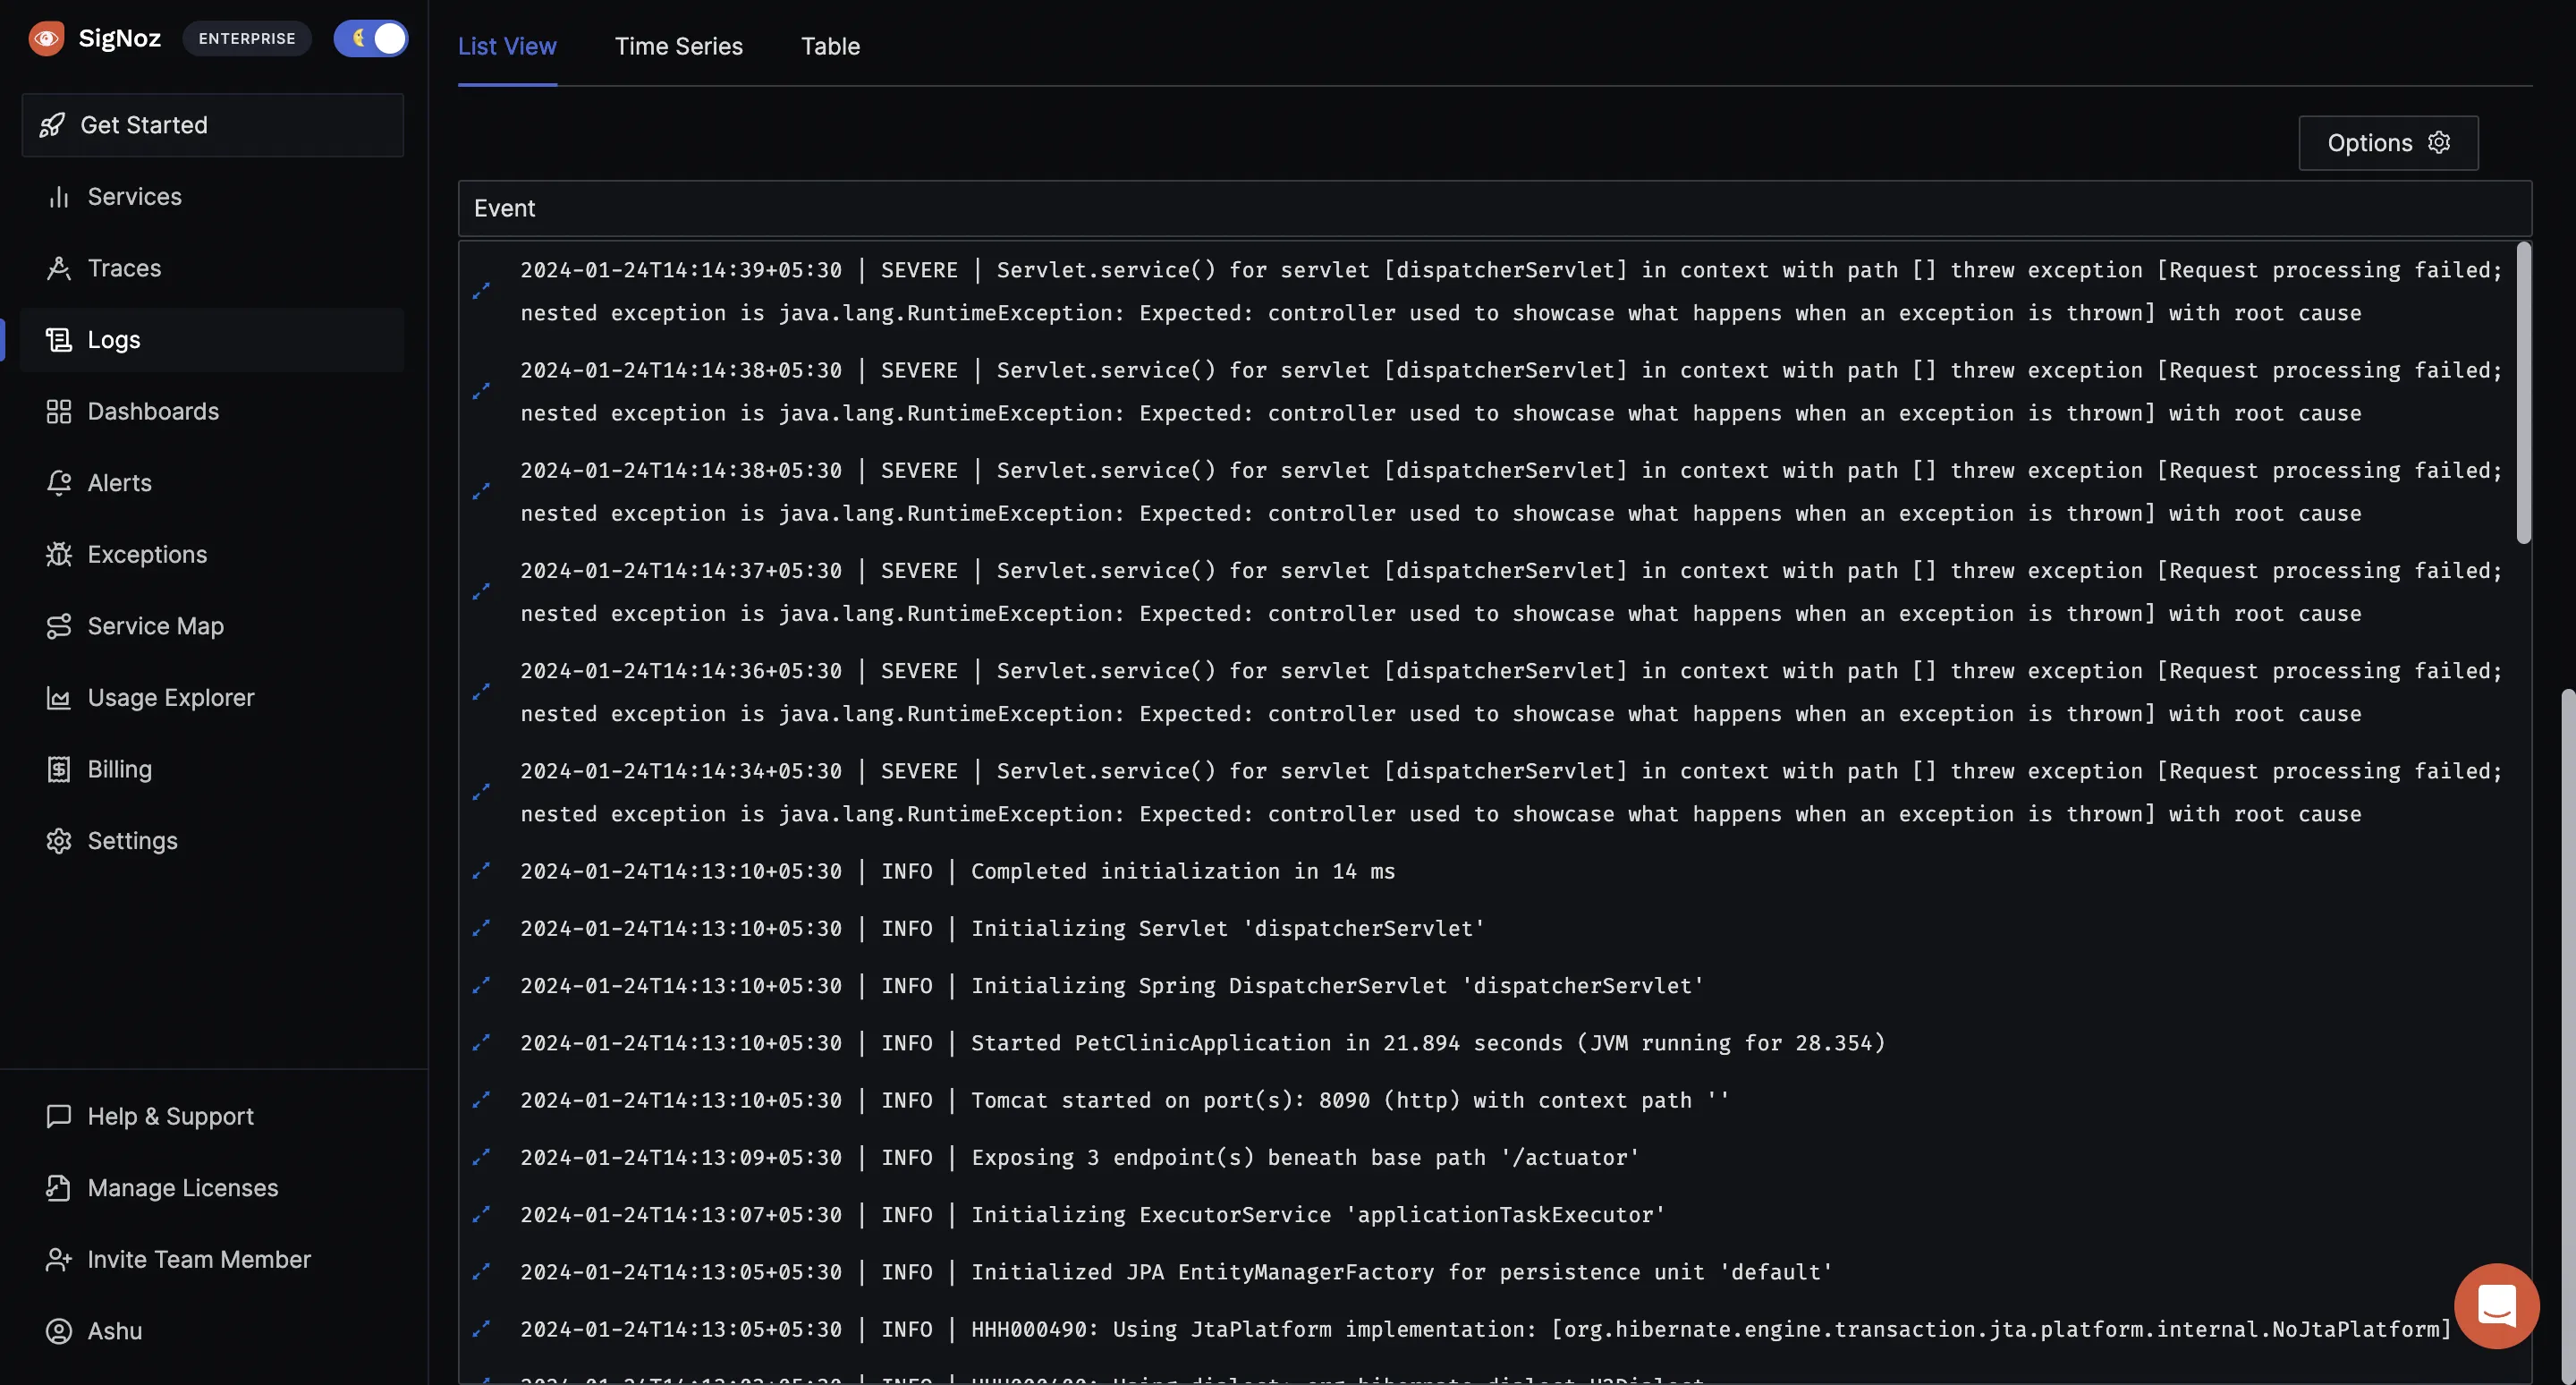
You can go to the logs tab of SigNoz and apply filter for your service.name to see logs from your Spring Boot application.
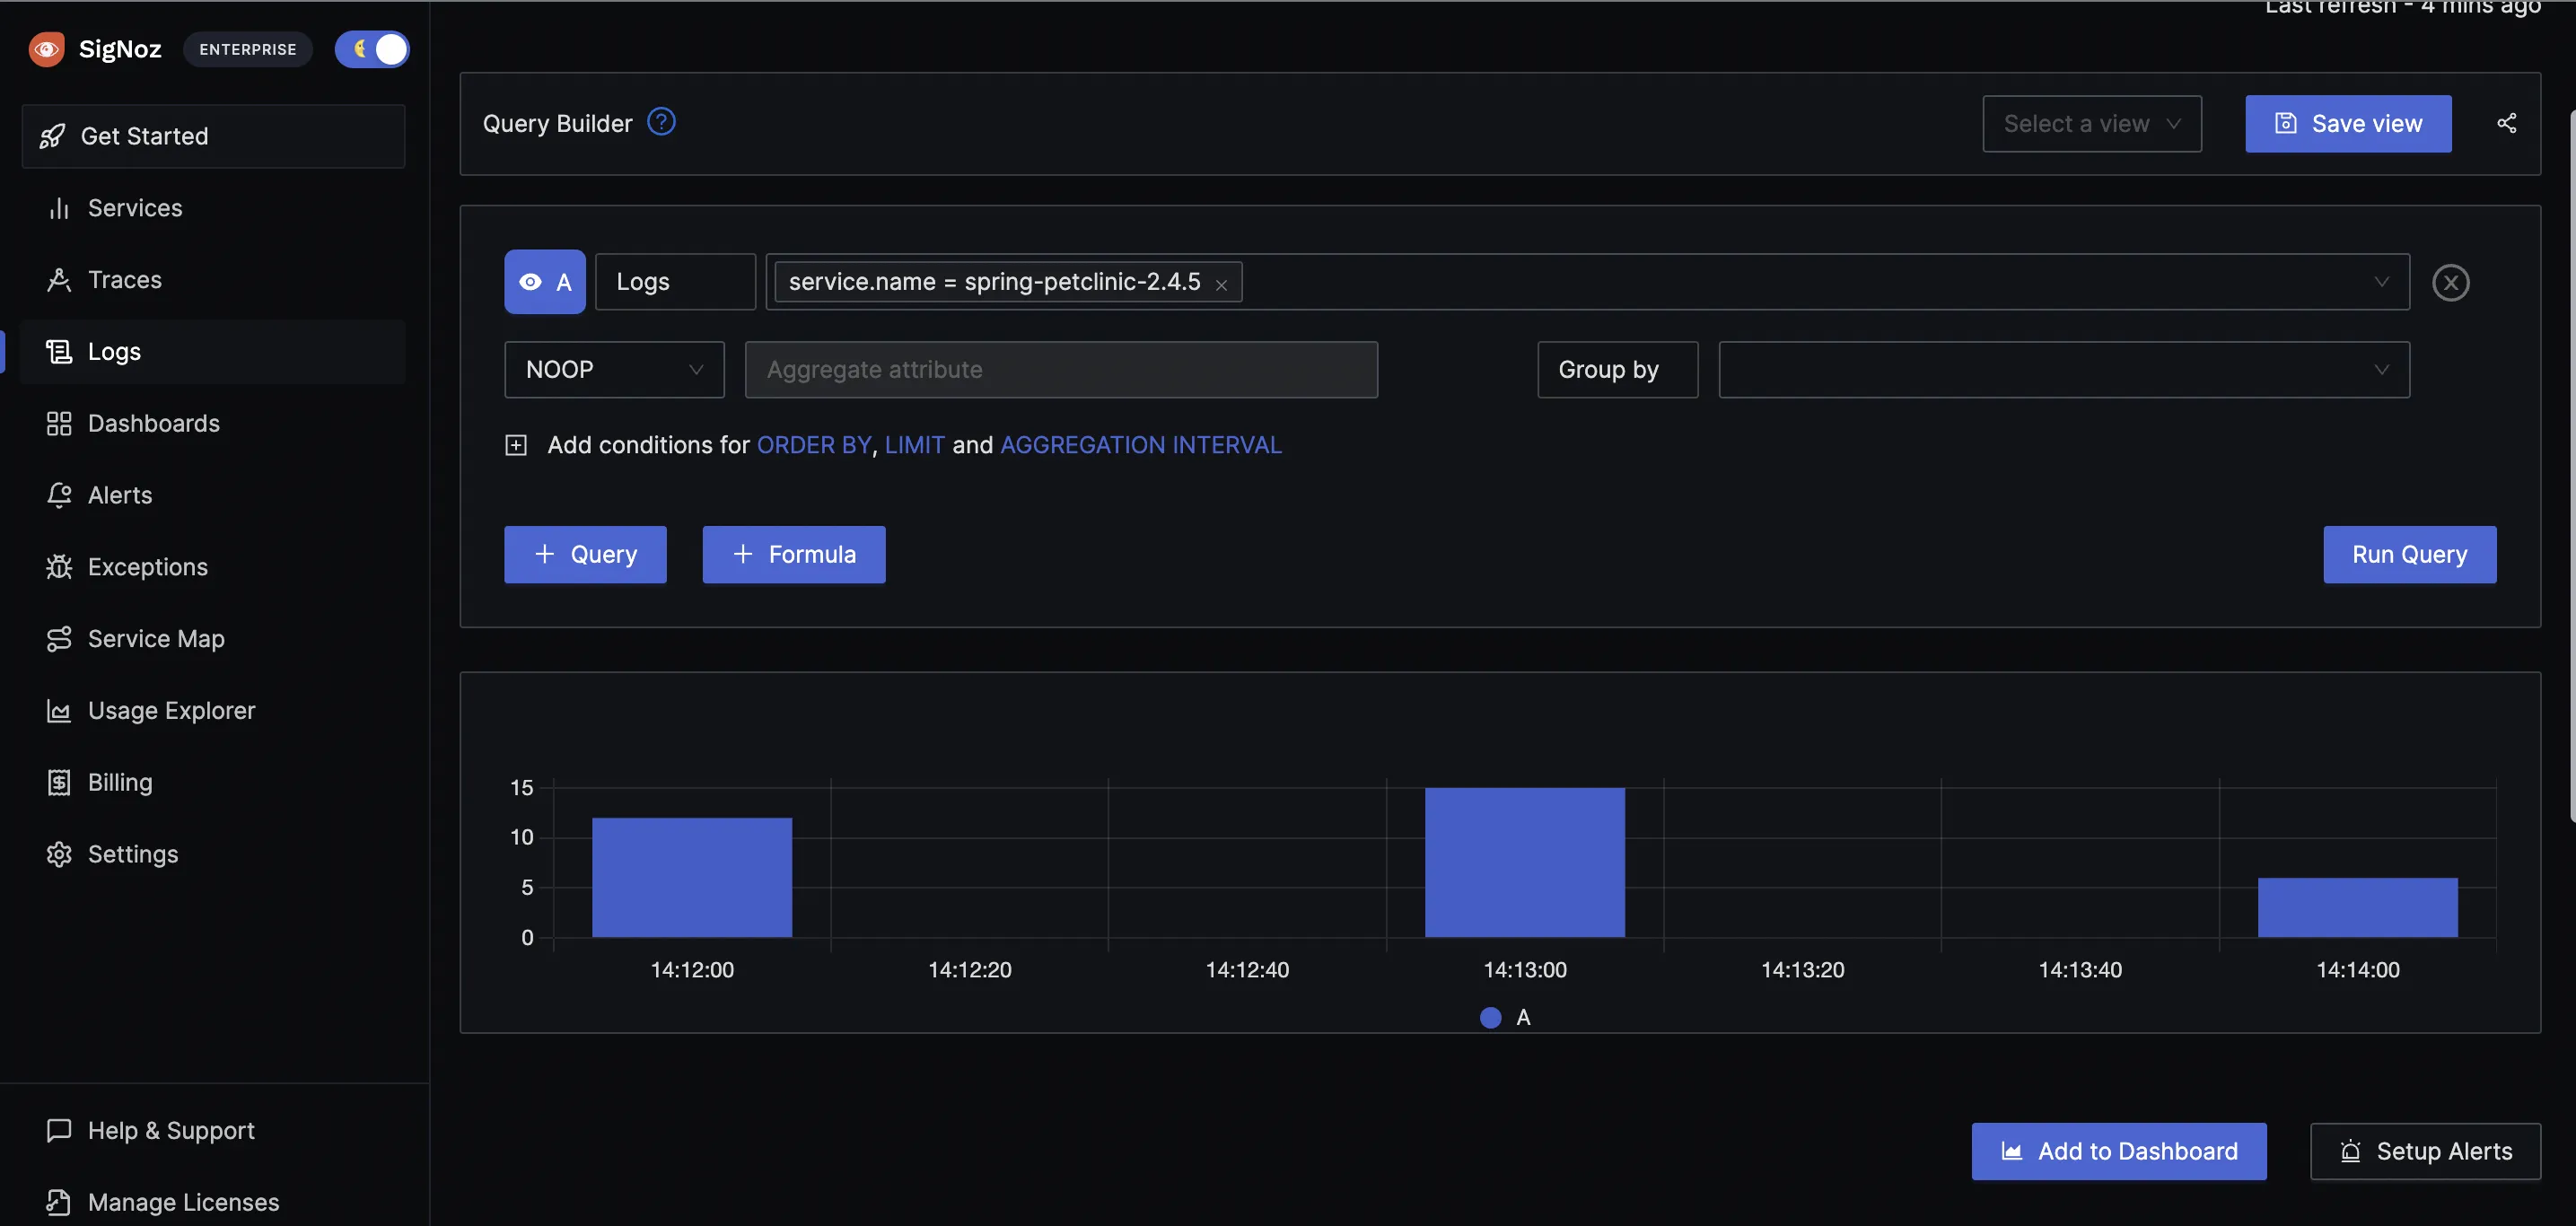
You can see your logs in different compact veiws like raw, default, and column. You can also plot time-series and create alerts on it. SigNoz logs query builder is really powerful with fields for filter, group by, and aggregate options.
Conclusion
OpenTelemetry makes it very convenient to instrument your Spring Boot application and collect telemetry data like logs, metrics, and traces. You can then use an open-source APM tool like SigNoz to analyze the performance of your app. With OpenTelemetry and SigNoz, you can implement full-stack observability for your Spring Boot applications.
If your Spring Boot application is based on microservices architecture, check out this tutorial 👇
Implementing Distributed Tracing in a Java application
Further Reading


