Implementing OpenTelemetry in a Rust application for performance monitoring
OpenTelemetry can be used to trace Rust applications for performance issues and bugs. OpenTelemetry is an open-source project under the Cloud Native Computing Foundation (CNCF) that aims to standardize the generation and collection of telemetry data. Telemetry data includes logs, metrics, and traces.
Rust is a multi-paradigm, general-purpose programming language designed for performance and safety, especially safe concurrency. In this tutorial, we will demonstrate how to use the OpenTelemetry to generate end-to-end tracing.
Before we demonstrate how to implement the OpenTelemetry libraries, let’s have a brief overview of OpenTelemetry.
What is OpenTelemetry?
OpenTelemetry is an open-source vendor-agnostic set of tools, APIs, and SDKs used to [instrument applications](https://signoz.io/docs/instrumentation/) to create and manage telemetry data(logs, metrics, and traces). It aims to make telemetry data(logs, metrics, and traces) a built-in feature of cloud-native software applications.The telemetry data is then sent to an observability tool for storage and visualization.
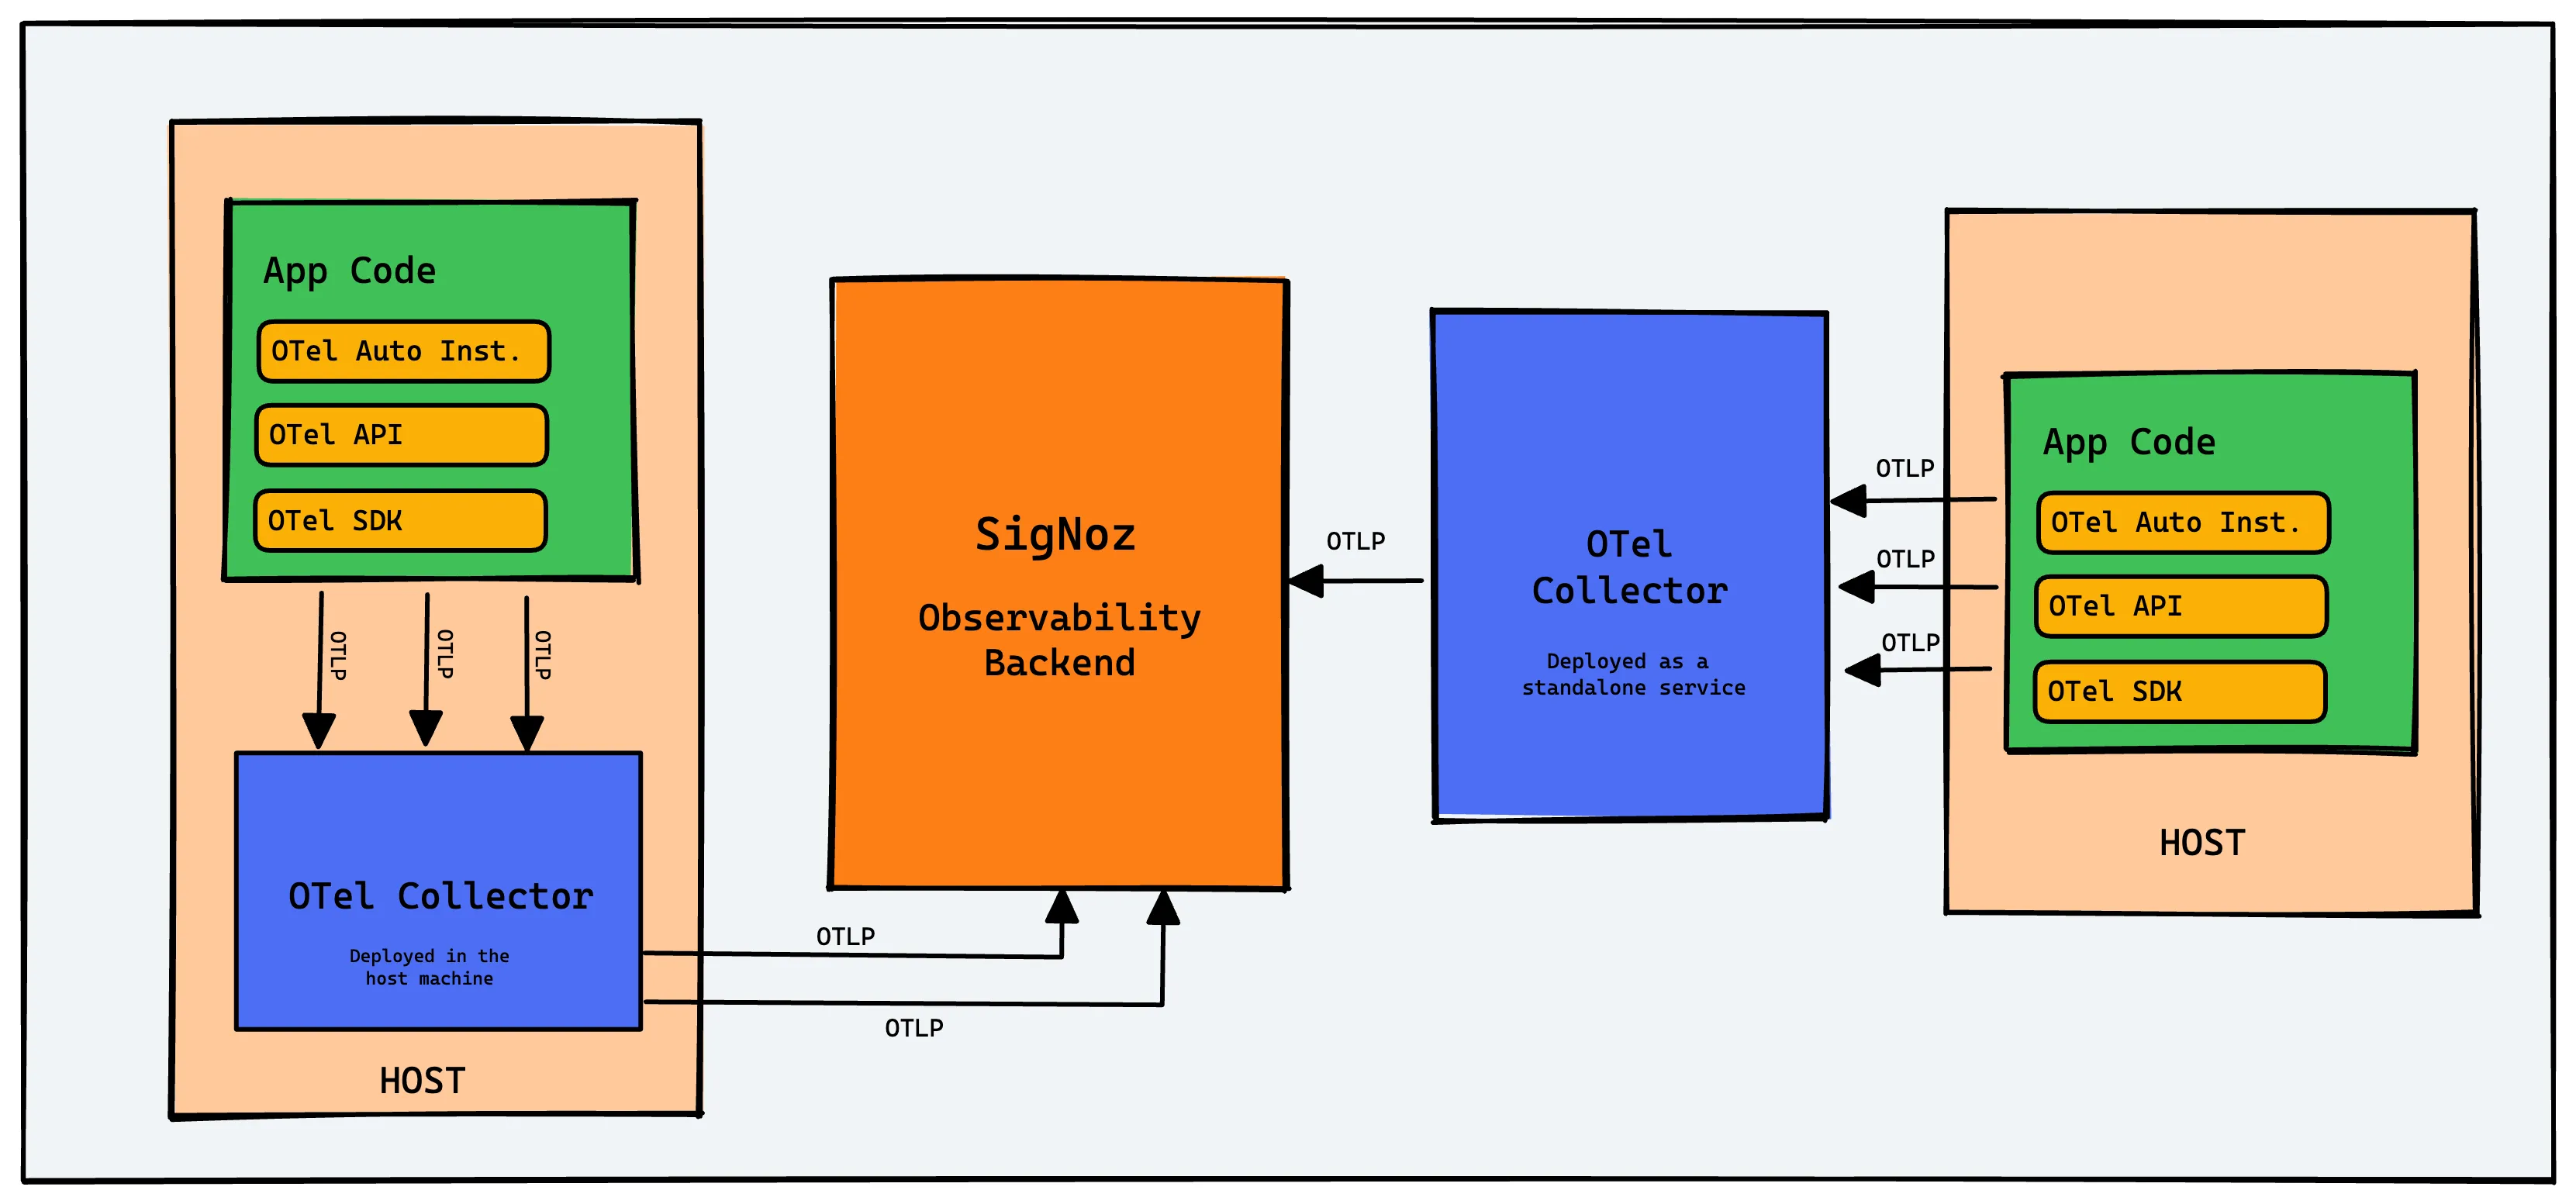
OpenTelemetry is the bedrock for setting up an observability framework. It also provides you the freedom to choose a backend analysis tool of your choice.
OpenTelemetry and SigNoz
In this tutorial, we will use SigNoz as our backend analysis tool. SigNoz is a full-stack open-source APM tool that can be used for storing and visualizing the telemetry data collected with OpenTelemetry. It is built natively on OpenTelemetry and works on the OTLP data formats.
SigNoz provides query and visualization capabilities for the end-user and comes with out-of-box charts for application metrics, logs and traces.
Now let’s get down to how to implement OpenTelemetry in Rust applications and then visualize the collected data in SigNoz.
Running Rust application with OpenTelemetry
Step 1: Install SigNoz
First, you need to install SigNoz so that OpenTelemetry can send the data to it.
SigNoz can be installed on macOS or Linux computers in just three steps by using a simple install script.
The install script automatically installs Docker Engine on Linux. However, on macOS, you must manually install Docker Engine before running the install script.
git clone -b main https://github.com/SigNoz/signoz.git
cd signoz/deploy/
./install.sh
You can visit our documentation for instructions on how to install SigNoz using Docker Swarm and Helm Charts.
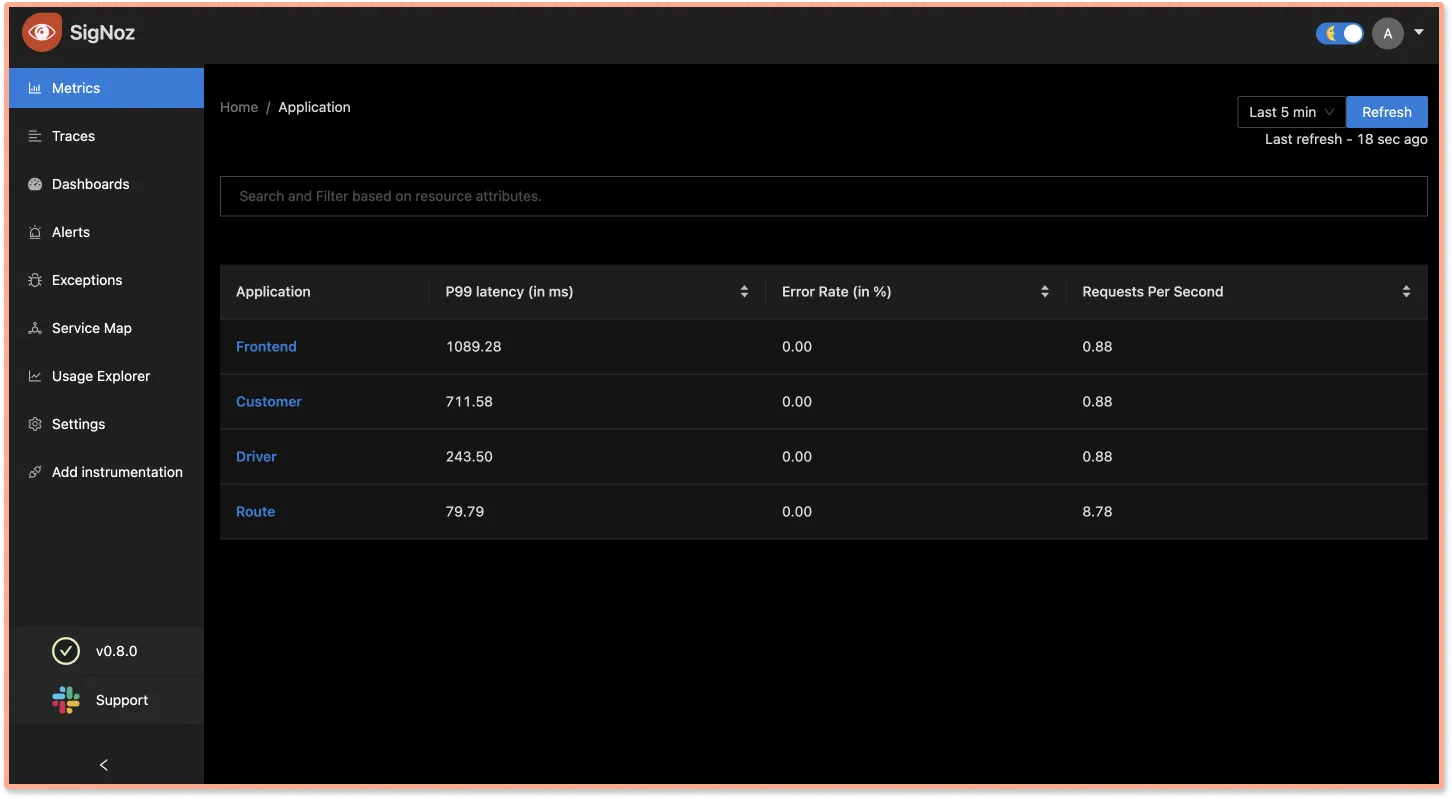
When you are done installing SigNoz, you can access the UI at http://localhost:3301
Step 2: Get sample Rust application
If you have your own Rust application, follow along the steps mentioned below. We have prepared a sample Rust application which is already instrumented with OpenTelemetry.
Step 3: Instrument your application with OpenTelemetry
To configure your application to send data we will need a function to initialize OpenTelemetry. Add the following snippet of code in your main.rs file.
use opentelemetry::sdk::Resource;
use opentelemetry::trace::TraceError;
use opentelemetry::{global, sdk::trace as sdktrace};
use opentelemetry::{trace::Tracer};
use opentelemetry_otlp::WithExportConfig;


fn init_tracer() -> Result<sdktrace::Tracer, TraceError> {
    opentelemetry_otlp::new_pipeline()
        .tracing()
        .with_exporter(opentelemetry_otlp::new_exporter().tonic().with_env())
        .with_trace_config(
            sdktrace::config().with_resource(Resource::default()),
        )
        .install_batch(opentelemetry::runtime::Tokio)
}
Step 4: Initialize the tracer in main.rs
Modify the main function to initialise the tracer in main.rs
#[tokio::main]
async fn main() -> Result<(), Box<dyn Error + Send + Sync + 'static>> {
    let _ = init_tracer()?;

    ...
}
Step 5: Add the OpenTelemetry instrumentation for your sample Rust app
    let parent_cx = global::get_text_map_propagator(|propagator| {
        propagator.extract(&HeaderExtractor(req.headers()))
    });
    tracer.start_with_context("fibonacci", &parent_cx);
Step 6: Set environment variables and run your Rust application
Now that you have instrumented your Rust application with OpenTelemetry, you need to set some environment variables to send data to SigNoz backend:
OTEL_RESOURCE_ATTRIBUTES: service.name=rust-app (you can name it whatever you want)
OTEL_EXPORTER_OTLP_ENDPOINT: http://localhost:4317
Since, we have installed SigNoz on our local machine, we use the above IP. If you install SigNoz on a different machine, you can update it with the relevant IP.
Hence, the final run command looks like this:
OTEL_EXPORTER_OTLP_ENDPOINT=http://localhost:4317 OTEL_RESOURCE_ATTRIBUTES=service.name=rust-app cargo run
Step 7: Generate some data
In order to monitor your Rust application with SigNoz, you first need to generate some data.
Visit home page of your Rust application at http://localhost:1337 and enter some details. Alternatively you can just send curl request
curl -d "name=Baymax&number=42" \
-H "Content-Type: application/x-www-form-urlencoded" \
-X POST http://localhost:1337/post
Step 8: Visualize the collected data in SigNoz
Access the signoz UI on http://localhost:3301/application. You will find your sample Rust application in the list of applications being monitored by SigNoz.
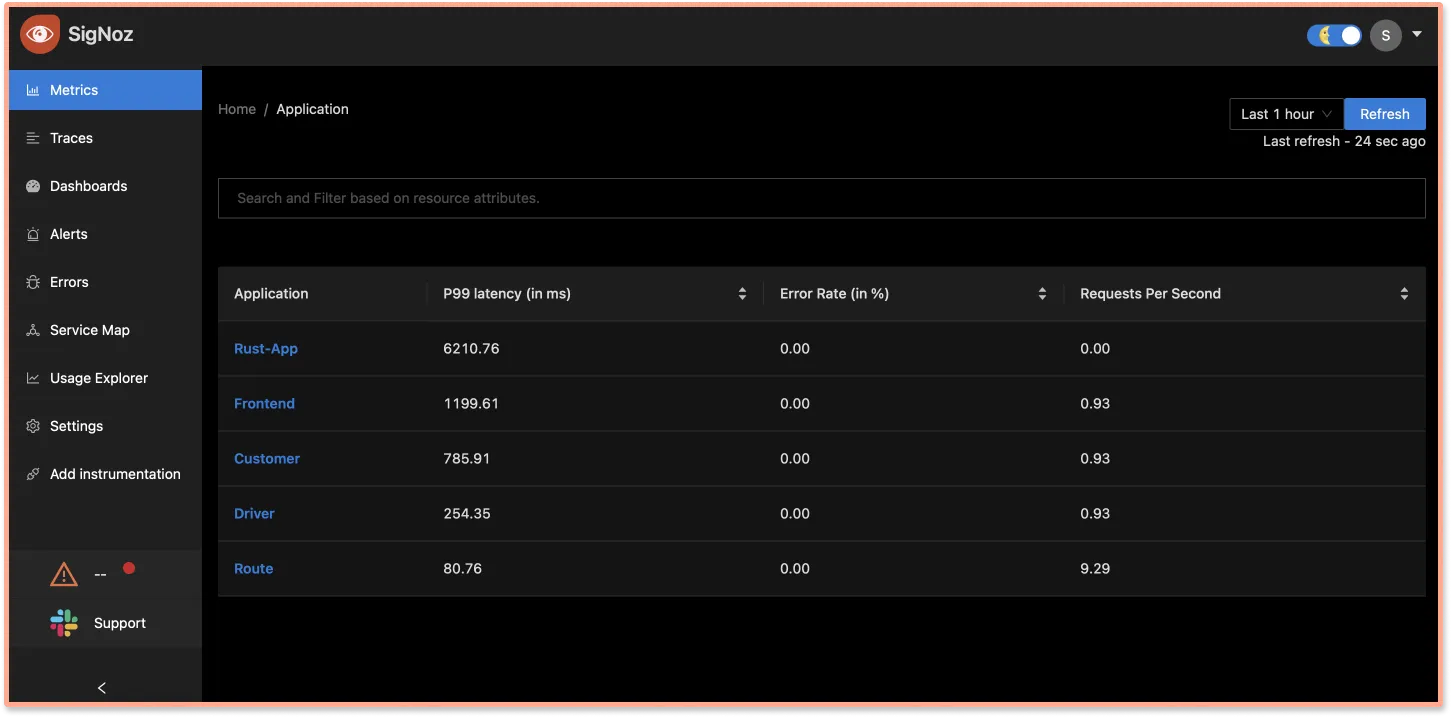
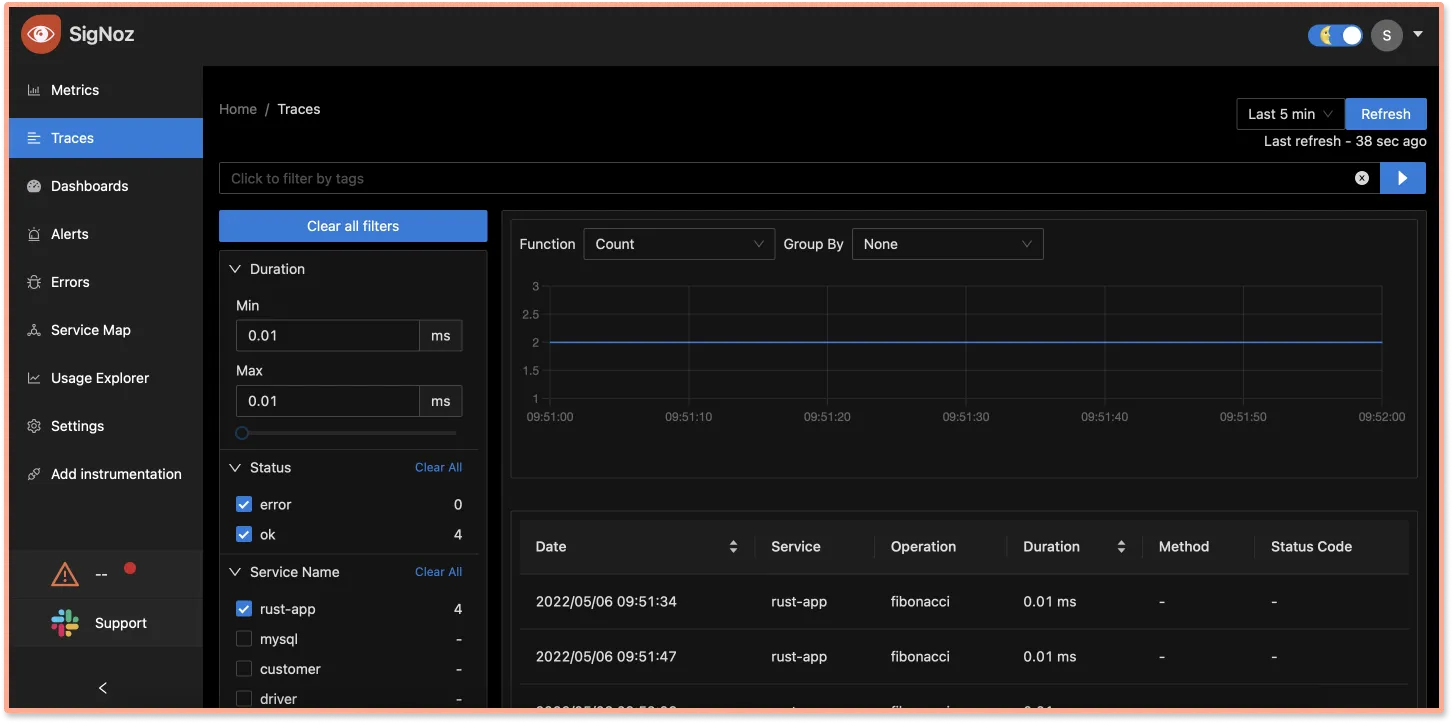
Go to Traces and choose rust-app from the list of services to see the tracing data of your application. Tracing data can help you visualize how user requests perform across services in a multi-service application.
In the Traces tab of SigNoz, you can analyze the tracing data using filters based on tags, status codes, service names, operations, etc.
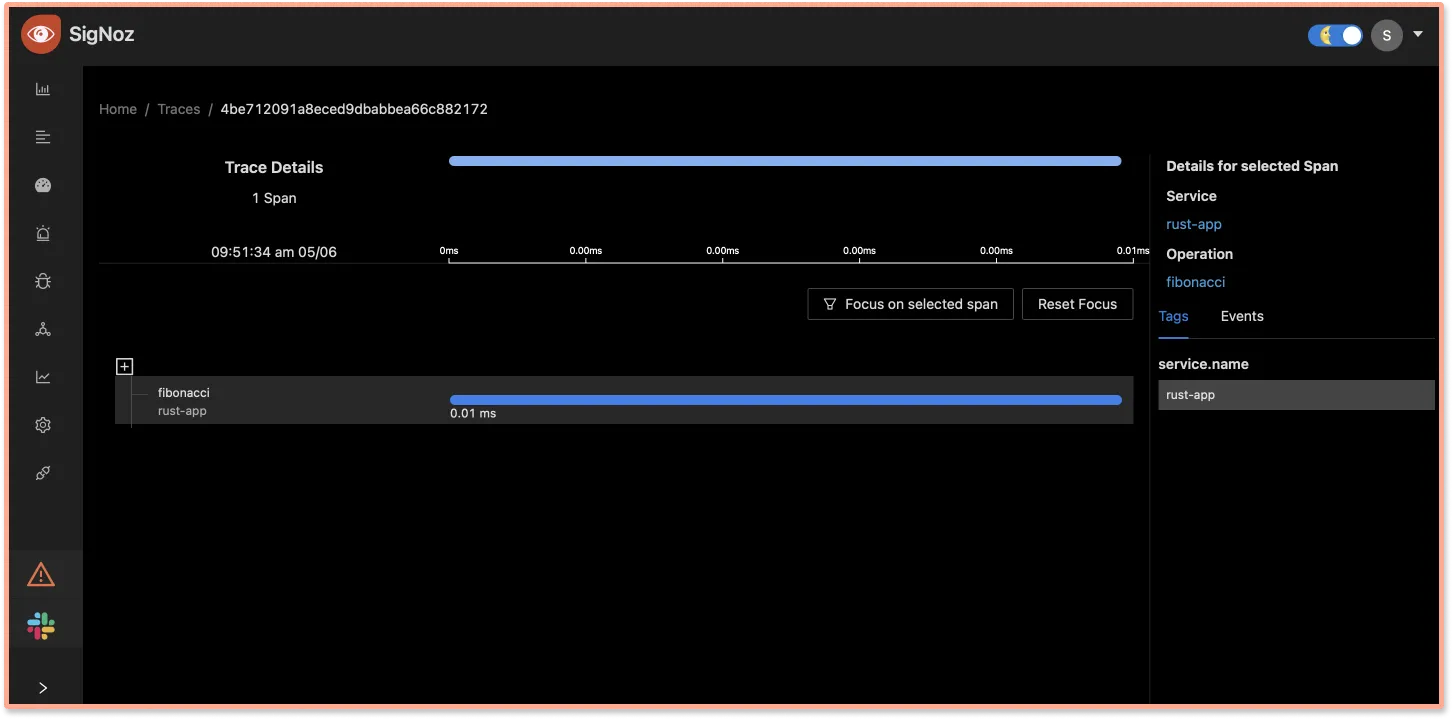
You can see a complete breakdown of the request with Flamegraphs and Gantt charts. You can click on any span in the spans table to access it.
Conclusion
Using OpenTelemetry libraries, you can instrument your Rust applications for end-to-end tracing. You can then use an open-source APM tool like SigNoz to ensure the smooth performance of your applications.
OpenTelemetry is the future for setting up observability for cloud-native apps. It is backed by a huge community and covers a wide variety of technology and frameworks. Using OpenTelemetry, engineering teams can instrument polyglot and distributed applications with peace of mind.
If you are someone who understands more from video, then you can watch the below video tutorial on the same with SigNoz.

Getting started with SigNoz
SigNoz is an open-source observability tool that comes with a SaaS-like experience. SigNoz can be installed on macOS or Linux computers in just three steps by using a simple install script.
The install script automatically installs Docker Engine on Linux. However, on macOS, you must manually install Docker Engine before running the install script.
git clone -b main https://github.com/SigNoz/signoz.git
cd signoz/deploy/
./install.sh
You can visit our documentation for instructions on how to install SigNoz using Docker Swarm and Helm Charts.
Further Reading
OpenTelemetry Collector - Complete Guide
OpenTelemetry Tracing - things you need to know


