OpenTelemetry Auto & Manual Instrumentation Explained with a Sample Python App
OpenTelemetry is an open-source observability project that provides a set of APIs, SDKs, and tooling for collecting, generating, and exporting telemetry data. It provides instrumentation libraries in all major programming languages. In this article, we will demonstrate the automatic and manual instrumentation of Python applications.
In this tutorial, we cover:
- A Brief Overview of OpenTelemetry Auto-instrumentation
- A Brief Overview of OpenTelemetry Manual Instrumentation
- Auto vs Manual Instrumentation - What to choose?
- Demo - Auto & Manual Instrumentation in a Python App
- Setting up SigNoz
- Add Auto-instrumentation
- Add Manual Instrumentation
- Conclusion
If you want to jump straight into implementation, start with this prerequisites section.
The telemetry data generated by OpenTelemetry includes metrics, logs, and traces, which are all essential for understanding the performance and behavior of distributed systems. OpenTelemetry is vendor-agnostic, which means that it can be used with a variety of backend systems, such as Prometheus, Jaeger, and SigNoz. This makes it a versatile tool for observability in modern cloud-native environments.
Opentelemetry supports two types of instrumentation.
- Auto-instrumentation, and
- Manual Instrumentation
A Brief Overview of OpenTelemetry Auto-instrumentation
Auto-instrumentation is a method for instrumenting an application without manual coding. It eliminates the need for developers to manually add tracing or monitoring code to their application, allowing them to add instrumentation to their codebase dynamically.
Pros of auto-instrumentation:
- Ease of use: Auto-instrumentation eliminates the need for manual coding, saving developers time and effort.
- Dynamic instrumentation: Instrumentation can be added or removed dynamically without modifying the application code.
- Broad coverage: Auto-instrumentation can instrument a wide range of libraries and frameworks, providing comprehensive observability.
Cons of auto-instrumentation:
- Limited granularity: Auto-instrumentation may not capture all relevant data, and it may be difficult to control the level of detail.
- Potential for performance overhead: Auto-instrumentation can introduce some overhead, especially in performance-critical applications.
- Compatibility issues: Auto-instrumentation may not be compatible with all frameworks or libraries.
A Brief Overview of OpenTelemetry Manual Instrumentation
Manual instrumentation, on the other hand, involves embedding telemetry collection code directly into an application to send valuable data to an observability backend or collector. This necessitates that developers explicitly add tracing or monitoring code to their applications.
Pros of manual instrumentation:
- Granular control: Developers have fine-grained control over the data being collected, ensuring that only relevant information is captured.
- No performance overhead: Manual instrumentation can be optimized to minimize performance impact.
- Flexibility: Manual instrumentation can be used to instrument any part of the application code.
Cons of manual instrumentation:
- Increased development effort: Manual instrumentation requires developers to write additional code, which can increase development time and effort.
- Maintenance overhead: Manual instrumentation requires ongoing maintenance to ensure that it is up-to-date and compatible with changes in the application code.
- Potential for errors: Manual instrumentation can be prone to errors, which can lead to inaccurate data collection.
Auto vs Manual Instrumentation - What to choose?
Do you really need to choose between auto and manual instrumentation?
In other words, can you not have the best of both worlds?
Auto-instrumentation provides you a rapid start to get going while manual instrumentation (though laborious to setup in the first run) will provide you better control over the signals that are generated.
A recommended approach is to start easy with auto-instrumentation, which takes us 80% of the way, and then use manual instrumentation to customize and fine-tune the parts that auto-instrumentation could not cover.
Auto-instrumentation is also recommended starting point to understand the semantic conventions of OpenTelemetry to be used for instrumentation (Eg: http.method)
We will see how to achieve this with a sample Python example below
Demo - Auto & Manual Instrumentation in a Python App
Prerequisite - a Python Flask application
We will use a simple Python application to roll a dice and display the output. If the result goes beyond 6, the code returns an exception. We will use random.randint() and time.sleep() to mimic randomness and some delay.
Create an app.py file with the code below:
# app.py - flask server to roll dice
from flask import Flask
import logging
import random
import time

app = Flask(__name__)

logging.basicConfig(level=logging.INFO)

@app.route('/')
def index():
    return 'Hello, World!'

def roll_dice():
    sleep = random.randint(1, 3)
    roll = random.randint(1, 8)
    logging.info(f'Rolling dice in {sleep} seconds')
    time.sleep(sleep)
    return roll

@app.route('/roll')
def roll():
    roll = roll_dice()
    if roll in range(1, 6):
        return {'message': f'You rolled a {roll}'}
    else:
        return {'message': f'You rolled a {roll}, exception'}, 500 #Internal server error

if __name__ == '__main__':
    app.run(debug=False, host='0.0.0.0', port=12345)
Create a virtual environment:
python3 -m venv .venv
source .venv/bin/activate
And install flask:
python -m pip install flask
Setting up SigNoz
You need a backend to send the collected data for monitoring and visualization. SigNoz is an OpenTelemetry-native APM that is well-suited for visualizing OpenTelemetry data.
SigNoz cloud is the easiest way to run SigNoz. You can sign up here for a free account and get 30 days of unlimited access to all features.
You can also install and self-host SigNoz yourself. Check out the docs for installing self-host SigNoz.
For this tutorial, we will be using a SigNoz cloud account.
Add Auto-instrumentation
Step 1: Install the OpenTelemetry dependencies:
Once you have installed the packages needed by your application, let’s install OpenTelemetry libraries needed for auto-instrumentation.
pip install opentelemetry-distro==0.38b0
pip install opentelemetry-exporter-otlp==1.17.0
Step 2: Add automatic instrumentation
The below command installs the right versions of all the OpenTelemetry libraries for auto-instrumentation based on what is installed in the site-packages/ directory.
opentelemetry-bootstrap --action=install
Note:
Please make sure that you have installed all the dependencies of your application before running the above command. The command will not install instrumentation for the dependencies which are not installed.
Step 3: Run your application
opentelemetry-instrument is the agent that interfaces with the application and emits signals (metrics, traces and logs).
You can run your Python app with the following environment variables:
OTEL_RESOURCE_ATTRIBUTES=service.name=<service_name> \
OTEL_EXPORTER_OTLP_ENDPOINT="https://ingest.{region}.signoz.cloud:443" \
OTEL_EXPORTER_OTLP_HEADERS="signoz-access-token=SIGNOZ_INGESTION_KEY" \
OTEL_EXPORTER_OTLP_PROTOCOL=grpc \
opentelemetry-instrument <your_run_command>
You need to replace <service_name> with any name that you want for the service.
Replace {region} with the region for your SigNoz cloud account and <SIGNOZ_INGESTION_KEY> with the ingestion key for your account. You can find these settings in the SigNoz dashboard under Settings > Ingestion Settings.
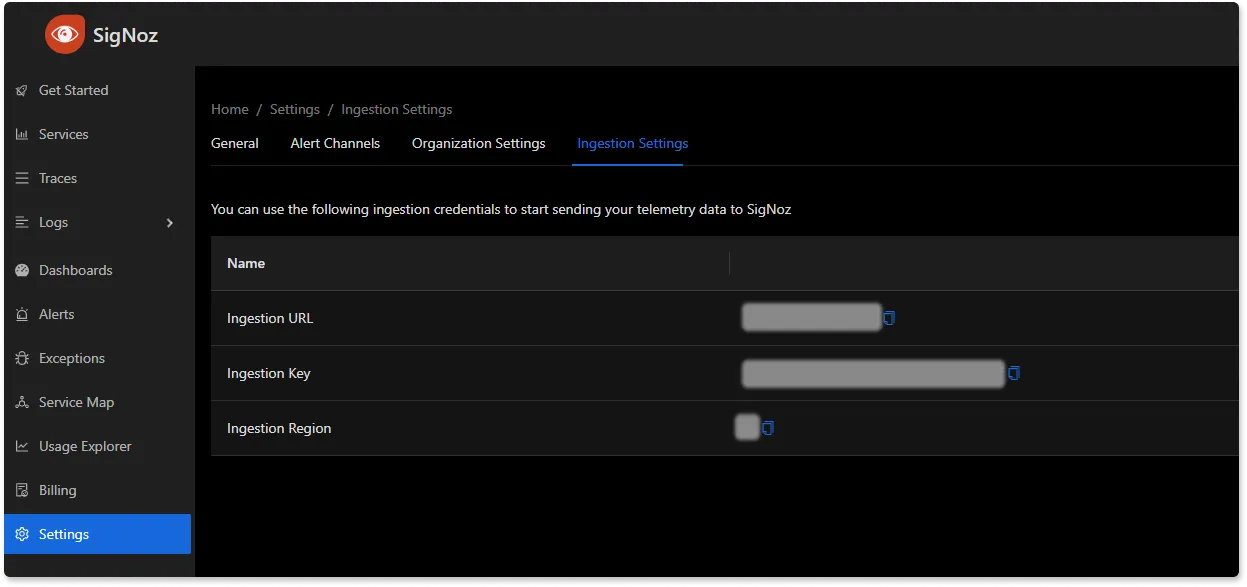
Once your application is running, make some http calls to to verify and genrate some data. Your application will be visible in SigNoz if it is generating some traces.
Run the server through the agent and make some http calls to verify (curl localhost:12345/roll)
Then go to the Traces tab of SigNoz to check spans incoming from your Python application.
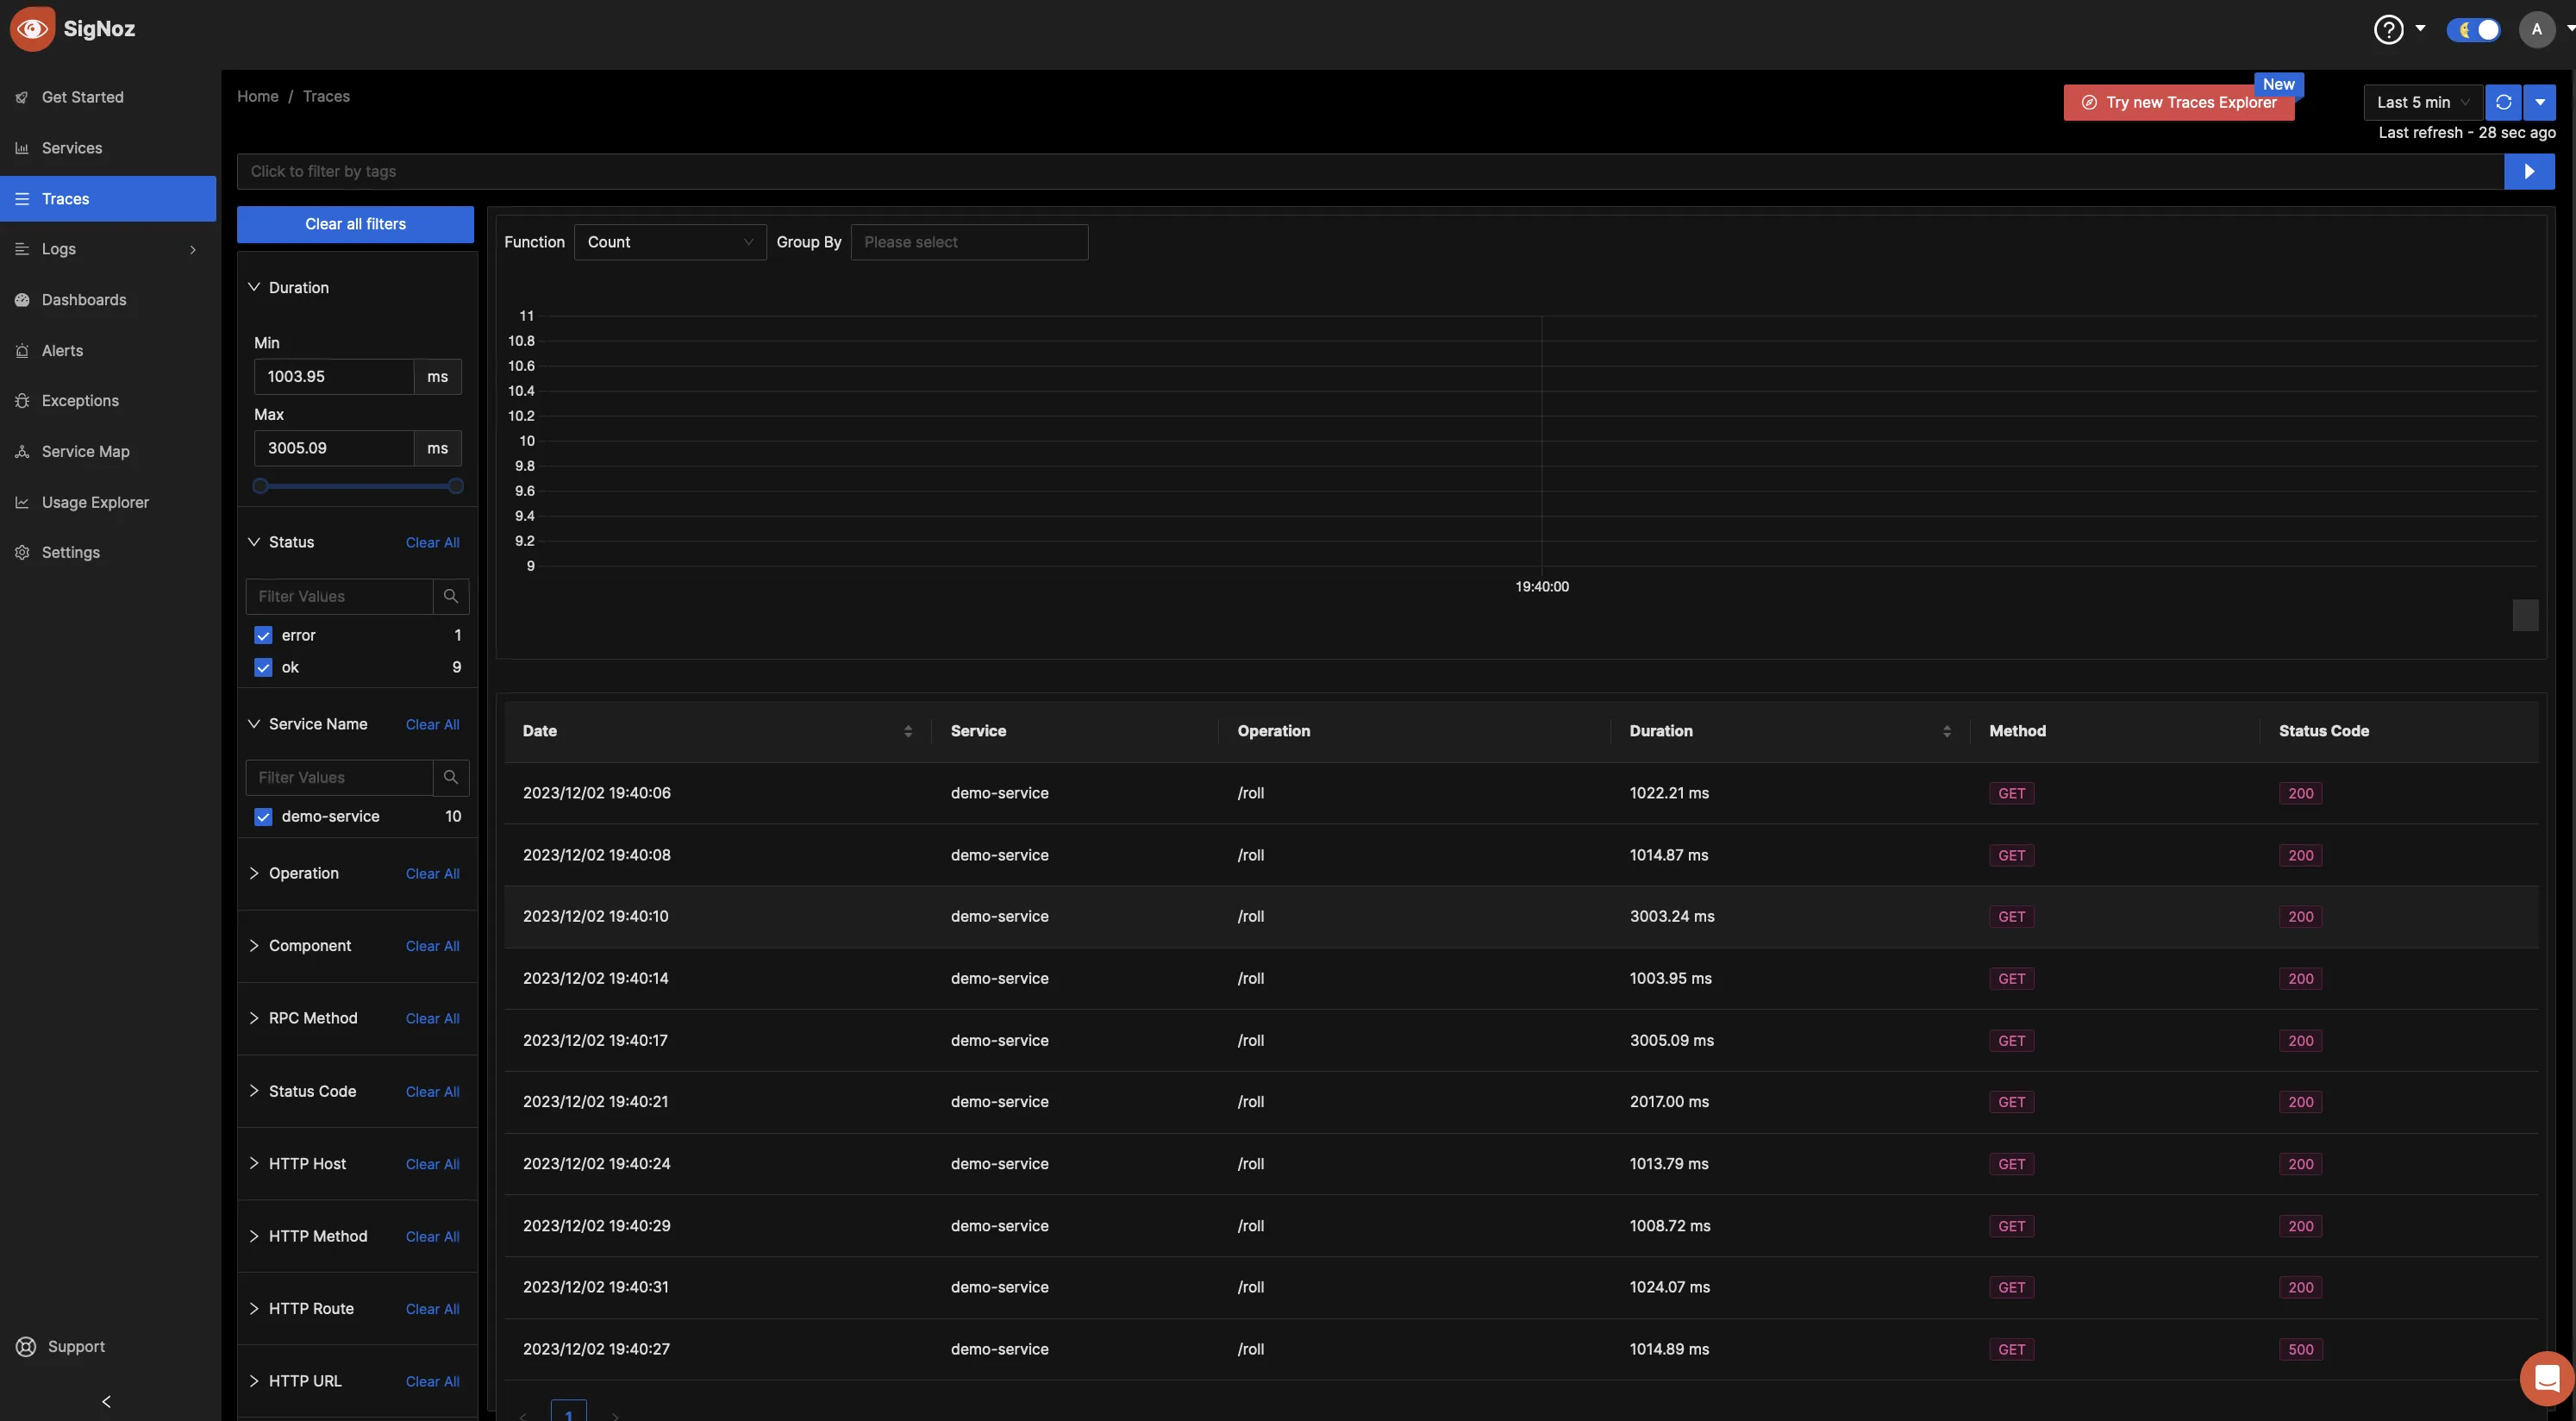
We see traces are emitted, and most of the work is done. However, the traces are rather shallow (single span per trace).
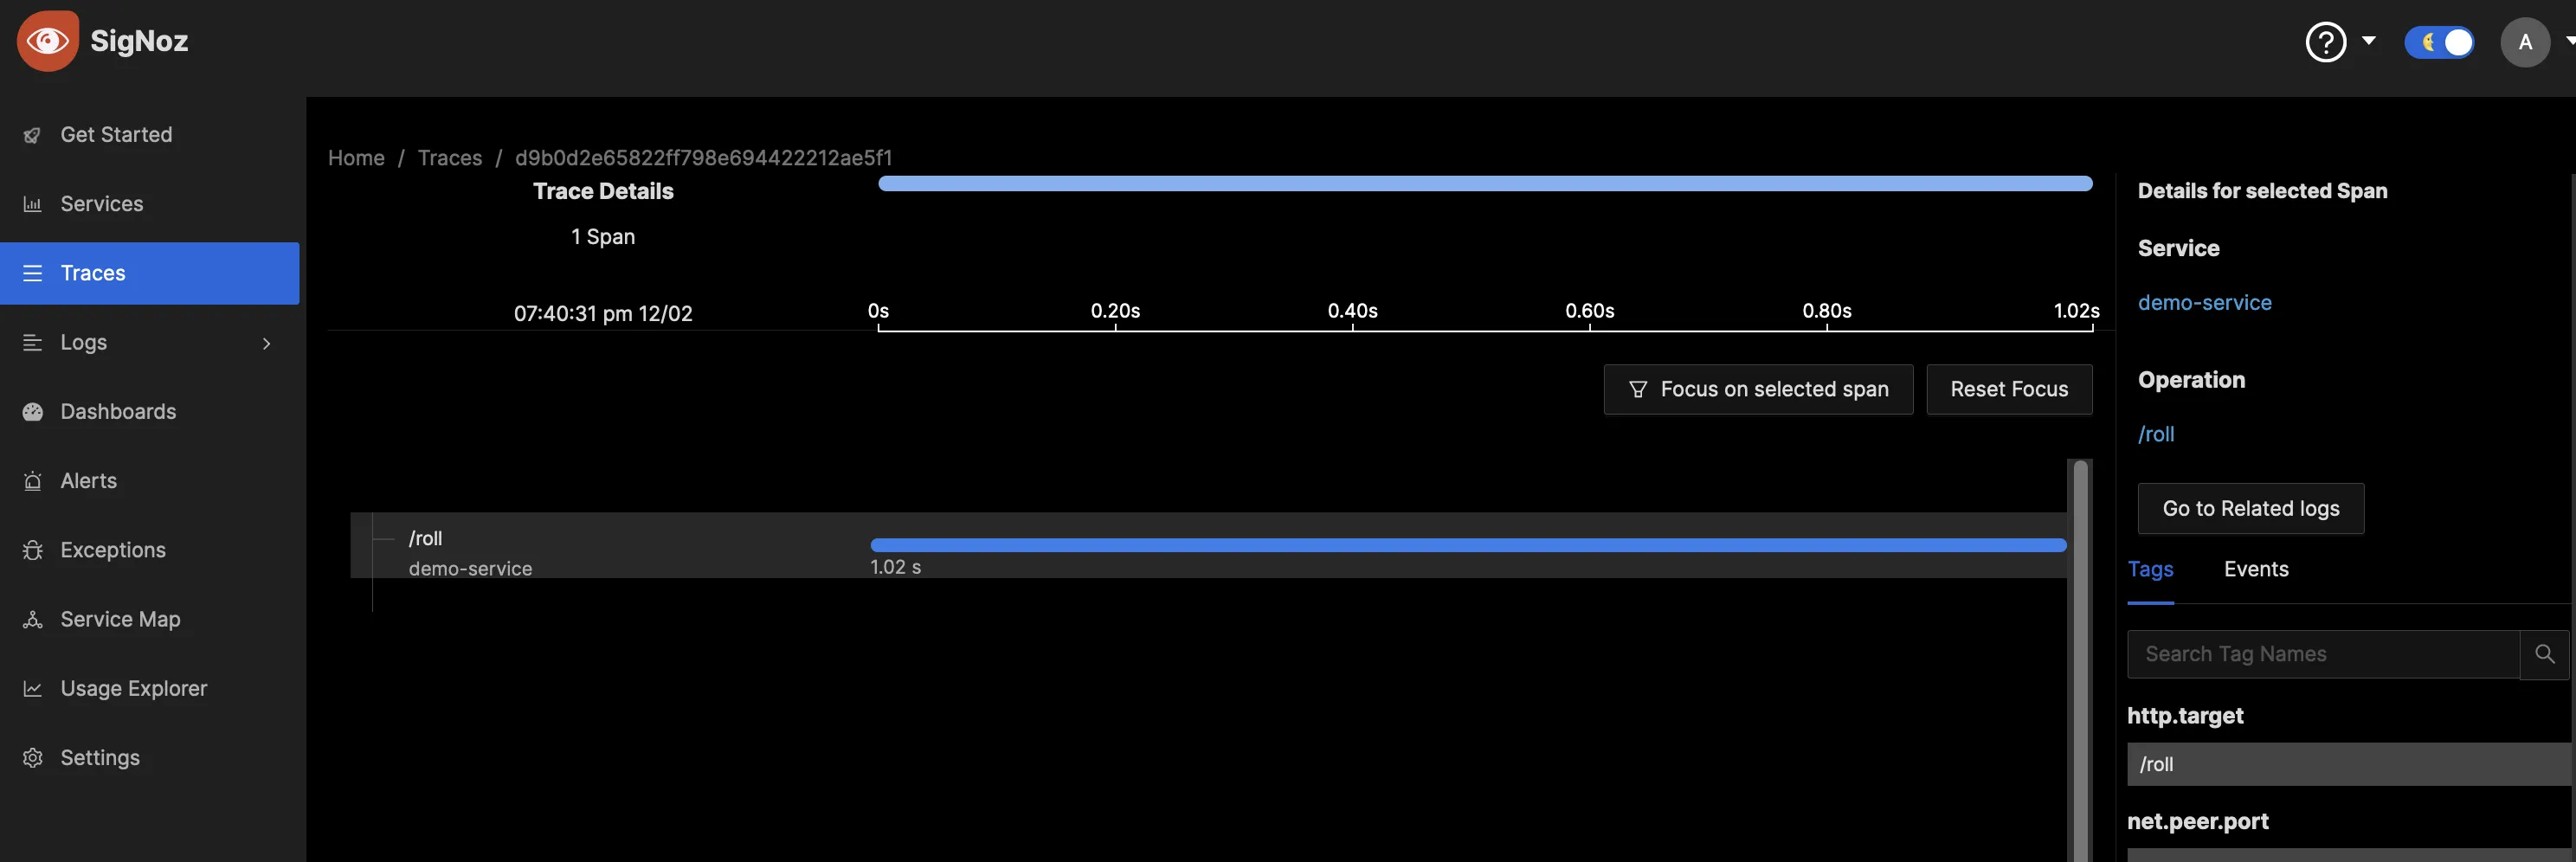
It would be useful to capture more details of roll_dice(), like the time it slept and the actual dice-roll value.
How do we do that?
Add Manual Instrumentation
OpenTelemetry libraries that were installed for auto-instrumentation provide you with APIs to access the tracer object and hence give access to traces and spans in the running context. By getting the current tracer and the trace-span context, you can extend your code to emit extra spans with the information as needed.
Update the [app.py](http://app.py) file with the following code:
# app.py - flask server to roll dice with manual span for roll details
from flask import Flask
import logging
import random
import time

# Imports for enabling manual instrumentation
from opentelemetry import trace
from opentelemetry.instrumentation.logging import LoggingInstrumentor

app = Flask(__name__)
# Initialize logger to emit trace-id, span-id and service-name along-with log message
LoggingInstrumentor().instrument(set_logging_format=True)

# Get the current tracer context
tracer = trace.get_tracer(__name__)

@app.route('/')
def index():
    logging.warning('In index')
    return 'Hello, World!'

def roll_dice():
    logging.warning('In roll_dice')
    sleep = random.randint(1, 3)
    roll = random.randint(1, 8)

    # add a child span and capture the values for sleep and roll
    with tracer.start_as_current_span('sleep_and_roll_dice') as cspan:
        logging.warning(f'Rolling dice in {sleep} seconds')
        cspan.set_attribute('custom.sleep', sleep)
        cspan.set_attribute('custom.roll', roll)
        time.sleep(sleep)
    return roll

@app.route('/roll')
def roll():
    logging.warning('In roll')
    roll = roll_dice()
    if roll in range(1, 6):
    logging.warning(f'You rolled a {roll}')
        return {'message': f'You rolled a {roll}'}
    else:
        logging.error(f'You rolled a {roll}, exception')
        return {'message': f'You rolled a {roll}, exception'}, 500

if __name__ == '__main__':
    app.run(debug=False, host='0.0.0.0', port=12345)
Once the application code is updated, rerun the application with the same environment variables to send the trace data to the SigNoz cloud. Make some calls to localhost:12345/roll
Check out the traces tab of SigNoz again.
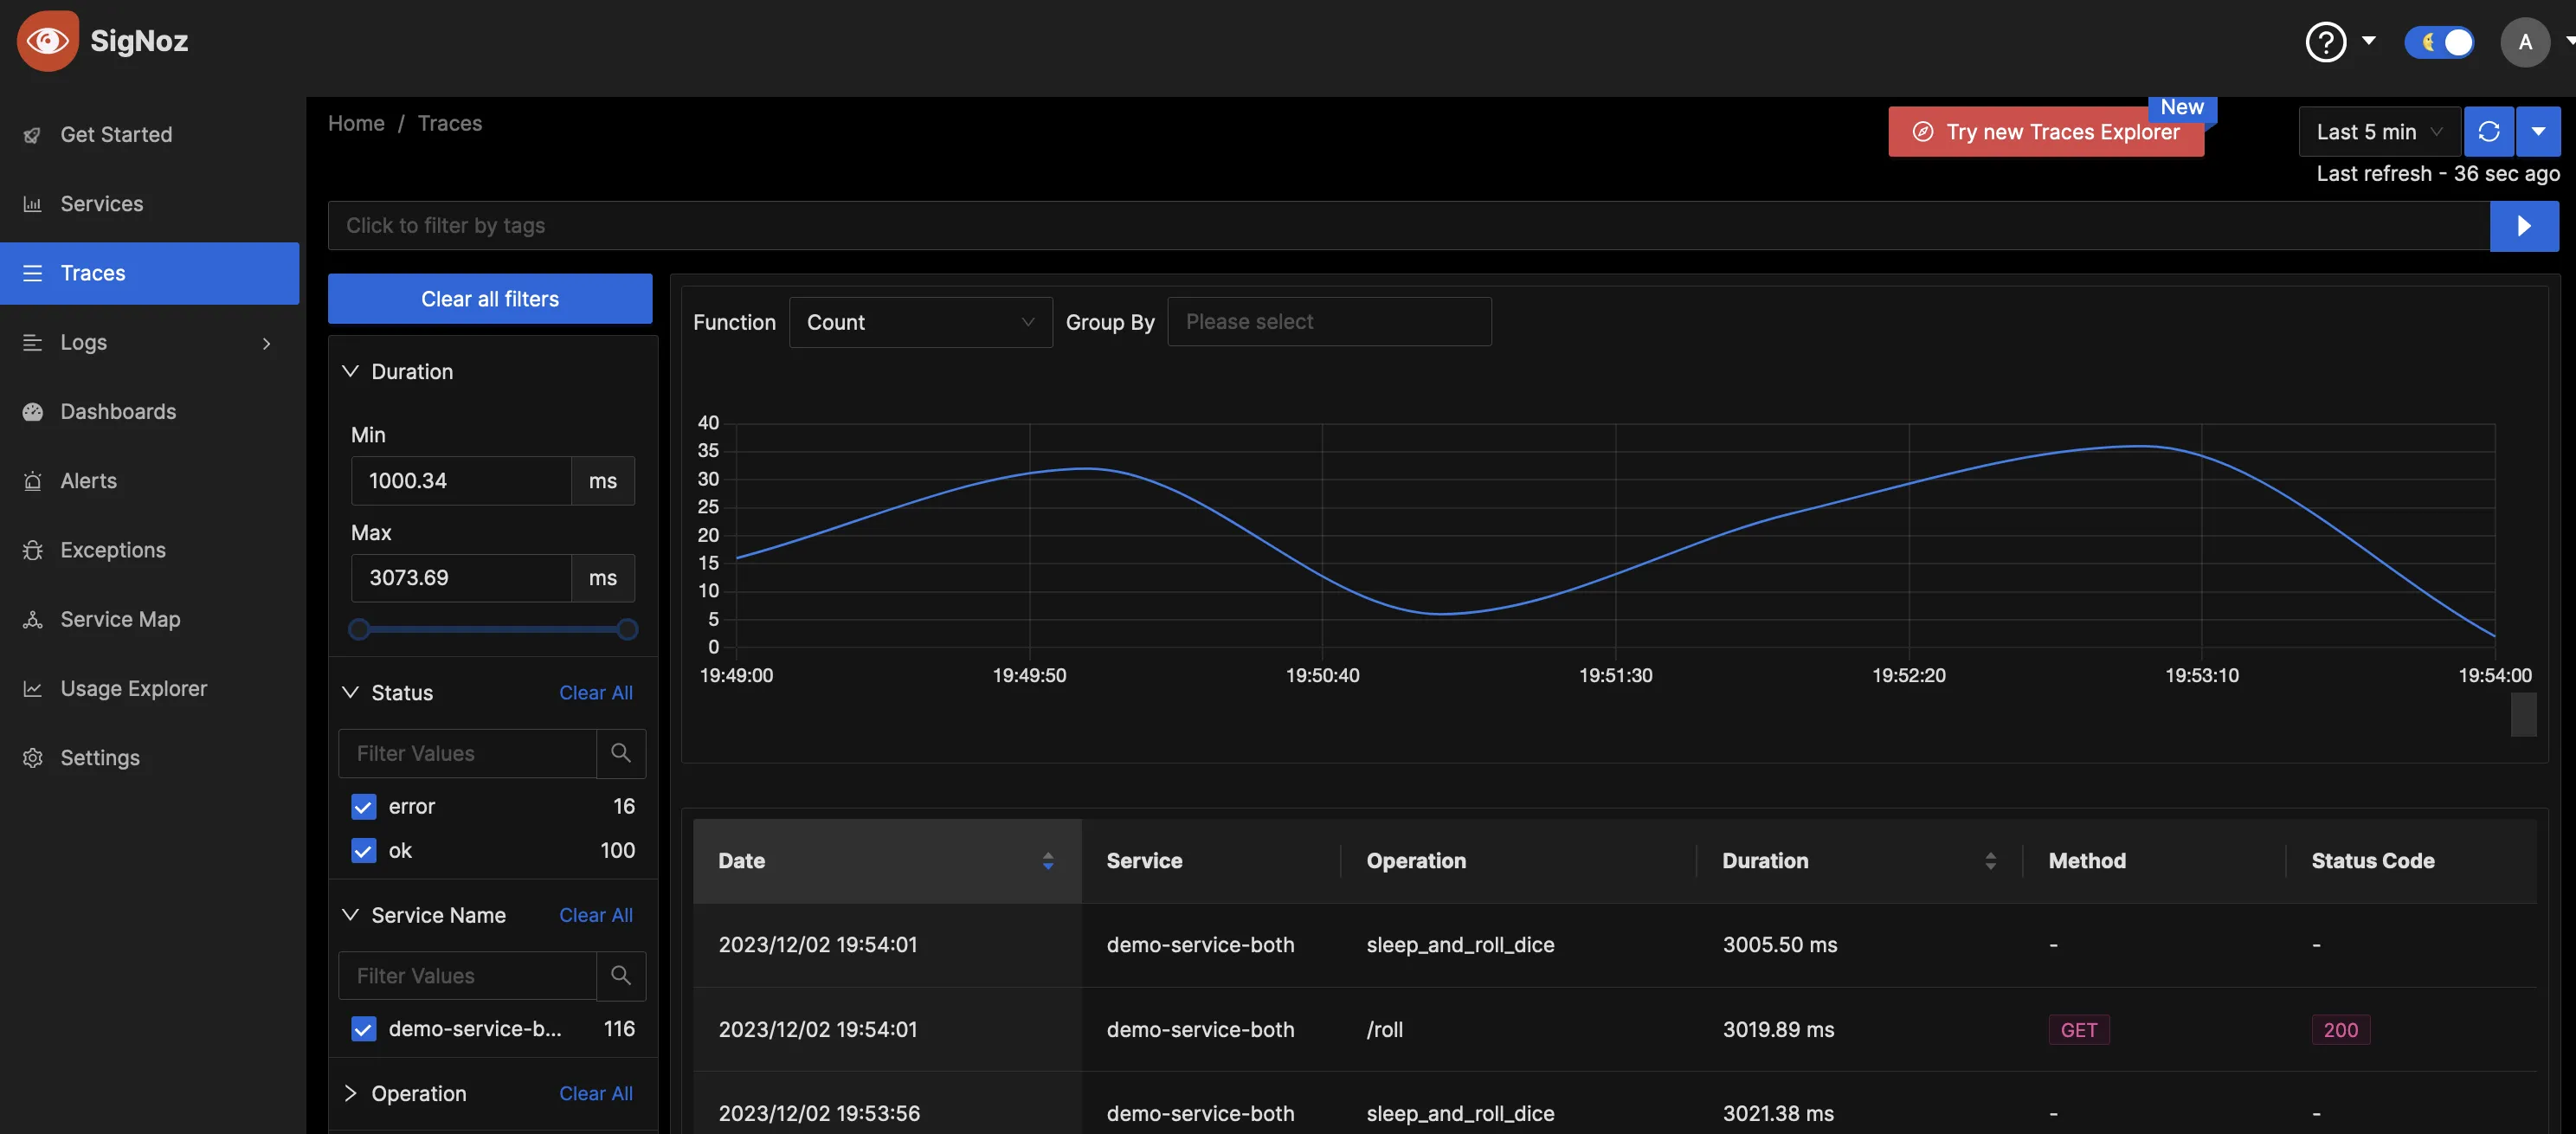
You now have spans coming from both auto-instrumentation and manual instrumentation.
The manually instrumented span is sleep_and_roll_dice. You can click on the span to see its flamegraph too.
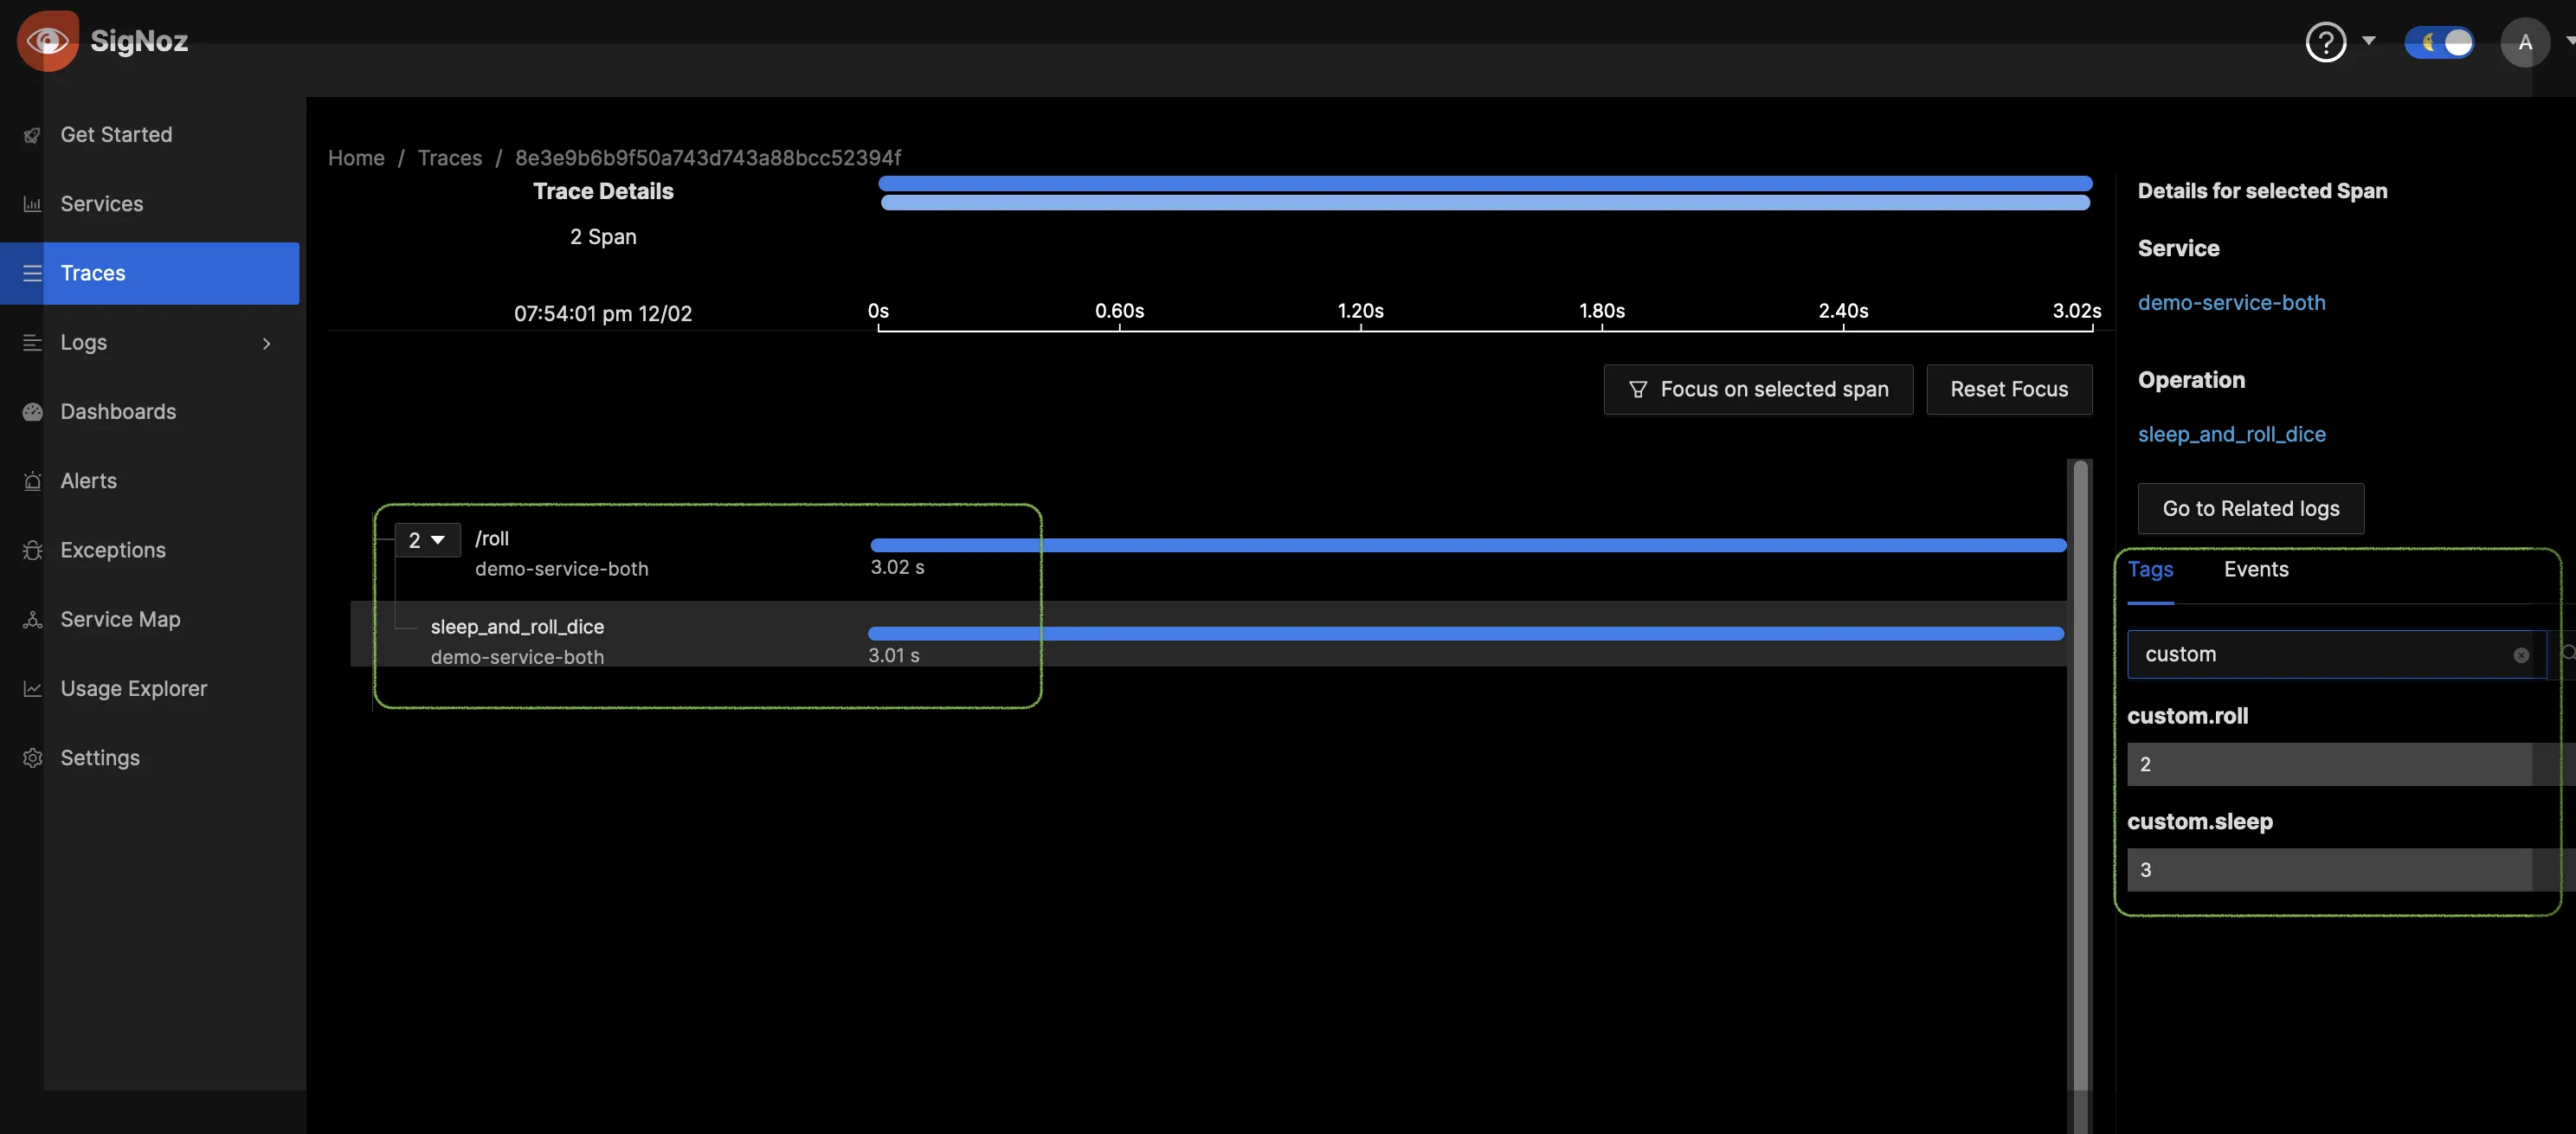
You can also see the values from the custom tags that were set.
Conclusion
In this tutorial, we added automatic and manual instrumentation to a Python sample code. When you’re getting started with OpenTelemetry, you should start with auto-instrumentation to see its value. Manual instrumentation is about improving the level of data that you collect with auto-instrumentation.
You can also use manual instrumentation to have more granular control over what is sent to a backend, as the scale of observability data can often be huge. You also learnt how to monitor your tracing data in SigNoz. SigNoz is an open-source OpenTelemetry-native APM that can be used as a single backend for all your observability needs.

