Monitoring your Nextjs application using OpenTelemetry
Nextjs is a production-ready React framework for building single-page web applications. It enables you to build fast and user-friendly static websites, as well as web applications using Reactjs. Using OpenTelemetry Nextjs libraries, you can set up end-to-end tracing for your Nextjs applications.
Nextjs has its own monitoring feature, but it is only limited to measuring the metrics like core web vitals and real-time analytics of the application. It doesn’t have end-to-end tracing, monitoring the database calls, etc. That’s where OpenTelemetry comes in.
OpenTelemetry is an open-source standard under Cloud Native Computing Foundation (CNCF) used for instrumenting applications for generating telemetry data. You can monitor your Nextjs application using OpenTelemetry and a tracing backend of your choice.
What is OpenTelemetry Nextjs instrumentation? Instrumentation is the process of enabling your application code to generate telemetry data like logs, metrics, and traces. Using OpenTelemetry Nextjs client libraries, you can generate end-to-end tracing data from your Nextjs application.
OpenTelemetry provides client libraries to take care of instrumentation. You then need to send the collected data to an analysis backend. In this tutorial, we will be using SigNoz to store and visualize the telemetry data collected by OpenTelemetry from the sample Nextjs application
Before we demonstrate how to implement the OpenTelemetry Nextjs libraries, let’s have a brief overview of OpenTelmetry.
What is OpenTelemetry?
OpenTelemetry is an open-source vendor-agnostic set of tools, APIs, and SDKs used to instrument applications to create and manage telemetry data(logs, metrics, and traces). It aims to make telemetry data(logs, metrics, and traces) a built-in feature of cloud-native software applications.The telemetry data is then sent to an observability tool for storage and visualization.
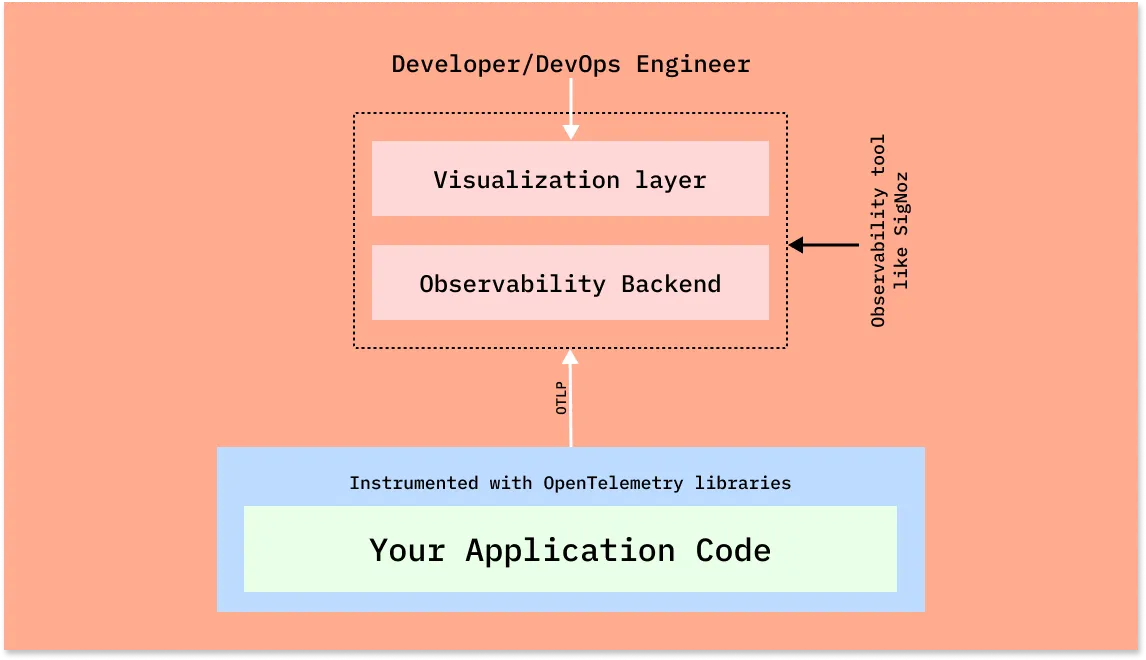
OpenTelemetry is the bedrock for setting up an observability framework. It also provides you the freedom to choose a backend analysis tool of your choice. You will never get locked in with any vendor if you use OpenTelemetry for your instrumentation layer.
OpenTelemetry and SigNoz
In this tutorial, we will use SigNoz as our backend analysis tool. SigNoz is a full-stack open-source APM tool that can be used for storing and visualizing the telemetry data collected with OpenTelemetry. It is built natively on OpenTelemetry and works on the OTLP data formats.
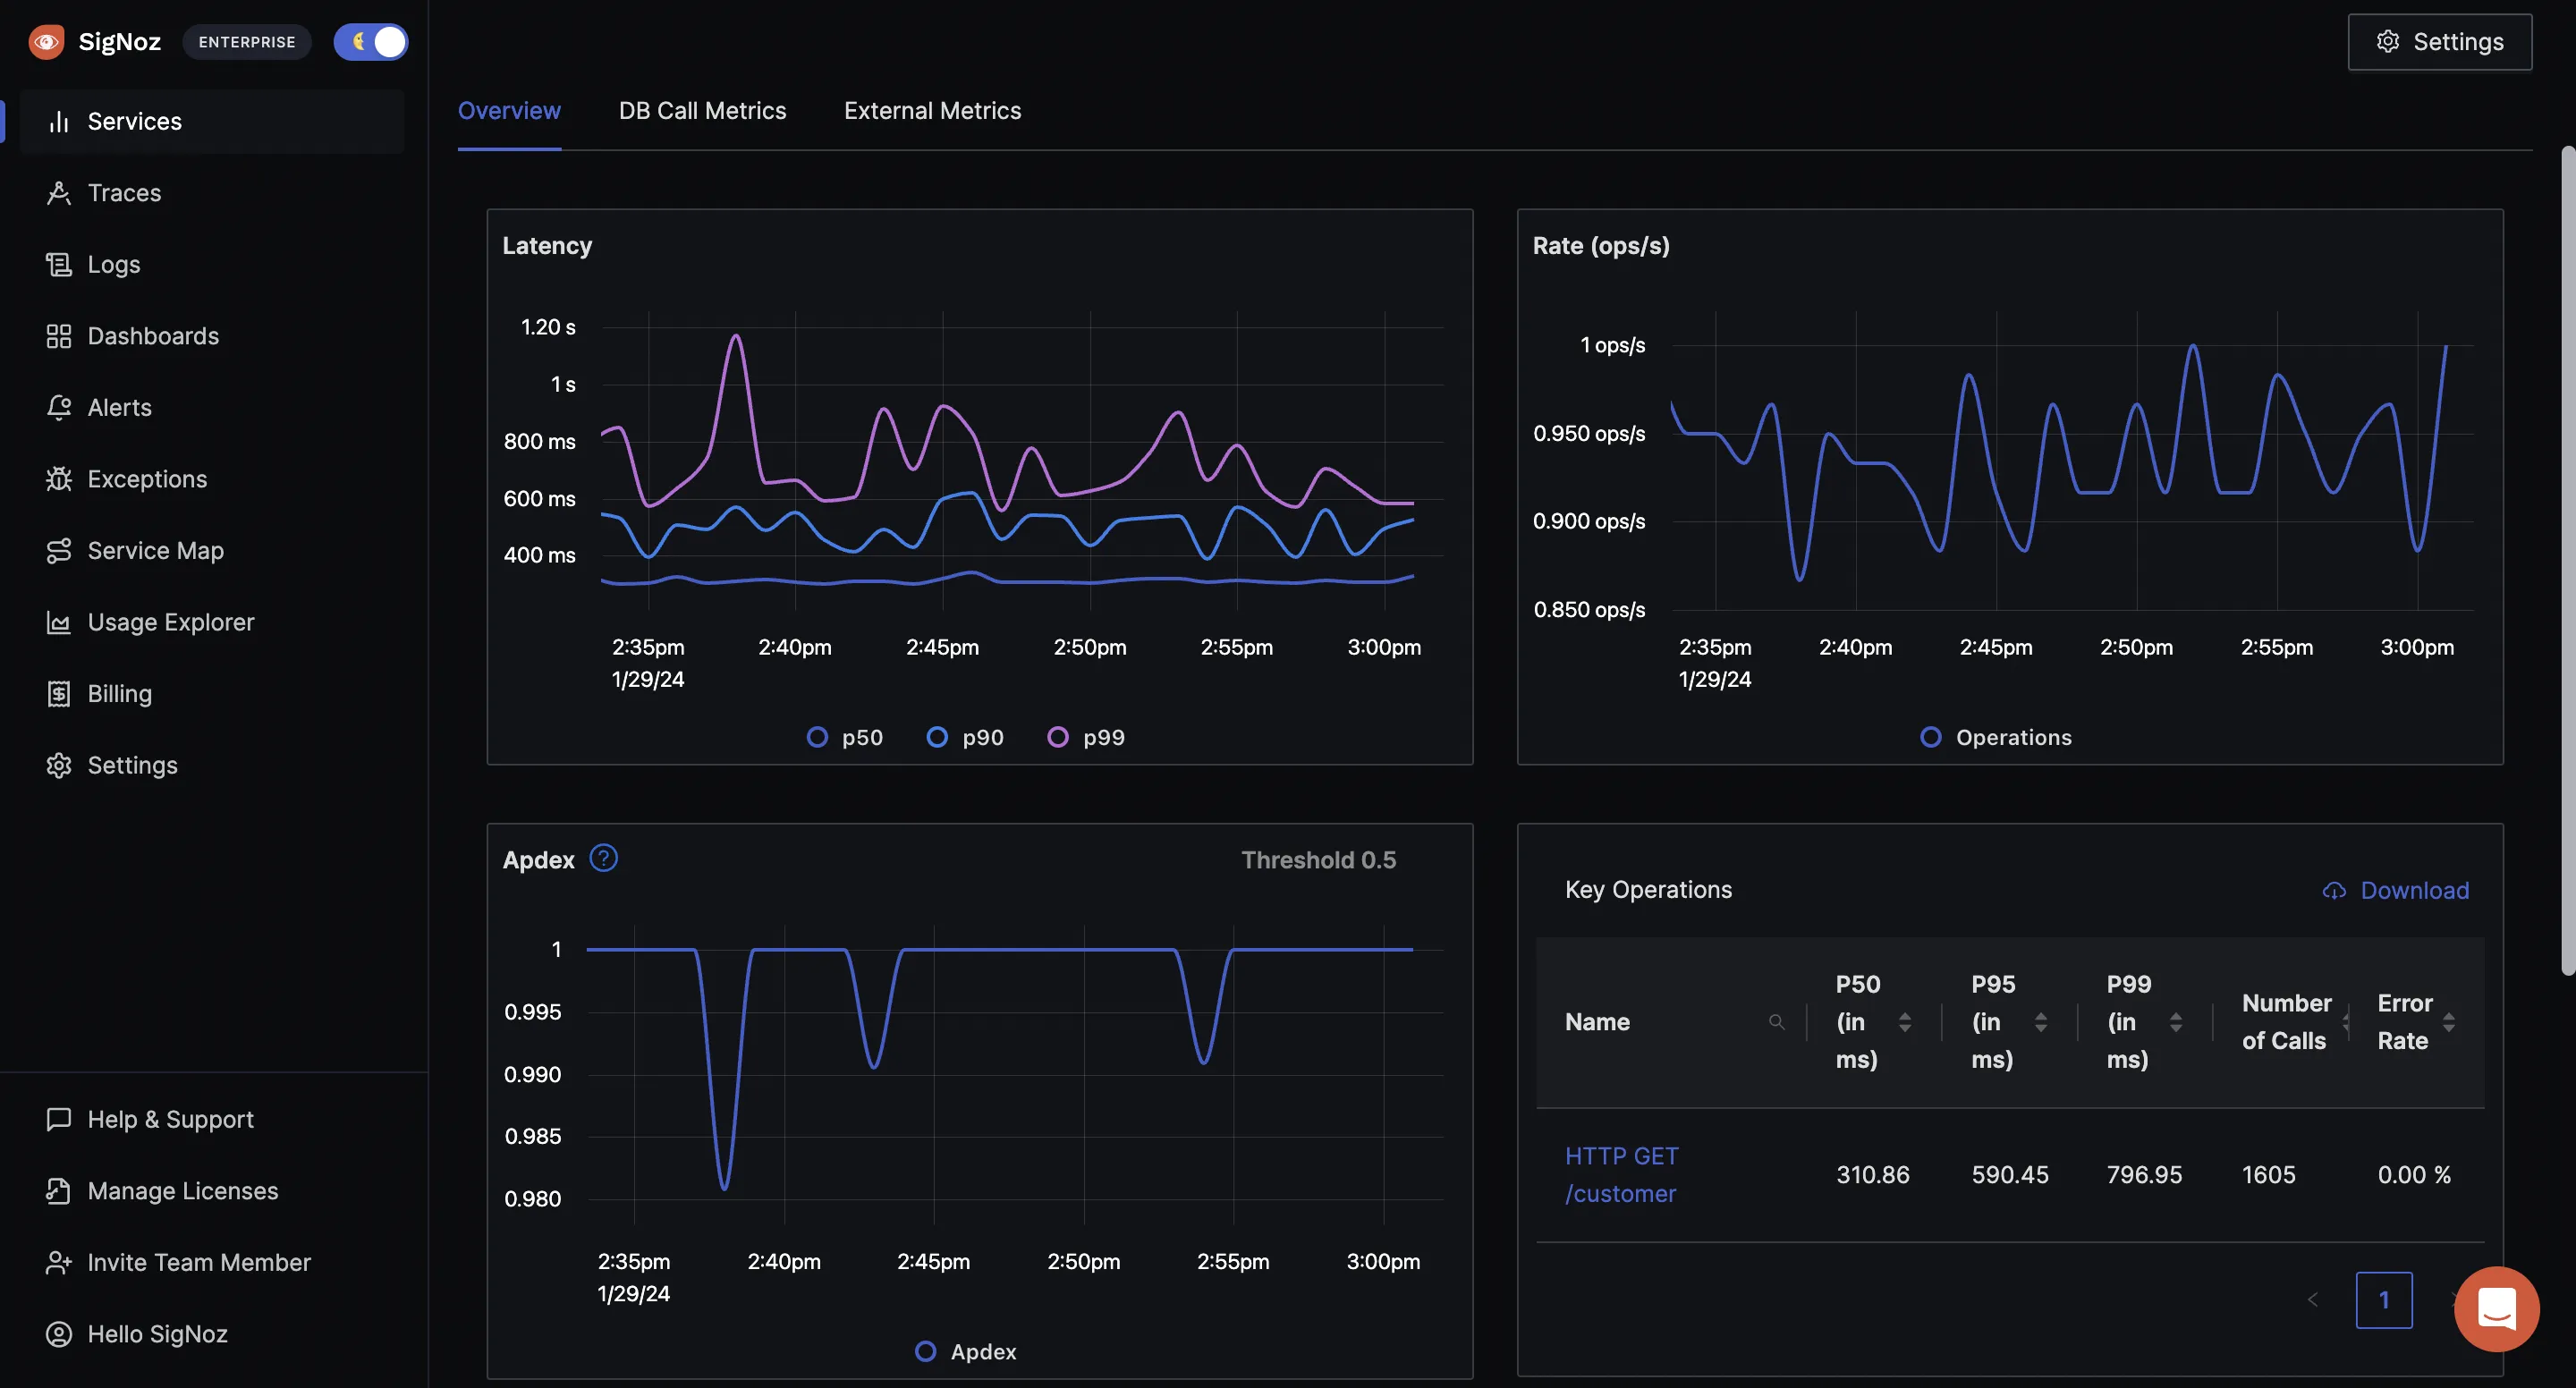
SigNoz provides query and visualization capabilities for the end-user and comes with out-of-box charts for application metrics and traces.
Now let’s get down to how to implement OpenTelemetry Nextjs libraries for a sample Nextjs application and then visualize the collected data in SigNoz.
Running a Nextjs application with OpenTelemetry
First of all, we need to install SigNoz for data collection then this data will be sent to OpenTelemetry for storage and visualization
Installing SigNoz
First, you need to install SigNoz so that OpenTelemetry can send the data to it.
SigNoz cloud is the easiest way to run SigNoz. Sign up for a free account and get 30 days of unlimited access to all features.
You can also decide to self-host SigNoz. It can be installed on macOS or Linux computers in just three steps by using a simple install script. The install script automatically installs Docker Engine on Linux. However, on macOS, you must manually install Docker Engine before running the install script.
git clone -b main https://github.com/SigNoz/signoz.git
cd signoz/deploy/
./install.sh
You can visit our documentation for instructions on how to install SigNoz using Docker Swarm and Helm Charts.
When you are done installing SigNoz, you can access the UI at http://localhost:3301
Creating a sample Nextjs application
To install and run a Nextjs application you need to have Nodejs 12.22.0 or later. You can also check the sample application at this GitHub repo.
Download the latest version of NodejsTo create a new Nextjs app, you can use create-next-app which sets up everything automatically for you.
Steps to get the app set up and ready:
Step 1: Create a project using any of these commands
npx create-next-app@latest
# or
yarn create next-app
# or
pnpm create next-app
Step2: Check if the application is running
Start the development server.
npm run dev
//or
yarn dev
//or
pnpm dev
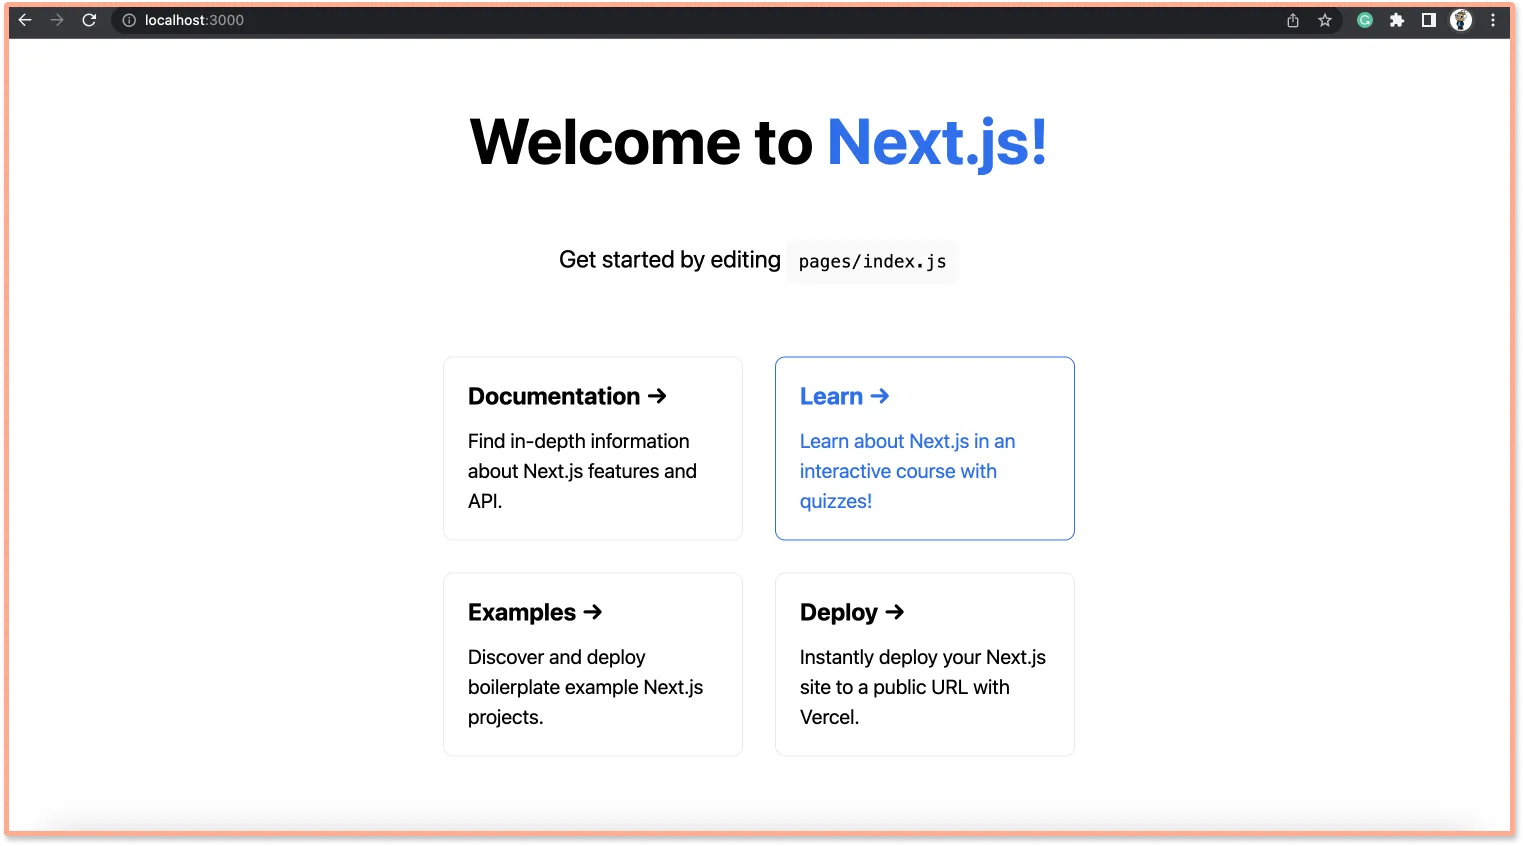
You can check if your app is up and running on http://localhost:3000
Instrumenting the Nextjs application with OpenTelemetry
Step 1: Install OpenTelemetry packages
You will need the following OpenTelemetry packages for this sample application.
npm i @opentelemetry/sdk-node
npm i @opentelemetry/auto-instrumentations-node
npm i @opentelemetry/exporter-trace-otlp-http
npm i @opentelemetry/resources
npm i @opentelemetry/semantic-conventions
Note: You can use yarn or npm as per the package manager that you’re using for the project
Step 2: Create a tracing.js file
Instantiate tracing by creating a tracing.js file and using the below code.
We are also setting up the IP of SigNoz backend in this file as http://localhost:4318/v1/traces. If you have installed SigNoz on a different machine other than your localhost, use the relevant IP.
'use strict'

const opentelemetry = require('@opentelemetry/sdk-node');
const { getNodeAutoInstrumentations } = require('@opentelemetry/auto-instrumentations-node');
const { OTLPTraceExporter } = require('@opentelemetry/exporter-trace-otlp-http');


const { Resource } = require('@opentelemetry/resources');
const { SemanticResourceAttributes } = require('@opentelemetry/semantic-conventions');

// custom nextjs server
const { startServer } = require('./server');

// configure the SDK to export telemetry data to the console
// enable all auto-instrumentations from the meta package
const exporterOptions = {
  url: 'http://localhost:4318/v1/traces',
 }
const traceExporter = new OTLPTraceExporter(exporterOptions);
const sdk = new opentelemetry.NodeSDK({
  resource: new Resource({
    [SemanticResourceAttributes.SERVICE_NAME]: 'SigNoz-Nextjs-Example'
  }),
  traceExporter,
  instrumentations: [getNodeAutoInstrumentations()]
});

// initialize the SDK and register with the OpenTelemetry API
// this enables the API to record telemetry
sdk.start()

// gracefully shut down the SDK on process exit
process.on('SIGTERM', () => {
  sdk.shutdown()
    .then(() => console.log('Tracing terminated'))
    .catch((error) => console.log('Error terminating tracing', error))
    .finally(() => process.exit(0));
});

module.exports = sdk
About environment variables:
service_name: name of the service you want to monitor
http://localhost:4318/v1/traces is the default url for sending your tracing data. We are assuming you have installed SigNoz on your localhost. Based on your environment, you can update it accordingly. It should be in the following format:
http://<IP of SigNoz backend>:4318/v1/traces
Remember to allow incoming requests to port 4318 of machine where SigNoz backend is hosted.
Now we will have to create the server.js file that we have imported into the tracing.js file.
Step 3: Create a custom Nextjs server
Create a server.js file in the source folder using the following code.
const { createServer } = require("http")
const { parse } = require("url")
const next = require("next")

const dev = process.env.NODE_ENV !== "production"
const app = next({ dev })
const handle = app.getRequestHandler()

module.exports = {
  startServer: async function startServer() {
    return app.prepare().then(() => {
      createServer((req, res) => {
        const parsedUrl = parse(req.url, true)
        handle(req, res, parsedUrl)
      }).listen(8080, (err) => {
        if (err) throw err
        console.log("> Ready on http://localhost:8080")
      })
    })
  },
}
You can use whichever port is available, for this example we’ve used port 8080.
Step 4: Adding the script to start the server
Now we will have to run the server in order to trace the data,
In the package.json, let’s create a new script npm run start:server or yarn start:server and point that you node tracing.js.
With this scripts JSON in the package.json file looks something like this.
"scripts": {
    "dev": "next dev",
    "build": "next build",
    "start:server": "node tracing.js",
    "lint": "next lint"
  }
Step 5: Run the server and monitor the application
Run the application using npm run start:server or yarn start:server , and your application should be available on http://localhost:8080 .
Hit the URL a couple of times to generate some dummy data and wait for the SigNoz-Nextjs-Example application to be visible on the SigNoz dashboard.
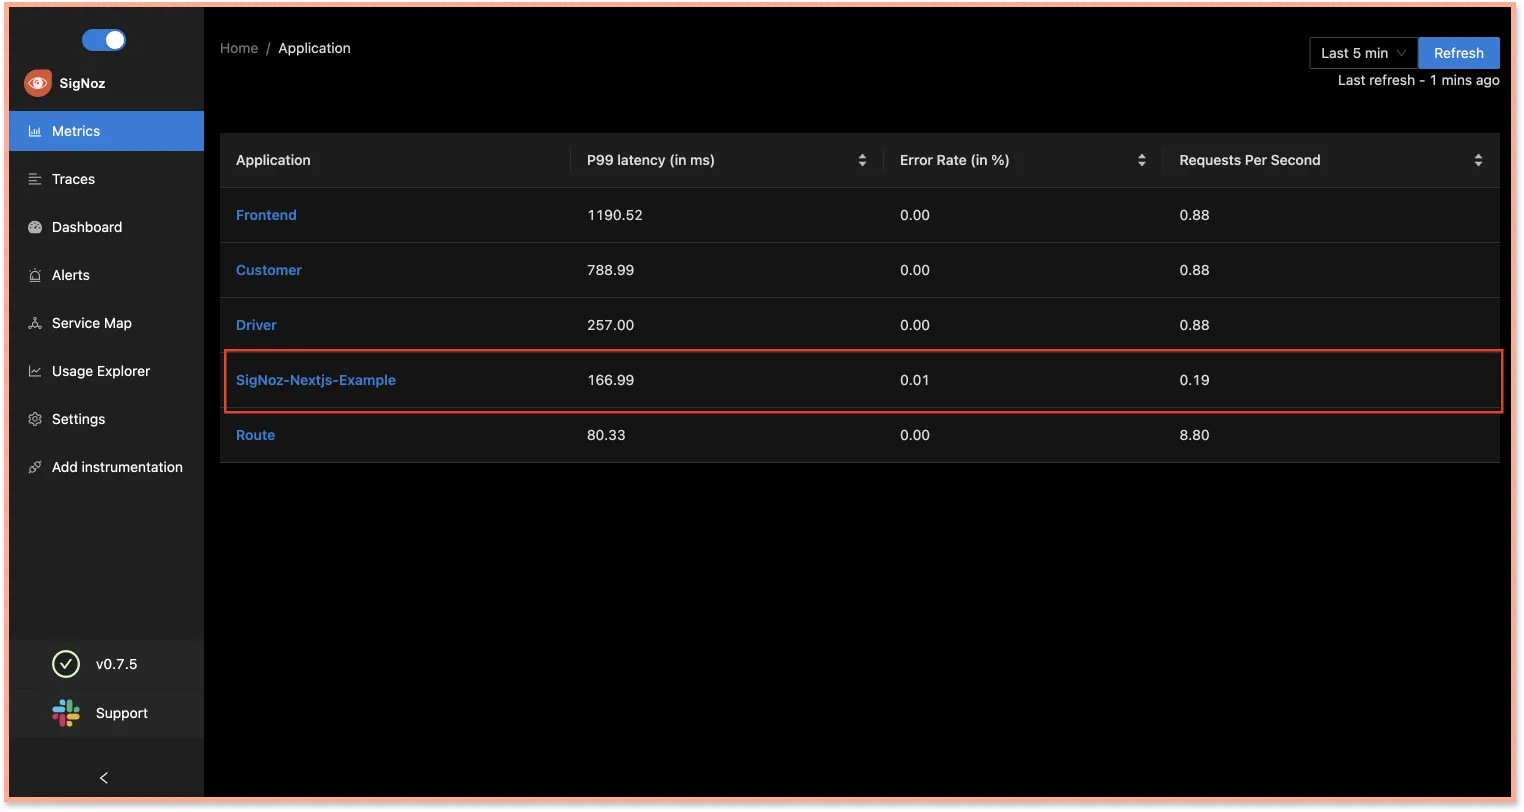
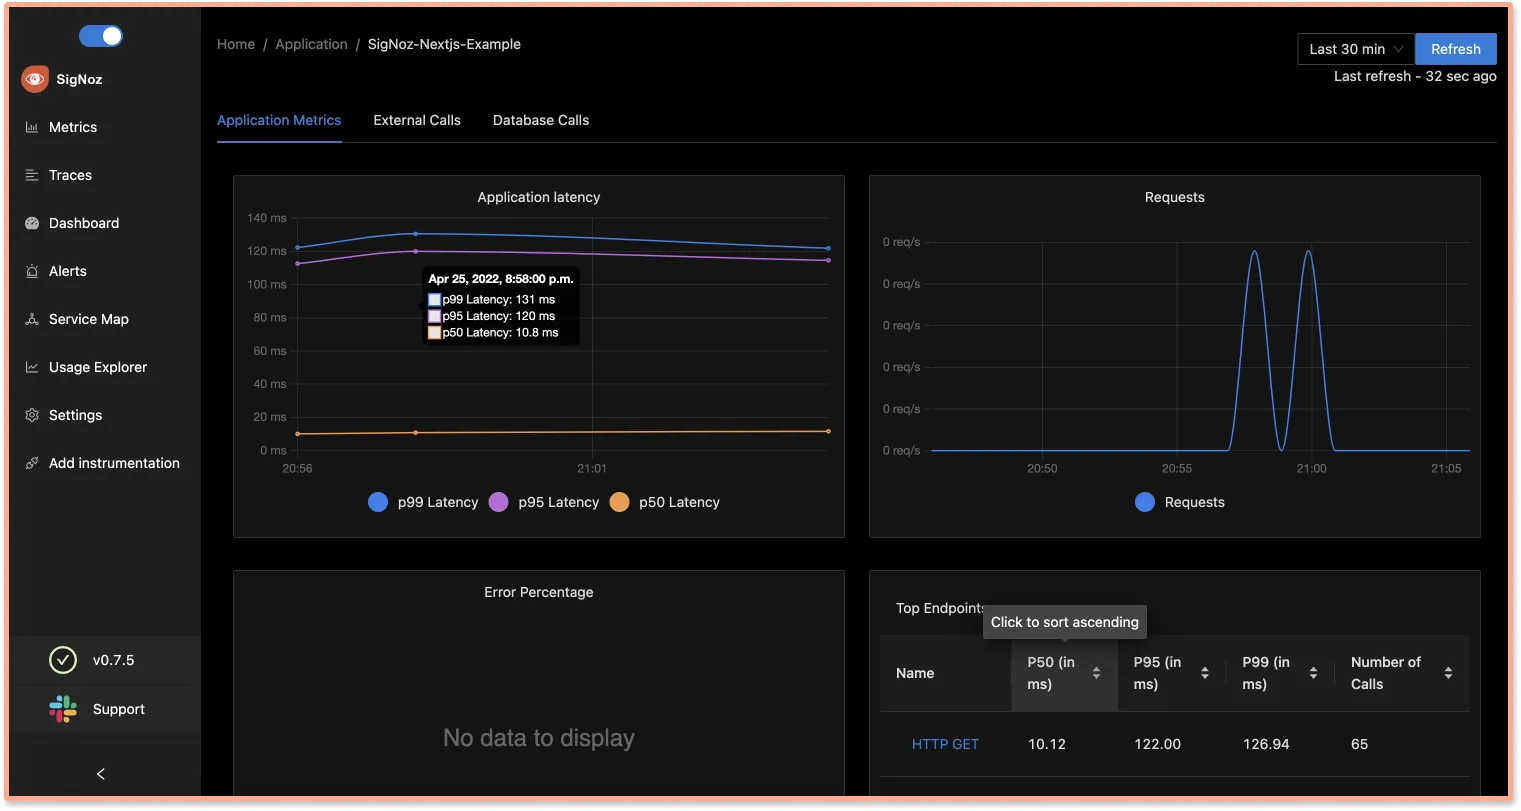
You can use the dashboard to see application metrics like application latency, requests per sec, and error percentage.
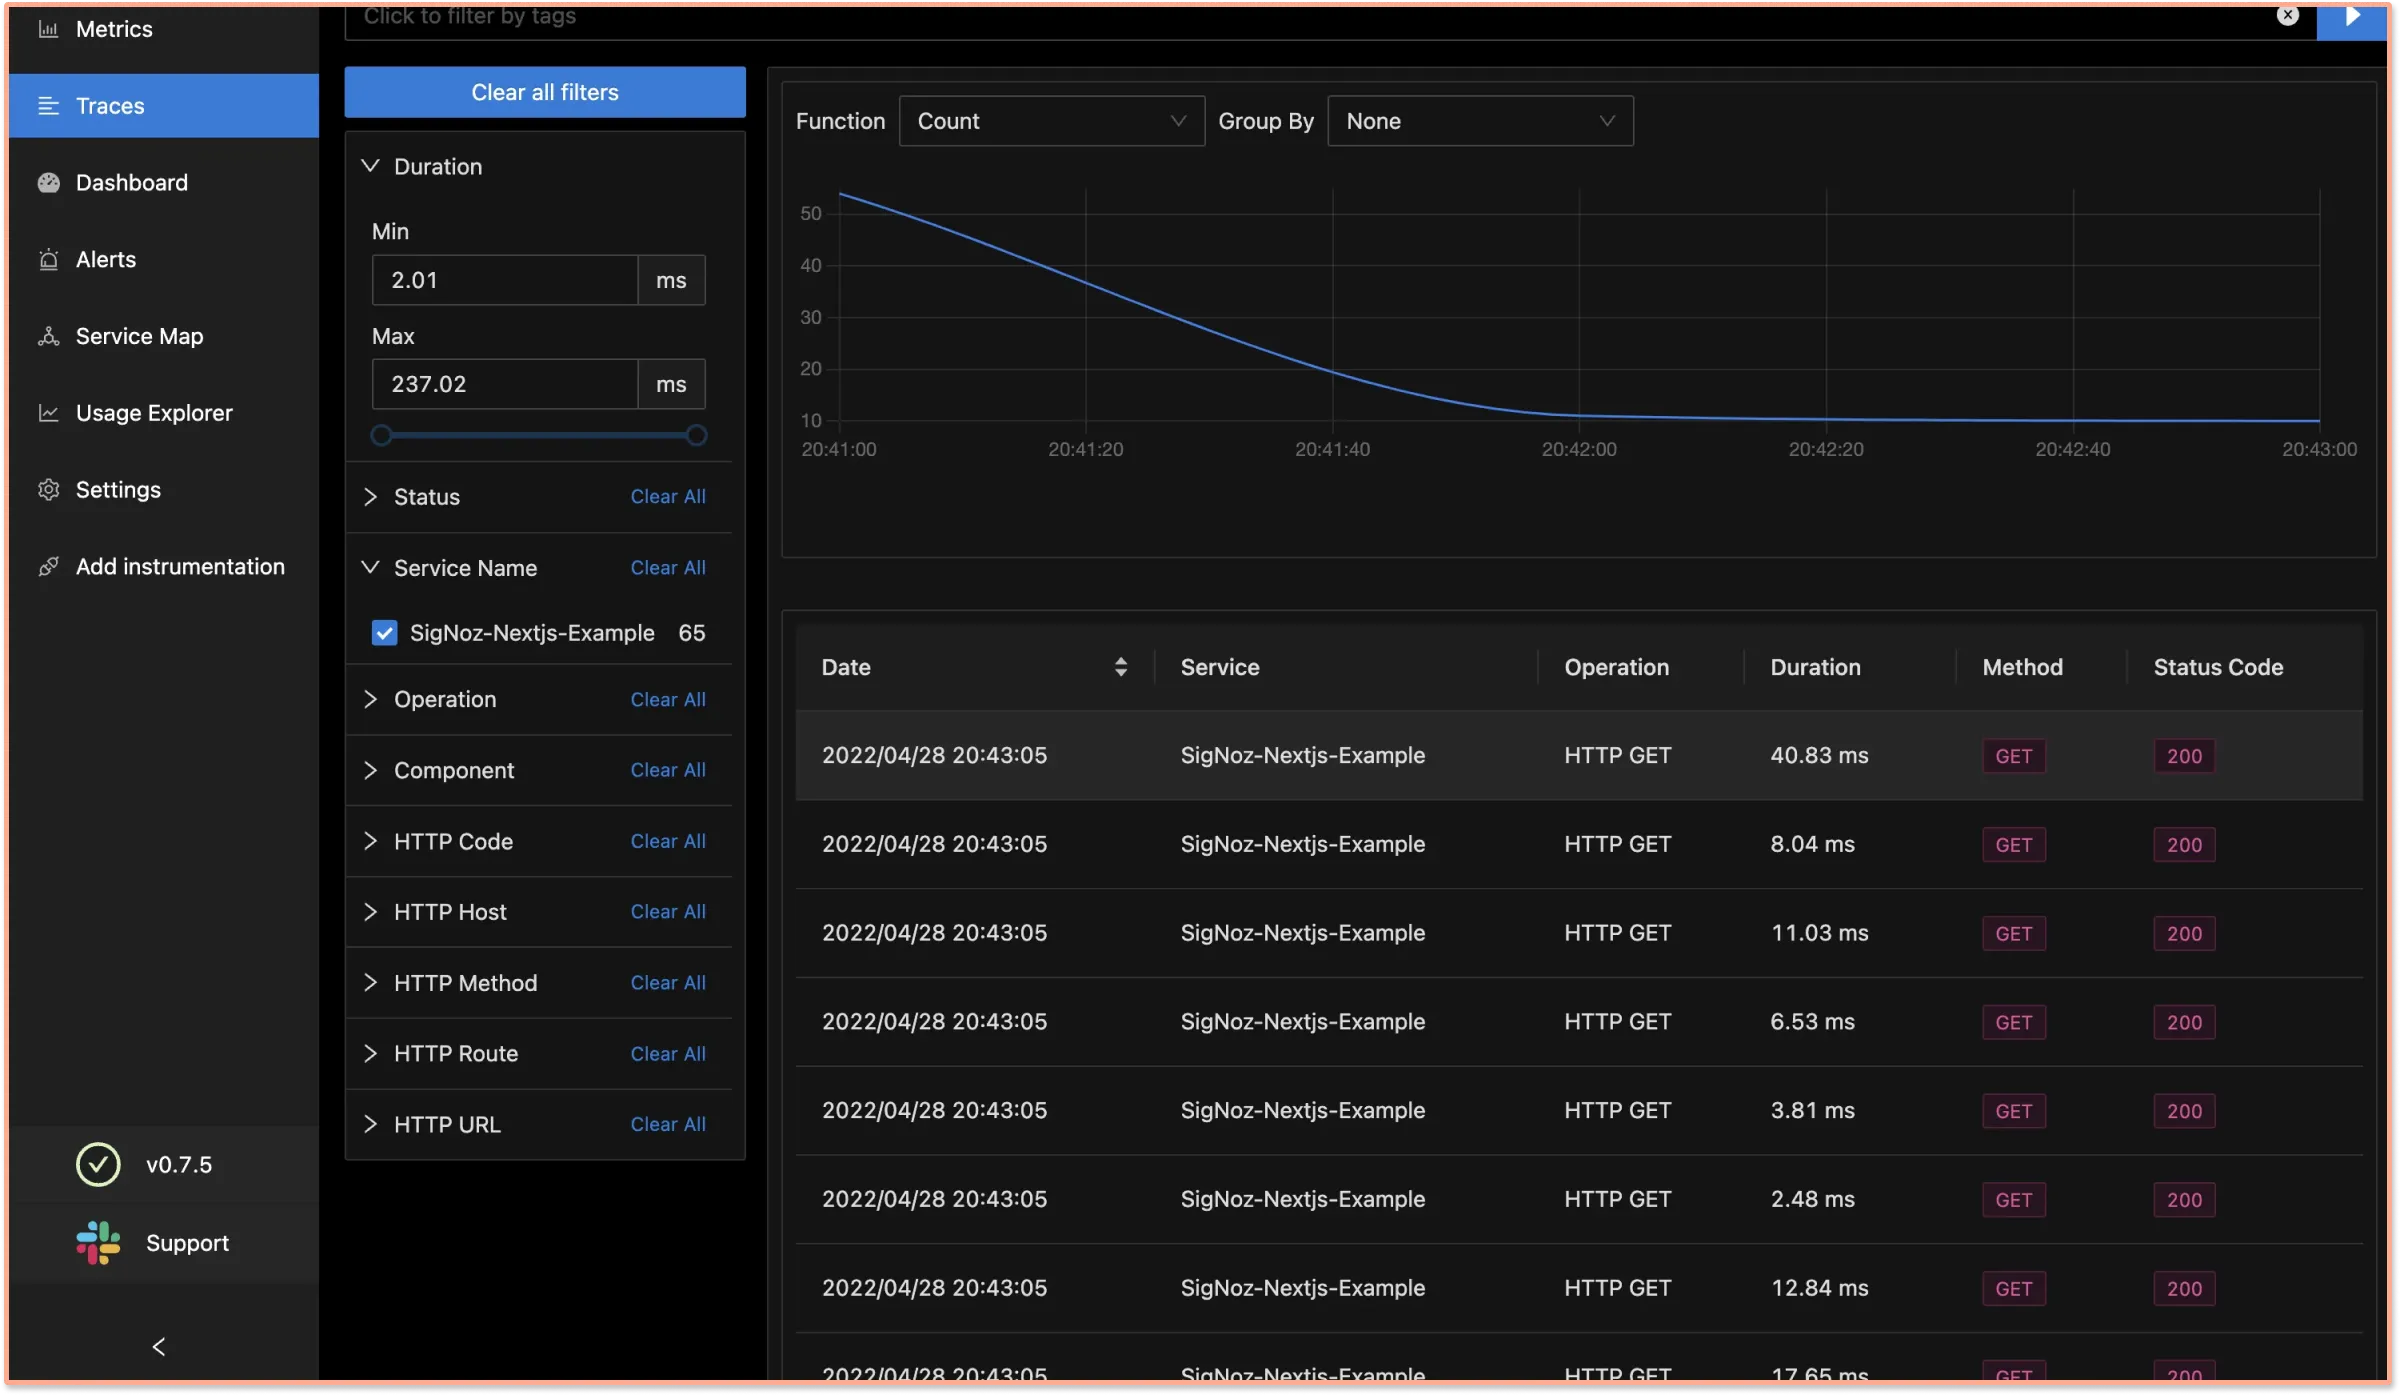
OpenTelemetry captures tracing data from your Nextjs application as well. Tracing data can help you visualize how user requests perform across services in a multi-service application.
In the Traces tab of SigNoz, you can analyze the tracing data using filters based on tags, status codes, service names, operations, etc.
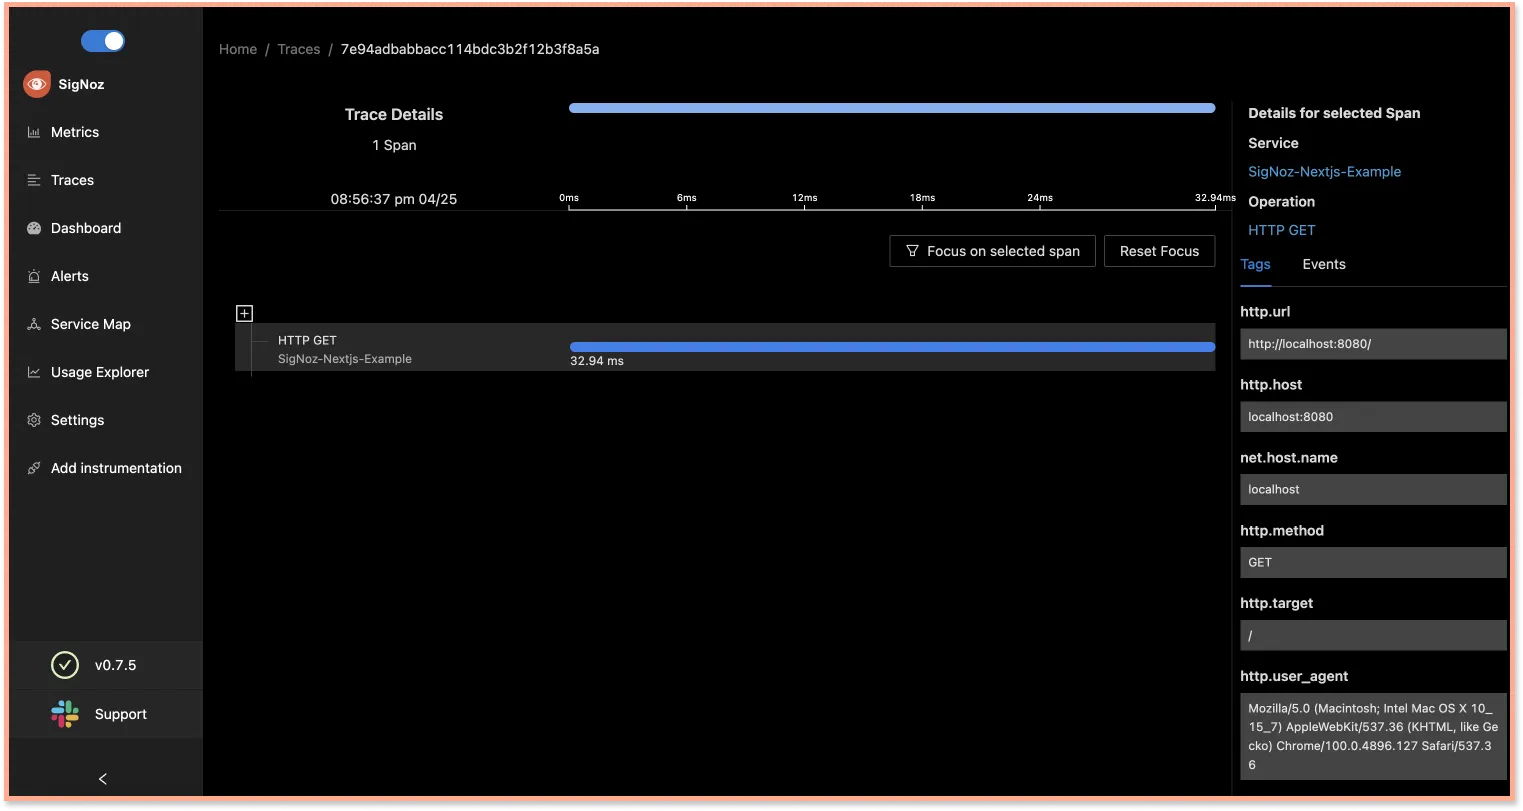
You can also visualize the tracing data with the help of flamegraphs and Gantt charts. These visualizations makes it easier for users to see how requests performed acrosee different services in a multi-service application.
Conclusion
Using OpenTelemetry libraries, you can instrument your Nextjs applications for end-to-end tracing. You can then use an open-source APM tool like SigNoz to ensure the smooth performance of your Nextjs application.
OpenTelemetry is the future for setting up observability for cloud-native apps. It is backed by a huge community and covers a wide variety of technology and frameworks. Using OpenTelemetry, engineering teams can instrument polyglot and distributed applications and be assured about compatibility with a lot of technologies.
SigNoz is an open-source observability tool that comes with a SaaS-like experience. You can check out SigNoz by visiting its GitHub repo 👇
If you are someone who understands more from video, then you can watch the below video tutorial on the same with SigNoz.

If you face any issues while trying out SigNoz, you can reach out with your questions in #support channel 👇
Further Reading
Implementing OpenTelemetry in Angular application
Monitor your Nodejs application with OpenTelemetry and SigNoz


