OpenTelemetry Nestjs Tracing Implementation Guide [2024 Updated]
Nestjs is a Nodejs framework for building scalable server-side applications with typescript. It makes use of frameworks like Express and Fastify to enable rapid development. It has gained wide popularity in recent times, and many applications are making use of the Nestjs framework. Using OpenTelemetry client libraries, you can monitor your Nestjs application.
Monitoring your Nestjs application is critical for performance management. But setting up monitoring for Nestjs applications can get cumbersome requiring multiple libraries and patterns. That's where Opentelemetry comes in.
OpenTelemetry is the leading open-source standard for instrumenting your code to generate telemetry data that can be a one-stop solution for monitoring Nestjs applications.
OpenTelemetry is a set of tools, APIs, and SDKs used to instrument applications to create and manage telemetry data(Logs, metrics, and traces). It aims to make telemetry data(logs, metrics, and traces) a built-in feature of cloud-native software applications.
One of the biggest advantages of using OpenTelemetry is that it is vendor-agnostic. It can export data in multiple formats, which you can send to a backend of your choice.
In this article, we will use SigNoz as a backend. SigNoz is an open-source APM tool that supports OpenTelemetry data natively.
Let's get started and see how to use OpenTelemetry for a Nestjs application.
Running a Nestjs application with OpenTelemetry
First, you need to create a SigNoz account. Data collected by OpenTelemetry will be sent to SigNoz for storage and visualization.
Setting up SigNoz
You need a backend to which you can send the collected data for monitoring and visualization. SigNoz is an OpenTelemetry-native APM that is well-suited for visualizing OpenTelemetry data.
SigNoz cloud is the easiest way to run SigNoz. You can sign up here for a free account and get 30 days of unlimited access to all features.
You can also install and self-host SigNoz yourself. Check out the docs for installing self-host SigNoz.
Instrumenting a sample Nestjs application with OpenTelemetry
For instrumenting a Nestjs application with OpenTelemetry, you need to install the required OpenTelemetry packages first. Steps involved in instrumenting a Nestjs application with OpenTelemetry are as follows:
Step 1: Install OpenTelemetry packages
npm install --save @opentelemetry/api@^1.6.0
npm install --save @opentelemetry/sdk-node@^0.45.0
npm install --save @opentelemetry/auto-instrumentations-node@^0.39.4
npm install --save @opentelemetry/exporter-trace-otlp-http@^0.45.0
Step 2. Create a tracer.ts file
You need to configure the endpoint for SigNoz cloud in this file.
"use strict";

import { getNodeAutoInstrumentations } from "@opentelemetry/auto-instrumentations-node";
import { OTLPTraceExporter } from "@opentelemetry/exporter-trace-otlp-http";
import { Resource } from "@opentelemetry/resources";
import * as opentelemetry from "@opentelemetry/sdk-node";
import { SemanticResourceAttributes } from "@opentelemetry/semantic-conventions";

// Configure the SDK to export telemetry data to the console
// Enable all auto-instrumentations from the meta package
const exporterOptions = {
  url: 'https://ingest.{region}.signoz.cloud:443/v1/traces',
};

const traceExporter = new OTLPTraceExporter(exporterOptions);
const sdk = new opentelemetry.NodeSDK({
  traceExporter,
  instrumentations: [getNodeAutoInstrumentations()],
  resource: new Resource({
    [SemanticResourceAttributes.SERVICE_NAME]: "sample-nestjs-app",
  }),
});

// initialize the SDK and register with the OpenTelemetry API
// this enables the API to record telemetry
sdk.start();

// gracefully shut down the SDK on process exit
process.on("SIGTERM", () => {
  sdk
    .shutdown()
    .then(() => console.log("Tracing terminated"))
    .catch((error) => console.log("Error terminating tracing", error))
    .finally(() => process.exit(0));
});

export default sdk;
OpenTelemetry Node SDK currently does not detect the OTEL_RESOURCE_ATTRIBUTES from .env files as of today. That’s why we need to include the variables in the tracing.js file itself.
About environment variables:
service_name: name of the service you want to monitor
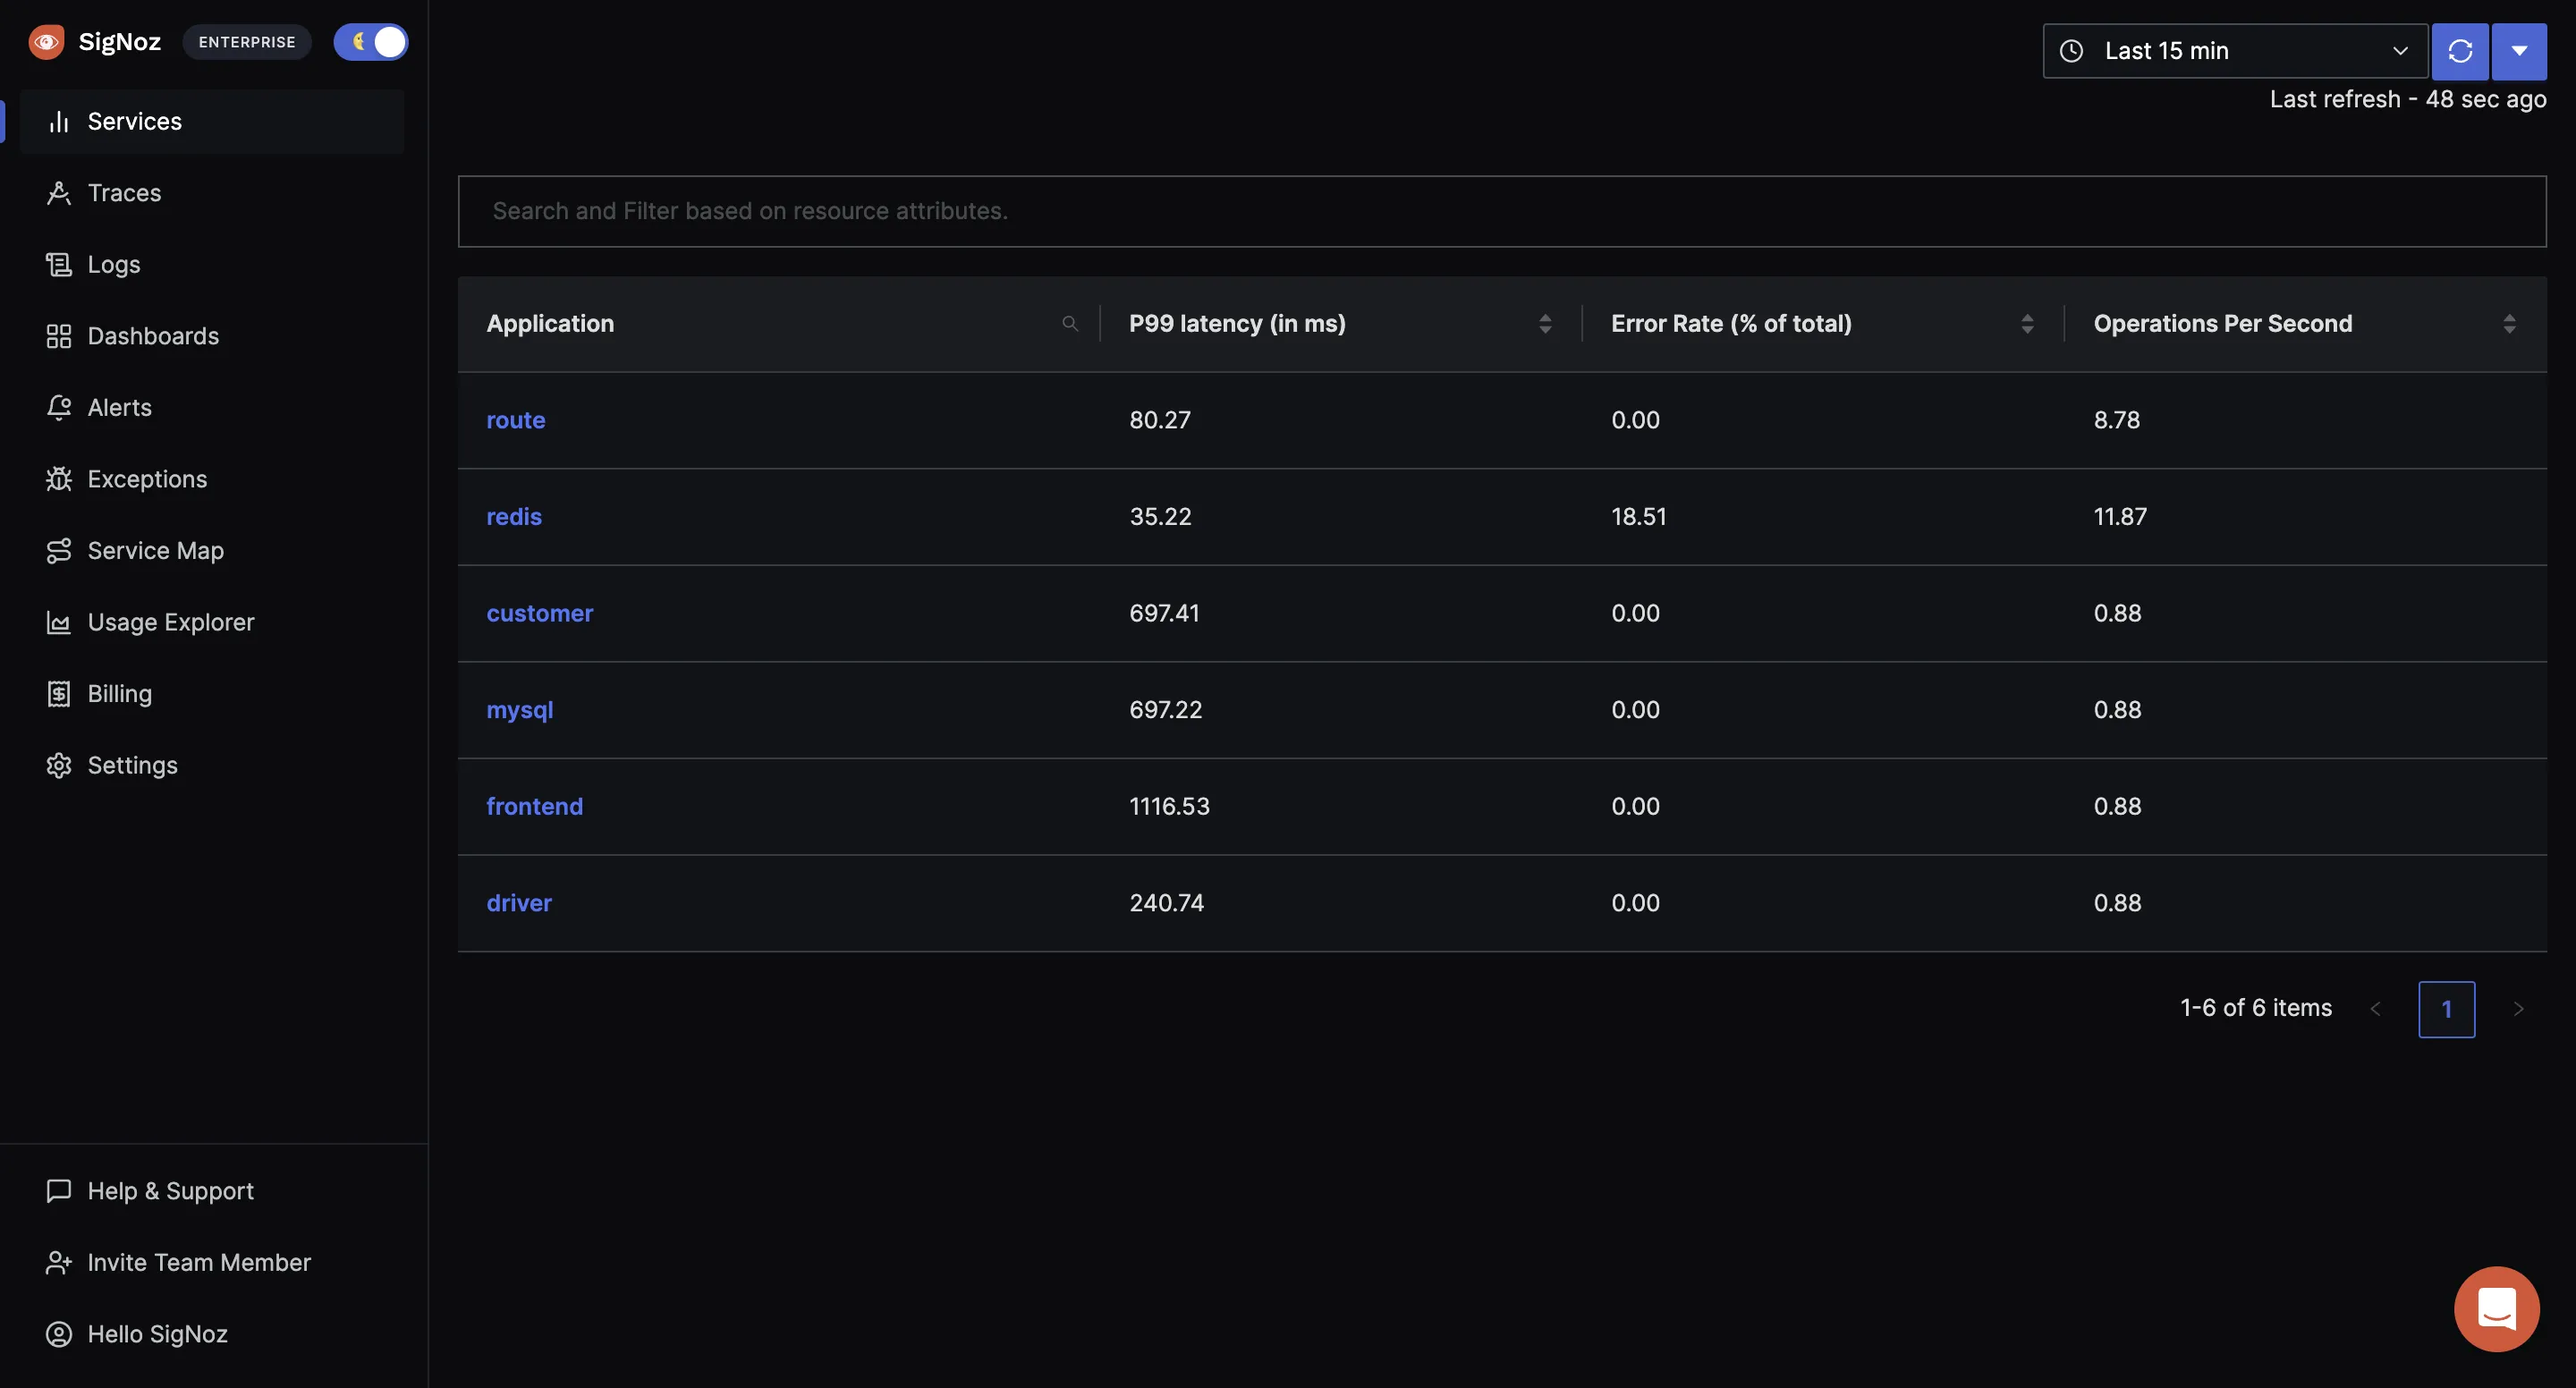
https://ingest.{region}.signoz.cloud:443/v1/traces is the default url for sending your tracing data to SigNoz cloud. {region} will be your SigNoz data region. You can find these details in SigNoz dashboard under settings --> ingestion settings.
For creating the tracer.ts file for SigNoz self-host, refer to this doc.
Step 3: Import the tracer module where your app starts
On main.ts file or file where your app starts import tracer using below command.
The below import should be the first line in the main file of your application (Ex -> main.ts)
import tracer from "./tracer";
Here's a sample main application importing tracer.ts:
import tracer from "./tracer";
import { NestFactory } from "@nestjs/core";
import { AppModule } from "./app.module";

// All of your application code and any imports that should leverage
// OpenTelemetry automatic instrumentation must go here.

async function bootstrap() {
  await tracer.start();

  const app = await NestFactory.create(AppModule);
  await app.listen(3001);
}
bootstrap();
Step 4: Start the tracer
await tracer.start();
Step 5. Run your application
You can run your application using the following command:
OTEL_EXPORTER_OTLP_HEADERS="signoz-access-token=<SIGNOZ_INGESTION_KEY>" nest start
You can find your ingestion key in the SigNoz dashboard.
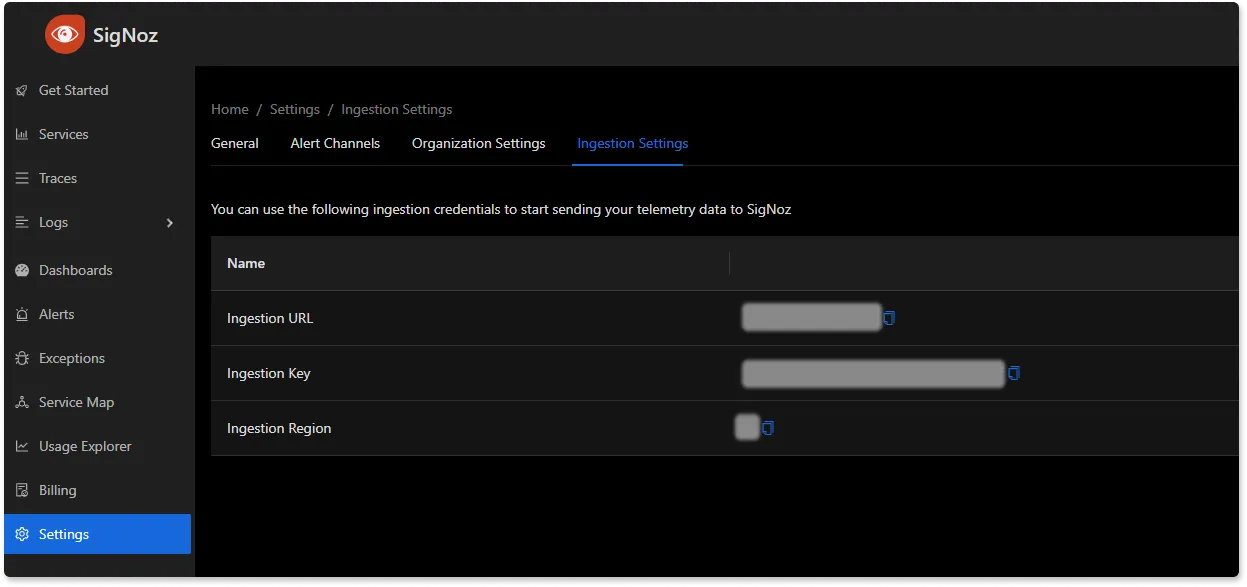
The data captured with OpenTelemetry from your application should start showing on the SigNoz dashboard. You need to generate some load in order to see data reported on SigNoz dashboard. Refresh your application for 10-20 times, and wait for 2-3 mins.
You can check out a sample Nestjs application already instrumented with OpenTelemetry here:
If you run this app, you can find a sample-nestjs-app in the list of applications monitored with SigNoz.
Monitor your Nestjs OpenTelemetry data in SigNoz
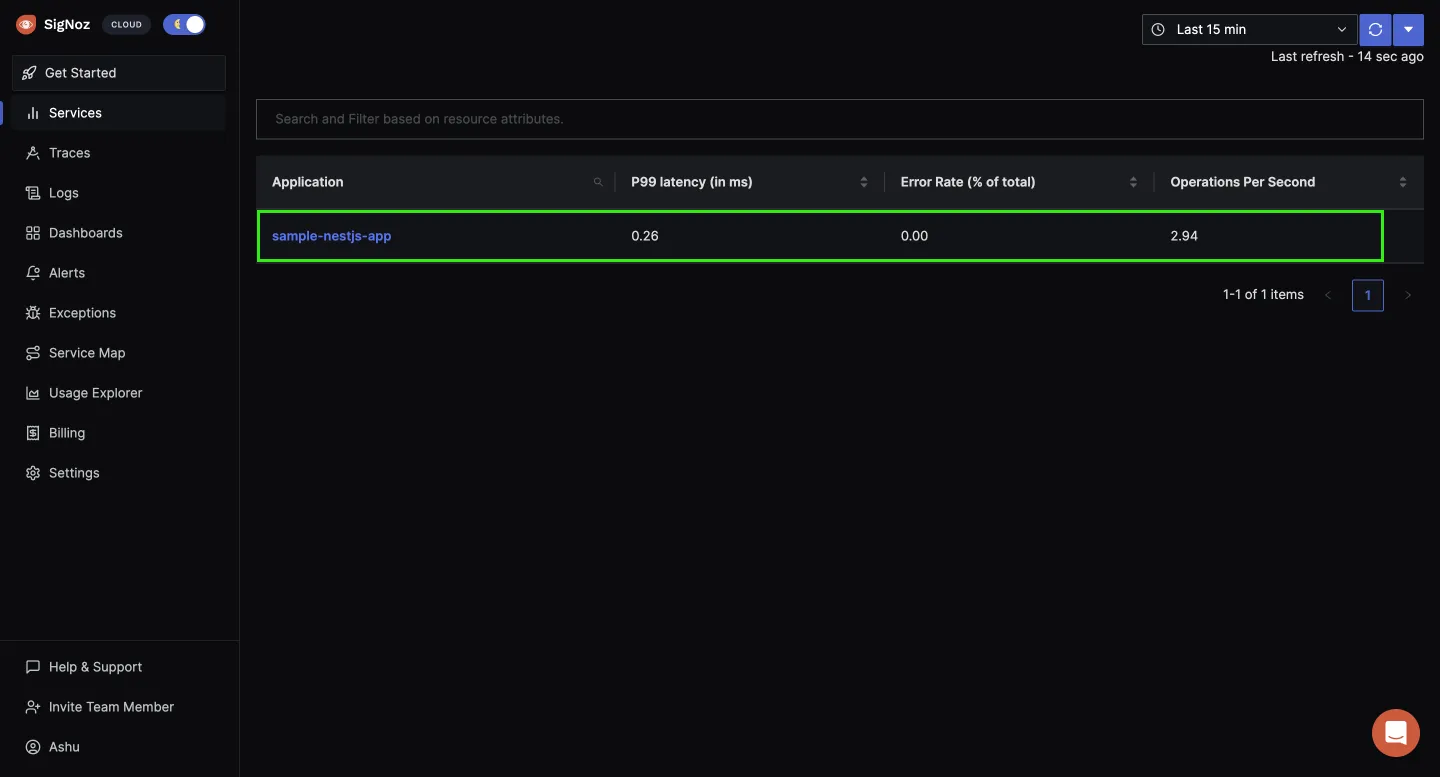
SigNoz makes it easy to visualize metrics and traces captured through OpenTelemetry instrumentation.
SigNoz comes with out of box RED metrics charts and visualization. RED metrics stands for:
- Rate of requests
- Error rate of requests
- Duration taken by requests
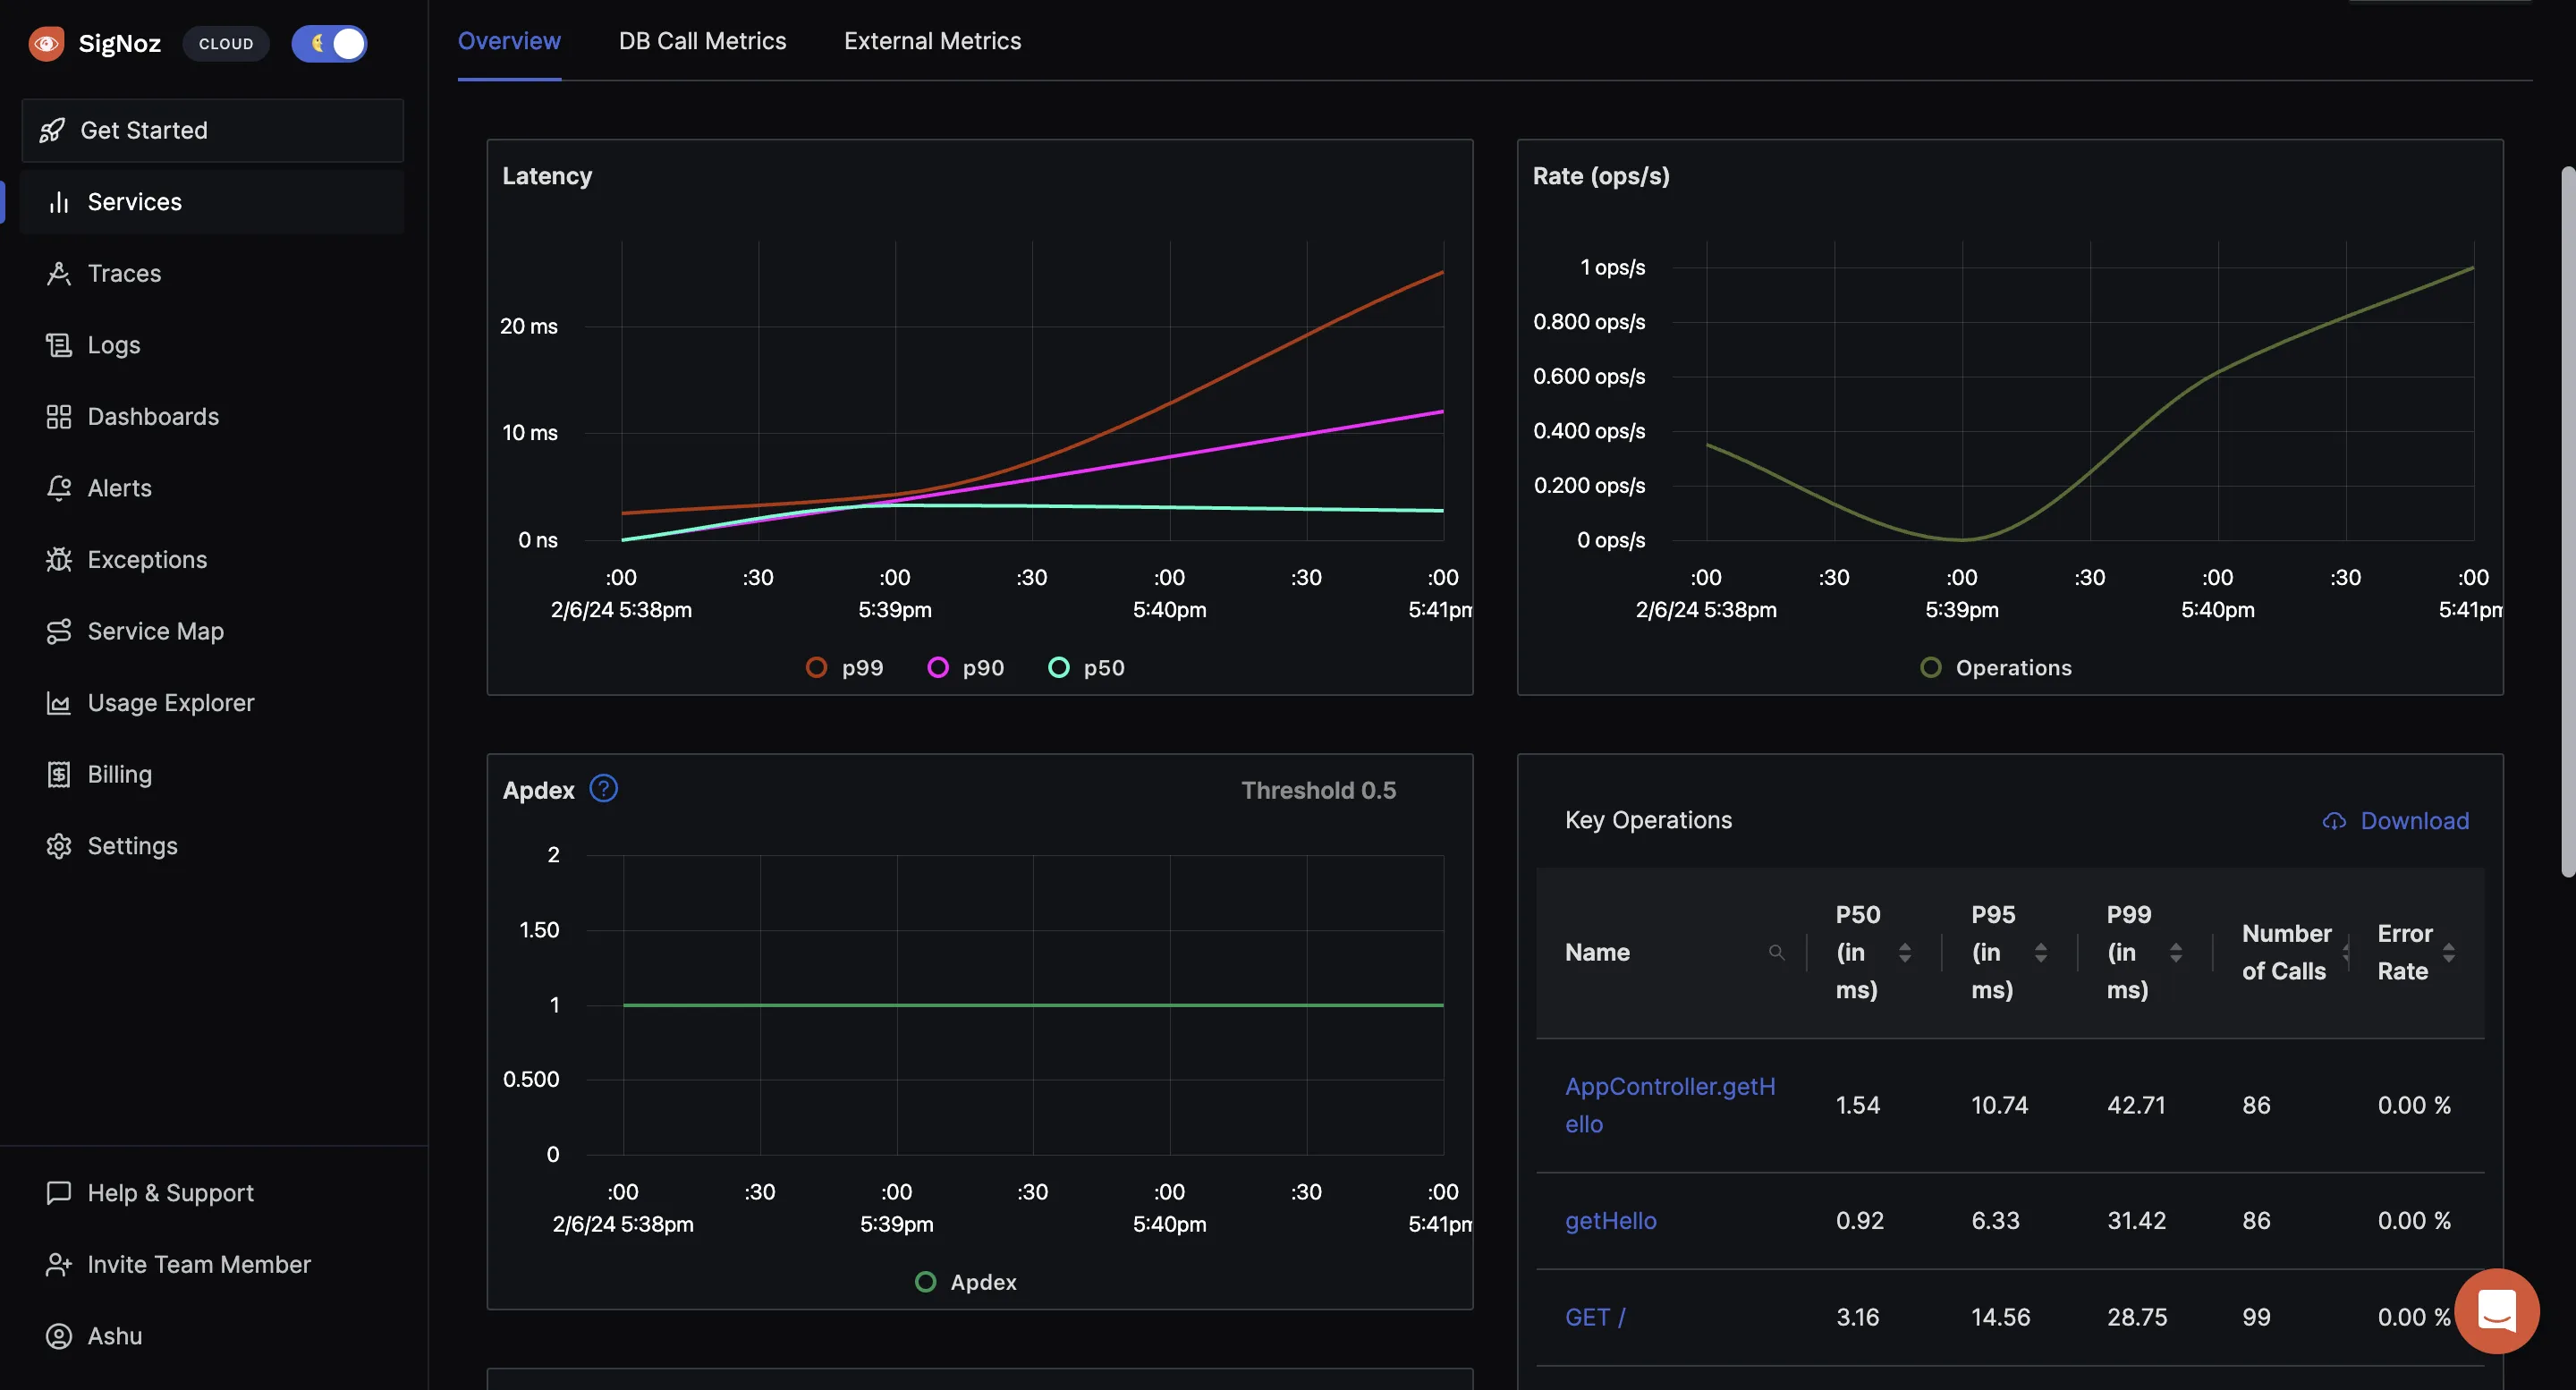
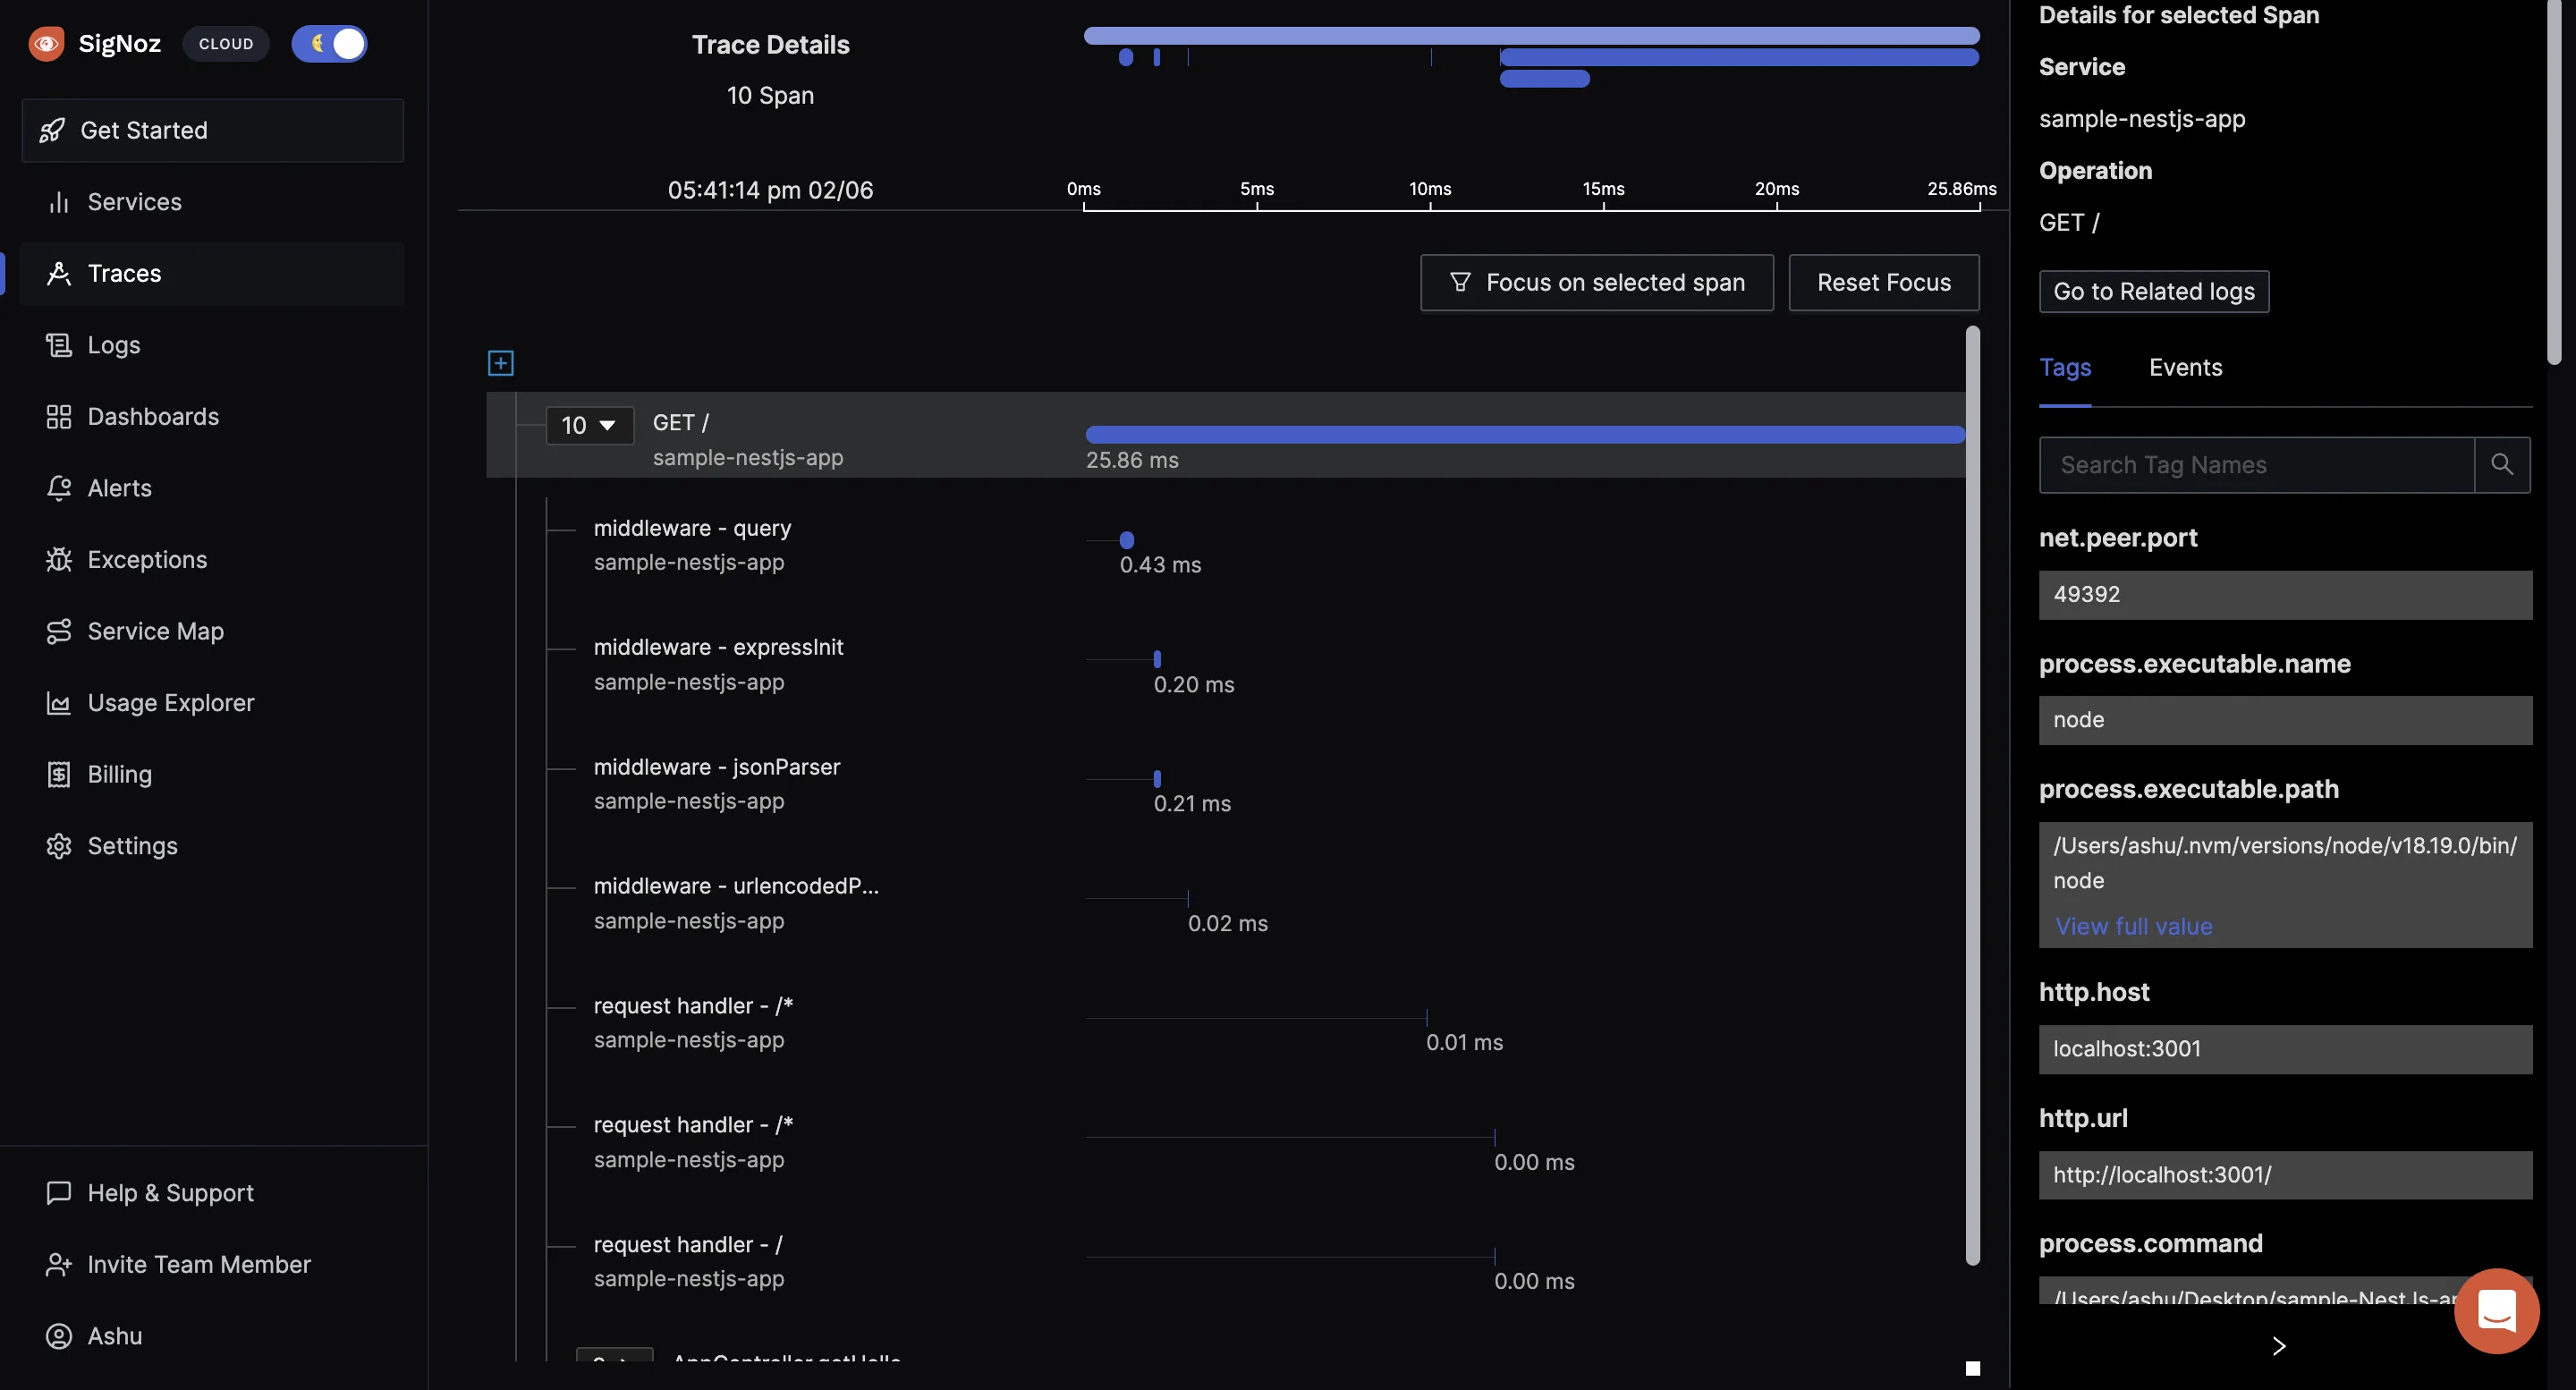
You can then choose a particular timestamp where latency is high to drill down to traces around that timestamp. You can use flamegraphs to exactly identify the issue causing the latency.
Conclusion
OpenTelemetry makes it very convenient to instrument your Nestjs application. You can then use an open-source APM tool like SigNoz to analyze the performance of your app. As SigNoz offers a full-stack observability tool, you don't have to use multiple tools for your monitoring needs.
SigNoz cloud is the easiest way to run SigNoz. Sign up for a free account and get 30 days of unlimited access to all features.
You can also install and self-host SigNoz yourself since it is open-source. With 16,000+ GitHub stars, open-source SigNoz is loved by developers. Find the instructions to self-host SigNoz.
If you want to read more about SigNoz 👇


