How to Collect .NET Application Logs with OpenTelemetry
In the realm of modern software development, achieving true observability is paramount for understanding application behavior and performance. This demonstration focuses on a .NET application that harnesses the capabilities of OpenTelemetry to seamlessly integrate logging and tracing functionalities. OpenTelemetry, a key player in the Cloud Native Computing Foundation, provides a unified framework for comprehensive observability.
In this tutorial, we cover:
- What is OpenTelemetry?
- Logging in .NET Applications
- Logging with Opentelemetry
- Setting up Logging with OpenTelemetry
- Correlating Logs With Traces
- Troubleshooting
- Conclusion
- Further Reading
If you want to jump straight into implementation, start with this prerequisites section.
In this showcase, we'll guide you through the process of instrumenting a .NET application with OpenTelemetry, covering both logging and tracing aspects. Witness how logging captures critical execution details while tracing allows you to follow request flows across different components. We'll illustrate the effortless integration of OpenTelemetry with the SigNoz Cloud platform. By the end, you'll have a clear understanding of how OpenTelemetry enhances application observability, providing valuable insights into performance and behavior.
What is OpenTelemetry?
OpenTelemetry is an open-source observability framework that enables developers to collect, process, and export telemetry data from their applications, systems, and infrastructure. It provides a unified API and SDKs in multiple programming languages for capturing telemetry data such as traces, metrics, and logs from telemetry sources such as applications and platforms. With OpenTelemetry, developers can instrument their applications with ease and flexibility, and then send the collected data to various backends for analysis and visualization. The framework is highly customizable, extensible, and vendor-agnostic, allowing users to choose their preferred telemetry collection and analysis tools.Logging in .NET Applications
Logging is an integral aspect of software development, providing developers with valuable insights into the behavior of their applications. In the realm of .NET development, robust logging mechanisms are essential for effective debugging, performance monitoring, and issue resolution. There are popular logging frameworks in .Net like Log4Net and Serilog, which help the developer provide logging levels, configuration, and best practices.
In addition to these frameworks, .NET introduces the ILogger interface as a built-in logging mechanism, offering developers a standardized and versatile way to implement logging in their applications. This interface seamlessly integrates with various logging providers, adding a layer of consistency to logging practices.
Whether you are a seasoned developer or just starting your journey in .NET, understanding the nuances of logging is crucial for building resilient and maintainable applications. As we navigate through logging levels, configuration practices, and industry best practices, we will also explore the role of the ILogger interface in enhancing logging capabilities within .NET applications.
Logging with Opentelemetry
In OpenTelemetry, any data that is not part of a distributed trace or a metric is a log. For example, events are a specific type of log. Logs often contain detailed debugging/diagnostic info, such as inputs to an operation, the result of the operation, and any supporting metadata for that operation.
The Microsoft.Extensions.Logging library provides native support for logging in .NET applications. Developers can utilize the simple and extensible logging API provided by this library to log messages of varying severity levels, filter, and format log messages according to their preferences, and configure logging providers to suit their needs. A logging provider is responsible for handling the logged messages and storing them in different destinations, such as the console, a file, a database, or a remote server. OpenTelemetry focuses on augmenting the logs produced by applications and provides a mechanism to correlate the logs with other signals.
Setting up Logging with OpenTelemetry
Prerequisites
- First, download and install the .NET SDK 6+ on your computer.
- Download Visual Studio Code or Visual Studio 2022
Setting up SigNoz Cloud
- Create a SigNoz Cloud account
Exporting Opentelemetry logs to SigNoz cloud
Step 1: Installing the OpenTelemetry dependency packages:
dotnet add package OpenTelemetry
dotnet add package OpenTelemetry.Exporter.OpenTelemetryProtocol
dotnet add package OpenTelemetry.Extensions.Hosting
dotnet add package OpenTelemetry.AutoInstrumentation
Step 2: Adding OpenTelemetry as Logging and configuring exporter options in Program.cs:
In your Program.cs file, add OpenTelemetry as Logging. Here, we are configuring these variables:
serviceName- It is the name of your logging service. we configure the name of the service with ResourceBuilder.otlpOptions.Endpoint- It is the endpoint of SigNoz Cloud, logs will be exported to this endpoint.<SIGNOZ_INGESTION_KEY>- You will get your ingestion when you sign up for SigNoz cloud.
Here’s a sample Program.cs file with the configured variables.
using System.Diagnostics;
using OpenTelemetry.Exporter;
using OpenTelemetry.Logs;
using OpenTelemetry.Resources;

var builder = WebApplication.CreateBuilder(args);

builder.Logging.ClearProviders();
var resourceBuilder = ResourceBuilder
                       .CreateDefault()
                       .AddService(".Net Log Service");

builder.Logging.AddOpenTelemetry(logging => {

    logging.IncludeScopes = true;

    logging.SetResourceBuilder(resourceBuilder)
               .AddOtlpExporter(otlpOptions => {

                   otlpOptions.Protocol = OtlpExportProtocol.Grpc;
                   otlpOptions.Endpoint = new Uri("https://ingest.in.signoz.cloud:443/");

                   string headerKey = "signoz-access-token";
                   string headerValue = "<SIGNOZ_INGESTION_KEY>";

                   otlpOptions.Headers = $"{headerKey}={headerValue}";
               });
});

var app = builder.Build();
app.MapGet("/", async (ILogger<Program> logger) => {
    var status = "Running";
    var currentTime = DateTime.UtcNow.ToString();

    logger.LogInformation($"Application Status changed to '{status}' at '{currentTime}'");
    // Simulate external API call
    var externalApiData =await GetExternalApiData();
    logger.LogInformation($"Data from External API: {externalApiData}");

    return $"Hi from Opentelemetry logs, here's my activity id:{Activity.Current?.Id}\n" +
           $"And here's the response from the sample external API call: {externalApiData}";
});

app.Logger.StartingApp();
app.Run();

async Task<string> GetExternalApiData()
{
    // Simulate making an external API call
    using (var httpClient = new HttpClient())
    {
        var response = await httpClient.GetAsync("https://jsonplaceholder.typicode.com/todos/1");
        if (response.IsSuccessStatusCode)
        {
            var content = await response.Content.ReadAsStringAsync();
            return content;
        }
        return "Unable to fetch data from the external API.";
    }
}

public static partial class ApplicationLogs
{
    [LoggerMessage(1, LogLevel.Information, "Starting the app...")]
    public static partial void StartingApp(this ILogger logger);

}
Some details on the code in program.cs file:
ApplicationLogsis a static partial class, the use ofpartialallows you to extend this class to other files.- It contains a single static method
StartingApp, which is marked as partial and has theLoggerMessageattribute applied. - The
LoggerMessageattribute defines a logging message template with a message ID, log level (Informationin this case), and the log message itself ("Starting the app..."). - The
GetExternalApiDatamethod simulates making a request to an external API (in this case, the JSONPlaceholder API). The data retrieved from the external API is then logged along with the other log messages in the/route handler. This demonstrates how you can integrate external API calls and enrich your logs with information from those calls. Replace the API URL and response processing logic in theGetExternalApiDatamethod with the specifics of your actual external API.
The OpenTelemetry.Exporter.Options get or set the target to which the exporter is going to send logs. The target must be a valid Uri with the scheme (http or https) and host and may contain a port and a path.
This is done by configuring an OpenTelemetry using extension methods and setting it to auto-start when the host is started.
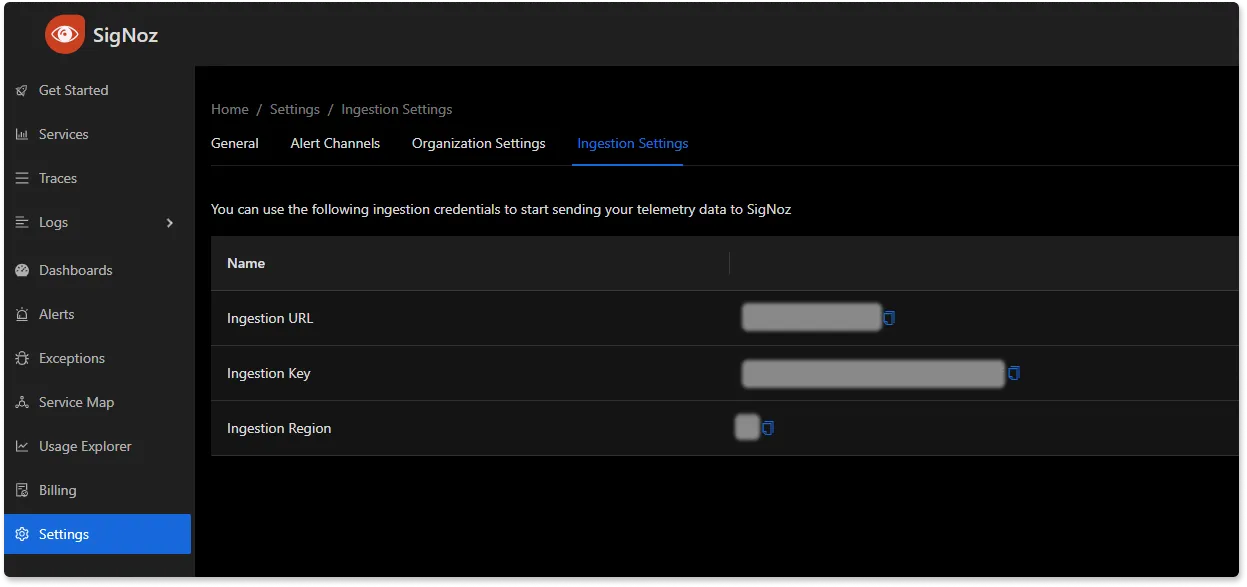
Note: You can find your Signoz cloud address and ingestion key under the settings of your Signoz cloud account.
Step 3. Running the .NET application:
dotnet build
dotnet run
Step 4: Generating some load data and checking your application in SigNoz UI
Once your application is running, generate some traffic by interacting with it.
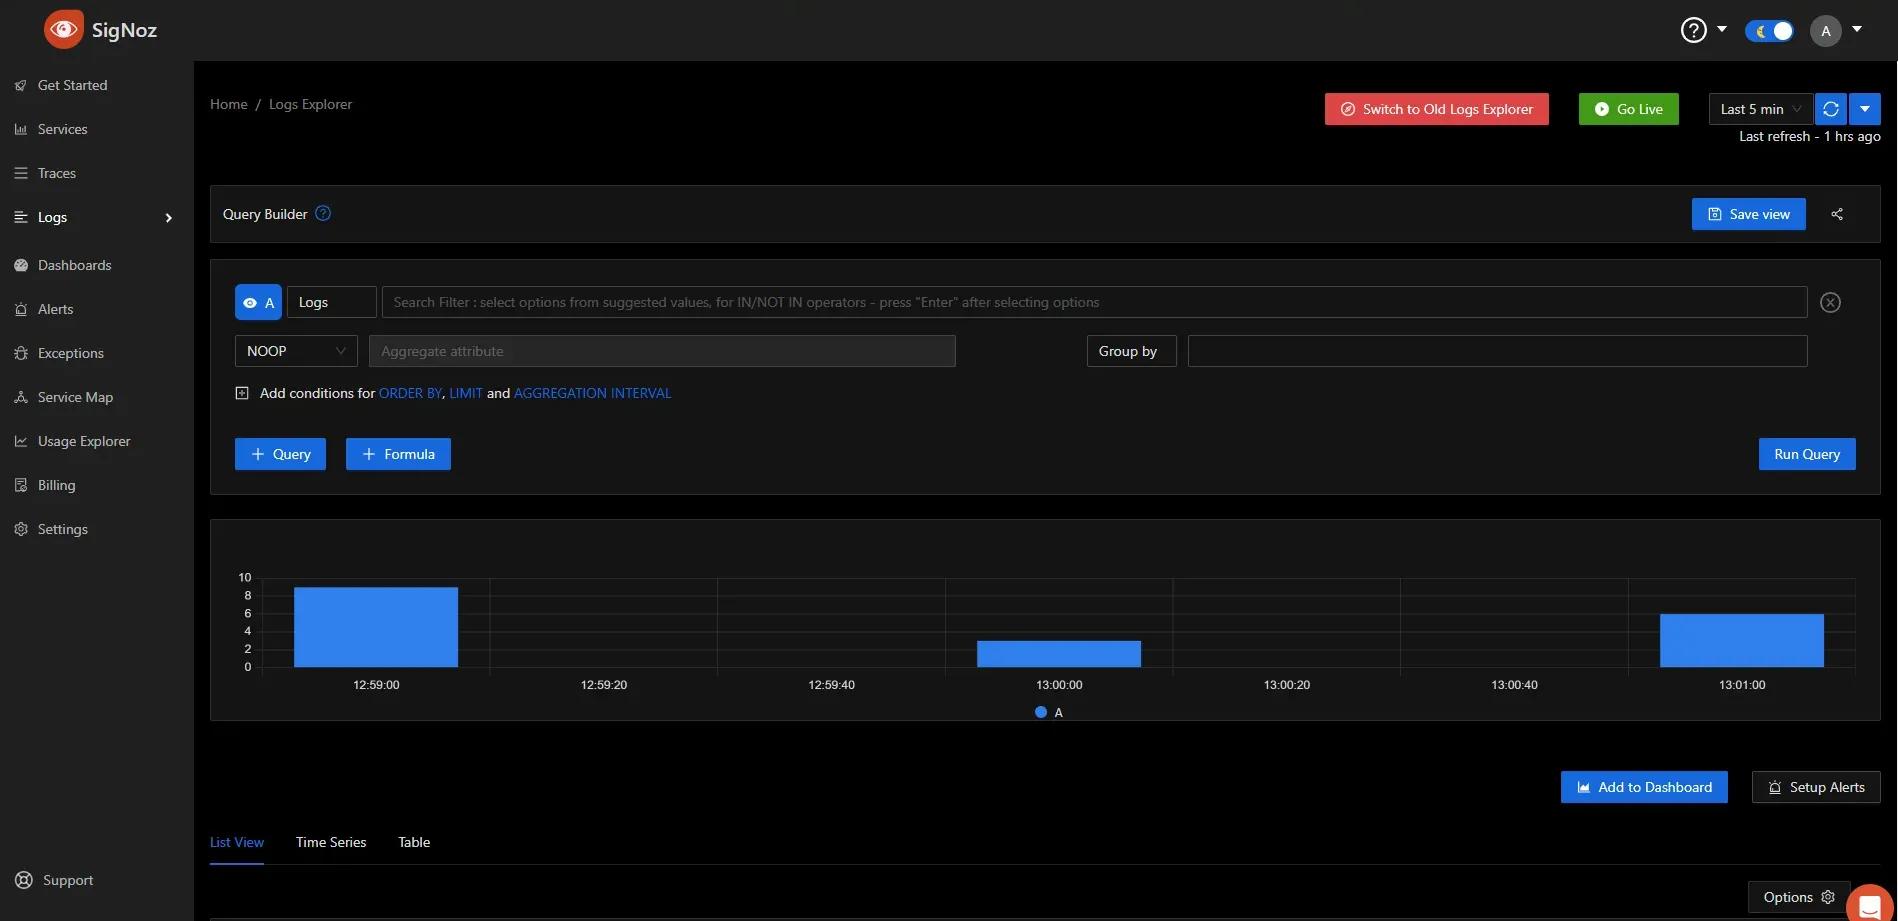
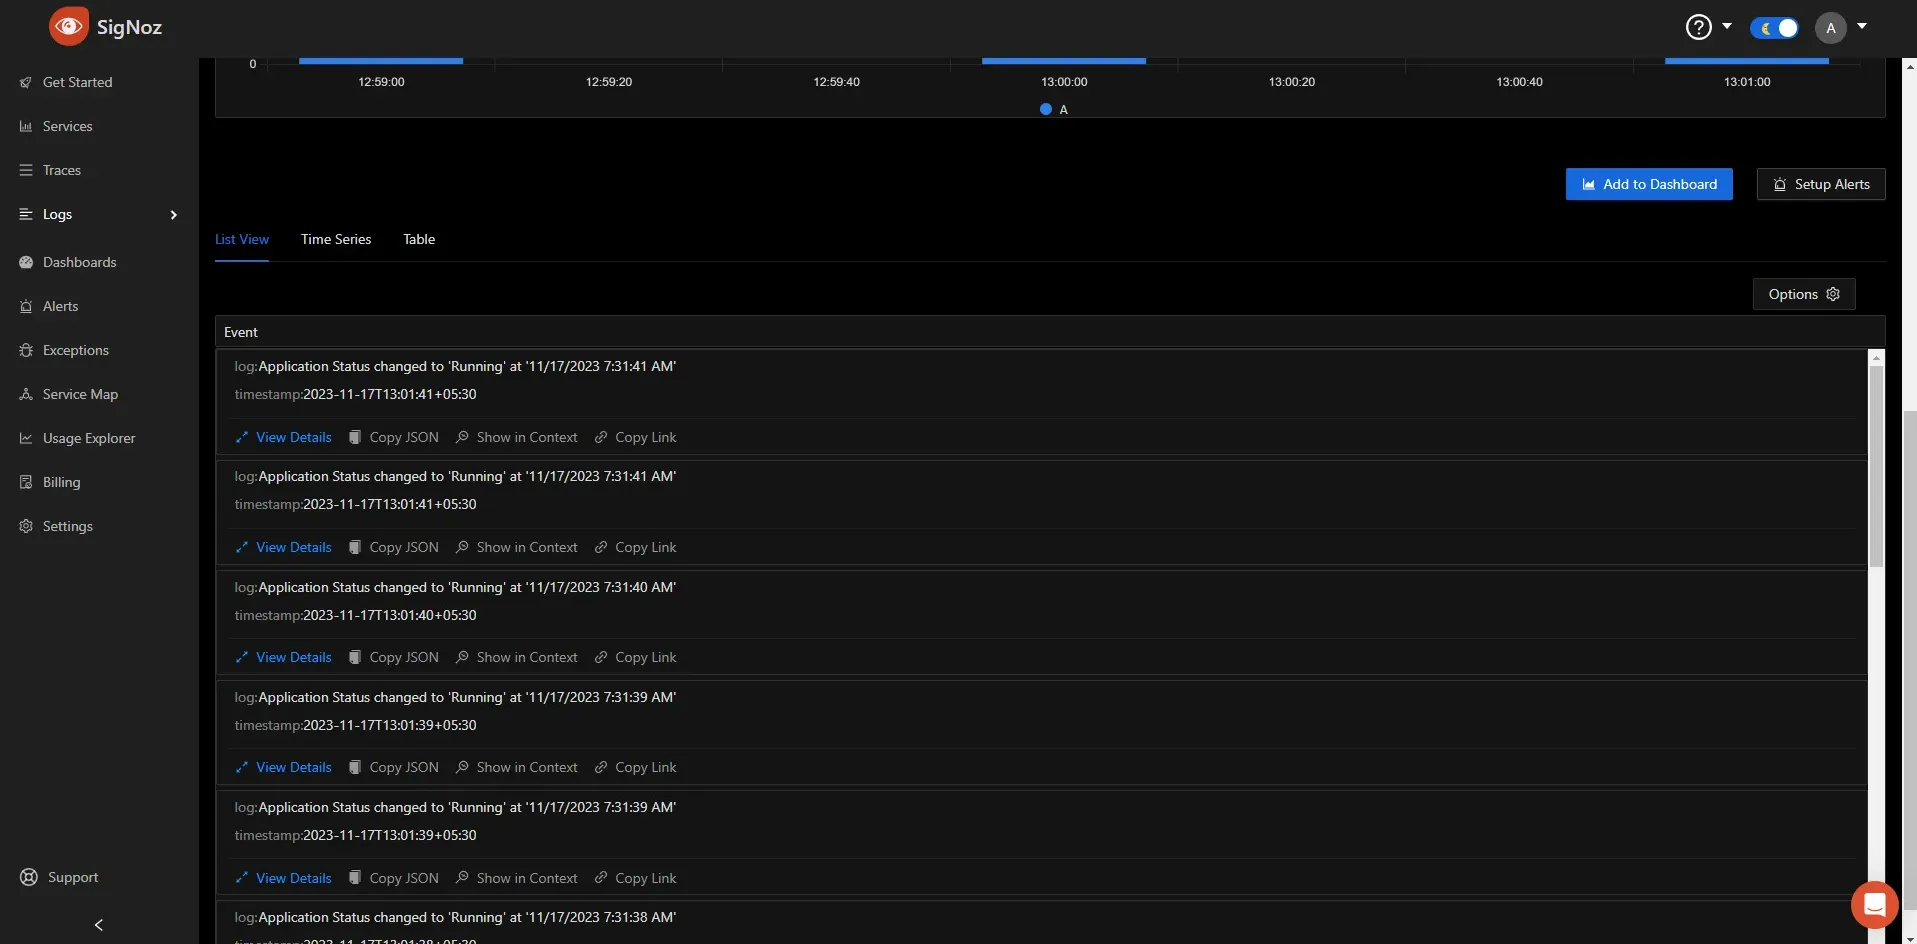
In the SigNoz account, open the Logs tab. Hit the Refresh button on the top right corner, and your logs should appear on the screen. Ensure that you're checking data for the time range filter applied in the top right corner. You might have to wait for a few seconds before the data appears on SigNoz UI.
Correlating Logs With Traces
To achieve OpenTelemetry tracing and logging correlation, you need to instrument your code with the OpenTelemetry API for tracing and add trace context to your log entries.
The program uses the OpenTelemetry.Instrumentation.AspNetCore package to automatically create traces for incoming ASP.NET Core requests.
A great benefit of OpenTelemetry is that it configures this correlation for us by default. All we need to do is ensure we are using the OpenTelemetry tracing and logging client libraries.
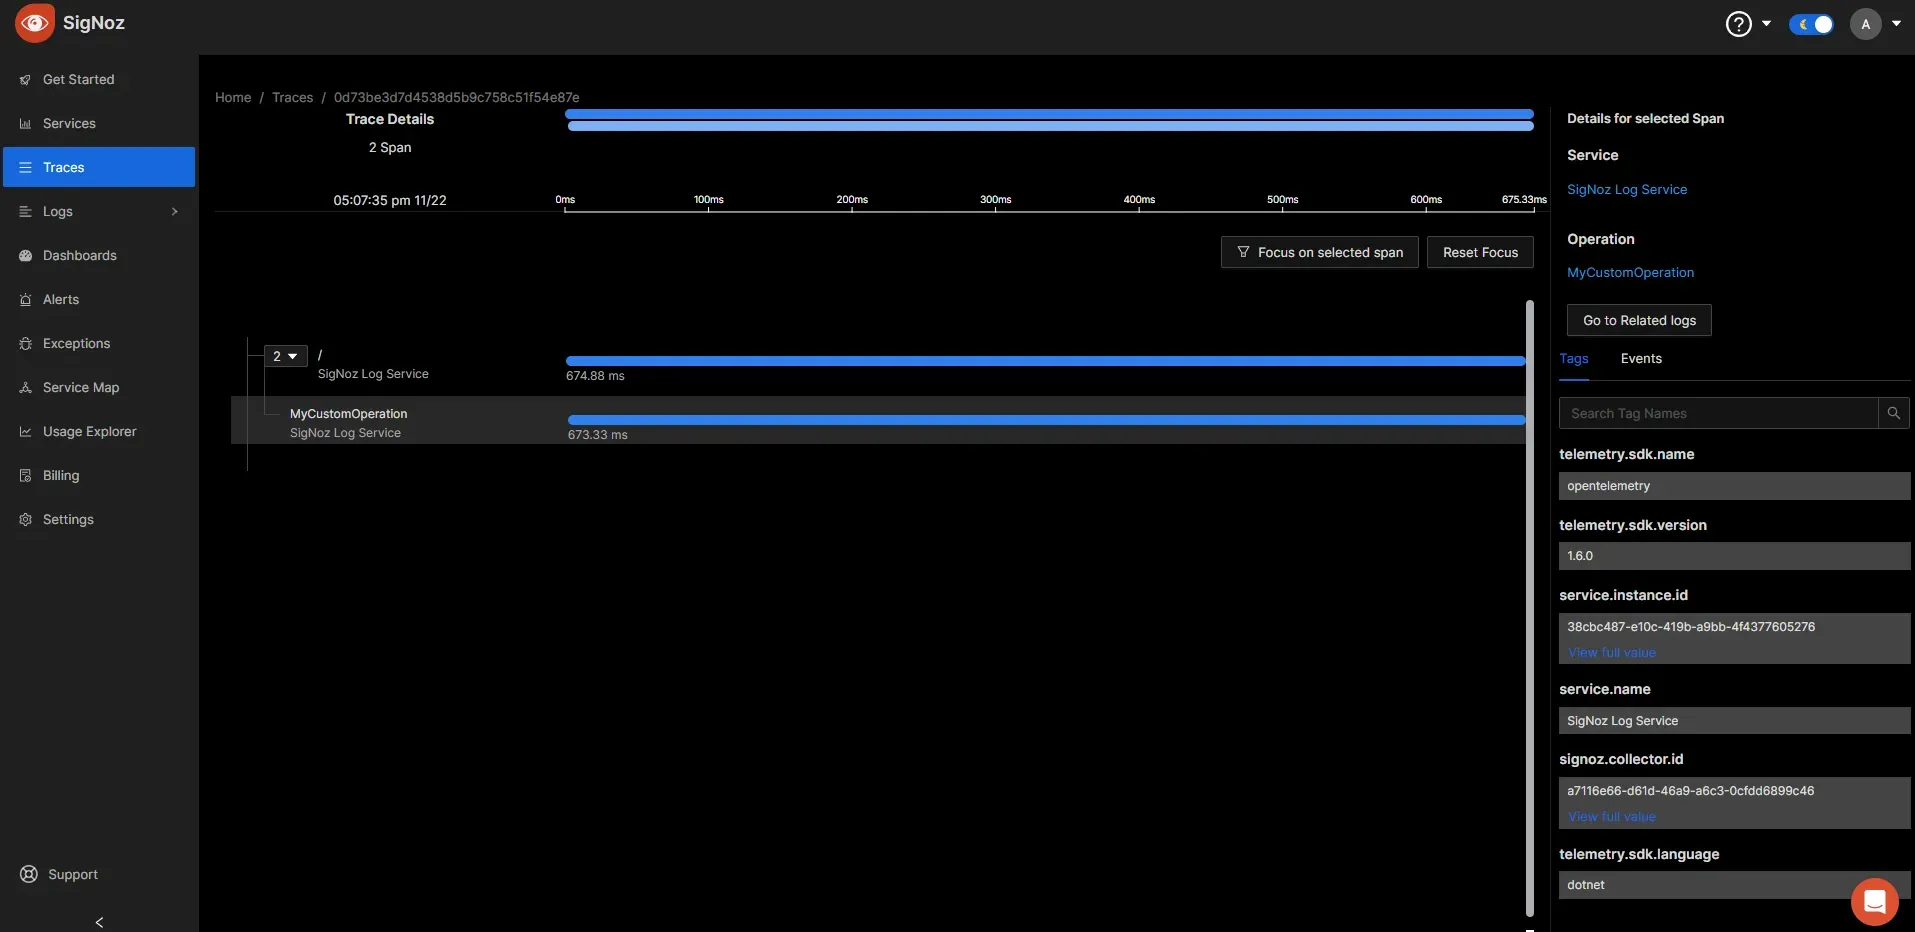
To start, add an ActivitySource parameter to the MapGet method and use it to start a custom activity (MyCustomOperation). This will create a trace for the execution of your MapGet method, and you can see the trace ID in the log output. The trace context is automatically propagated to logs.
Here is the modified program.cs class to demonstrate this correlation.
using System.Diagnostics;
using OpenTelemetry.Exporter;
using OpenTelemetry.Logs;
using OpenTelemetry.Resources;
using OpenTelemetry.Trace;

var builder = WebApplication.CreateBuilder(args);

builder.Logging.ClearProviders();

var resourceBuilder = ResourceBuilder
    .CreateDefault()
    .AddService("SigNoz Log Service");

builder.Logging.AddOpenTelemetry(logging => {

    logging.IncludeScopes = true;

    logging.SetResourceBuilder(resourceBuilder)
               .AddOtlpExporter(otlpOptions => {
                   otlpOptions.Protocol = OtlpExportProtocol.Grpc;
                   otlpOptions.Endpoint = new Uri("https://ingest.in.signoz.cloud:443/");
                   string headerKey = "signoz-access-token";
                   string headerValue = "<SIGNOZ_INGESTION_KEY>";
                   otlpOptions.Headers = $"{headerKey}={headerValue}";
               });
});

//creating a service trace to demonstrate tracing of request
builder.Services.AddOpenTelemetry().WithTracing(tracing =>
{
    tracing
        .SetResourceBuilder(resourceBuilder)
        .AddAspNetCoreInstrumentation()
        .AddOtlpExporter(otlpOptions =>
        {
            otlpOptions.Protocol = OtlpExportProtocol.Grpc;
            otlpOptions.Endpoint = new Uri("https://ingest.in.signoz.cloud:443/");
            string headerKey = "signoz-access-token";
            string headerValue = "<SIGNOZ_INGESTION_KEY>";
            otlpOptions.Headers = $"{headerKey}={headerValue}";
        });
});

var app = builder.Build();

app.MapGet("/", async (ILogger<Program> logger, ActivitySource activitySource) =>
{
    using (var activity = activitySource.StartActivity("MyCustomOperation"))
    {
        var status = "Running";
        var currentTime = DateTime.UtcNow.ToString();

        logger.LogInformation($"Application Status changed to '{status}' at '{currentTime}'");

        // Simulate external API call
        var externalApiData = await GetExternalApiData(logger);
        logger.LogInformation($"Data from External API: {externalApiData}");

        return $"Hi from Opentelemetry logs,this is the correlation of logs with tracing, here's my activity id: {Activity.Current?.Id}\n" +
               $"And here's the response from the sample external API call: {externalApiData}";
    }
});

app.Logger.StartingApp();

app.Run();

async Task<string> GetExternalApiData(ILogger logger)
{
    // Simulate making an external API call
    using (var httpClient = new HttpClient())
    {
        var response = await httpClient.GetAsync("https://jsonplaceholder.typicode.com/todos/1");

        if (response.IsSuccessStatusCode)
        {
            var content = await response.Content.ReadAsStringAsync();
            logger.LogInformation($"Response from the External API {content}");
            return content;
        }

        logger.LogError("Unable to fetch data from the external API.");
        return "Unable to fetch data from the external API.";
    }
}

public static partial class ApplicationLogs
{
    [LoggerMessage(1, LogLevel.Information, "Starting the app...")]
    public static partial void StartingApp(this ILogger logger);

}
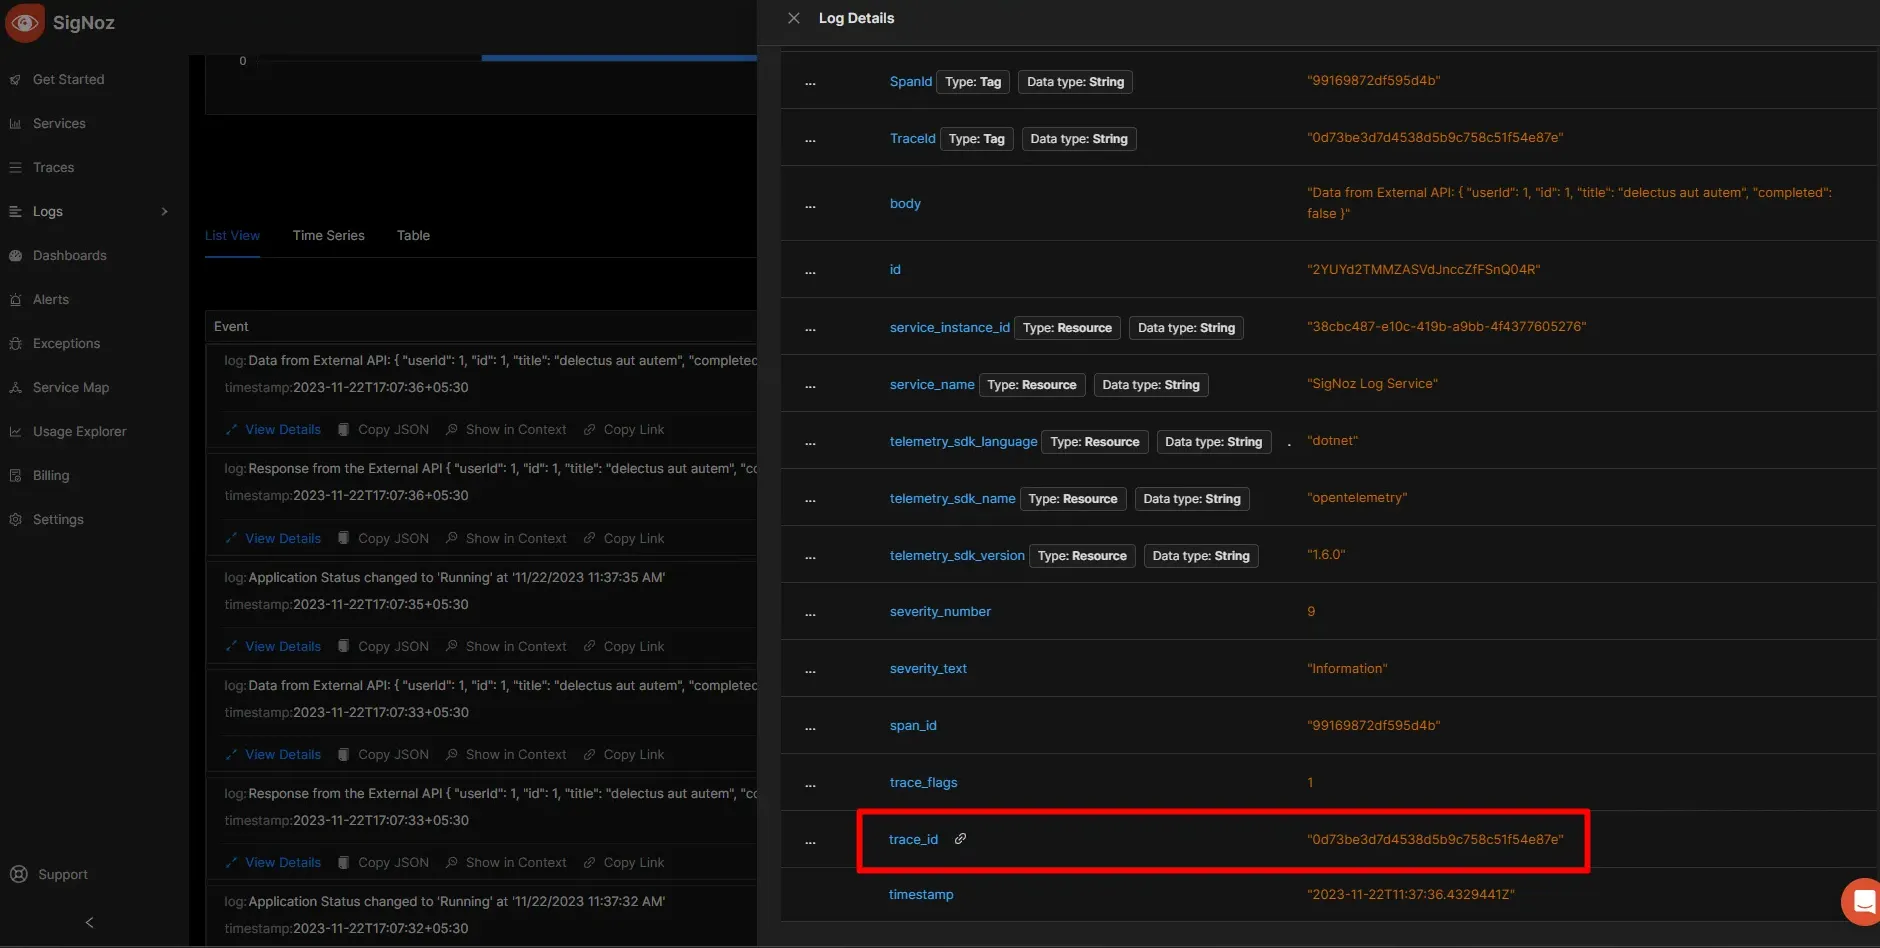
On inspecting a particular log from the list in SigNoz cloud, we can see the traceId property with the link, which will navigate us to the particular trace on trace section.
Troubleshooting
The console exporter prints data to the Console window. You can use it to verify if the instrumentation is properly set up or not.
Below are the steps on how to use the console exporter:
Step 1. Adding the OpenTelemetry console exporter package:
dotnet add package OpenTelemetry.Exporter.Console
Step 2. Adding the console exporter method:
 logging.SetResourceBuilder(resourceBuilder)
            .AddOtlpExporter(otlpOptions =>{

              //sigNoz Cloud Endpoint
           otlpOptions.Endpoint = new Uri("https://ingest.{region}.signoz.cloud:443");

           otlpOptions.Protocol = OtlpExportProtocol.Grpc;

                    //SigNoz Cloud account Ingestion key
           string headerKey = "signoz-access-token";
           string headerValue = "<SIGNOZ_INGESTION_KEY>";

           string formattedHeader = $"{headerKey}={headerValue}";
           otlpOptions.Headers = formattedHeader;
            })
            // ConsoleExporter is used for demo purpose only.
            .AddConsoleExporter();

});
Monitor the application on the console. You will be able to see the trace output as below:
Resource associated with LogRecord:
service.name: SigNoz Log Service
service.instance.id: 57df2d72-d4a1-4cc8-a33a-6009c69742f8
telemetry.sdk.name: opentelemetry
telemetry.sdk.language: dotnet
telemetry.sdk.version: 1.6.0

LogRecord.Timestamp:               2023-11-17T09:10:29.9803094Z
LogRecord.CategoryName:            Microsoft.Hosting.Lifetime
LogRecord.Severity:                Info
LogRecord.SeverityText:            Information
LogRecord.Body:                    Content root path: {ContentRoot}
LogRecord.Attributes (Key:Value):
    ContentRoot: C:\SigNozLogDemo\sample-log-app
    OriginalFormat (a.k.a Body): Content root path: {ContentRoot}

Resource associated with LogRecord:
service.name: SigNoz Log Service
service.instance.id: 57df2d72-d4a1-4cc8-a33a-6009c69742f8
telemetry.sdk.name: opentelemetry
telemetry.sdk.language: dotnet
telemetry.sdk.version: 1.6.0

LogRecord.Timestamp:               2023-11-17T09:10:31.2906720Z
LogRecord.TraceId:                 1c443e3be7b85edb84e8c443c7fce32d
LogRecord.SpanId:                  e65f9a3edae19c6e
LogRecord.TraceFlags:              None
LogRecord.CategoryName:            Program
LogRecord.Severity:                Info
LogRecord.SeverityText:            Information
LogRecord.Body:                    Application Status changed to 'Running' at '11/17/2023 9:10:31 AM'
LogRecord.Attributes (Key:Value):
    OriginalFormat (a.k.a Body): Application Status changed to 'Running' at '11/17/2023 9:10:31 AM'
LogRecord.ScopeValues (Key:Value):
[Scope.0]:SpanId: e65f9a3edae19c6e
[Scope.0]:TraceId: 1c443e3be7b85edb84e8c443c7fce32d
[Scope.0]:ParentId: 0000000000000000
[Scope.1]:ConnectionId: 0HMV79K5UV12K
[Scope.2]:RequestId: 0HMV79K5UV12K:00000001
[Scope.2]:RequestPath: /

Resource associated with LogRecord:
service.name: SigNoz Log Service
service.instance.id: 57df2d72-d4a1-4cc8-a33a-6009c69742f8
telemetry.sdk.name: opentelemetry
telemetry.sdk.language: dotnet
telemetry.sdk.version: 1.6.0

LogRecord.Timestamp:               2023-11-17T09:10:34.7592436Z
LogRecord.TraceId:                 54dd844b377cd3df8b2e39533f3cea2b
LogRecord.SpanId:                  a9ae27e54864390b
LogRecord.TraceFlags:              None
LogRecord.CategoryName:            Program
LogRecord.Severity:                Info
LogRecord.SeverityText:            Information
LogRecord.Body:                    Application Status changed to 'Running' at '11/17/2023 9:10:34 AM'
LogRecord.Attributes (Key:Value):
    OriginalFormat (a.k.a Body): Application Status changed to 'Running' at '11/17/2023 9:10:34 AM'
LogRecord.ScopeValues (Key:Value):
[Scope.0]:SpanId: a9ae27e54864390b
[Scope.0]:TraceId: 54dd844b377cd3df8b2e39533f3cea2b
[Scope.0]:ParentId: 0000000000000000
[Scope.1]:ConnectionId: 0HMV79K5UV12K
[Scope.2]:RequestId: 0HMV79K5UV12K:00000002
[Scope.2]:RequestPath: /
Conclusion
OpenTelemetry can enhance the observability of .NET applications by helping you to generate and collect metrics, traces, and logs. By seamlessly integrating logging and tracing functionalities, developers gain a holistic view of application behavior.
The showcased integration with Signoz Cloud further amplifies the power of observability, providing a streamlined platform for efficient monitoring and troubleshooting. With OpenTelemetry, developers can unlock new levels of insight, empowering them to build and maintain robust, performant applications with confidence.
Further Reading
SigNoz - An OpenTelemetry-native APM

