Are there any alternatives to OpenTelemetry worth considering?
Are you looking for an OpenTelemetry alternative? Then you've come to the right place. There are no good alternatives to OpenTelemetry if your use case involves generating different types of telemetry signals like logs, metrics, and traces and their collection. In certain use cases, like monitoring only metrics or time-series data, you can use a tool like Prometheus.

If you’re sure you want an OpenTelemetry alternative, then let me point you to these three here. You can use any of these tools as an alternative to OpenTelemetry based on your use-case. Remember, use-case is the keyword here:
- Prometheus, in case you only want to monitor metrics or time-series data
- Jaeger, in case you only want to do distributed tracing
- Zipkin, again if you only want to do distributed tracing
But before we talk more about these tools, let us understand more about OpenTelemetry.
Many people confuse OpenTelemetry with an observability tool or a database - it is neither.
OpenTelemetry in brief and its use-cases
OpenTelemetry is a collection of APIs, SDKs, and tools for instrumenting, generating, collecting, and exporting telemetry data (metrics, logs, traces) to analyze application performance and behavior. Once the data is generated and collected, you can send it to any observability tool by configuring an exporter. That’s how it frees you from any vendor lock-in.
OpenTelemetry is open-source and is free to use. It is backed by the Cloud Native Computing Foundation (CNCF) and is quietly becoming the standard for instrumenting cloud-native applications. It is the second most active project in the CNCF landscape after Kubernetes and has significant community backing, including major cloud vendors like AWS, Azure, etc.
In the open-source ecosystem, there are no alternatives to OpenTelemetry. The major reason is that OpenTelemetry is an initiative to standardize observability and be a one-stop solution for all telemetry needs. There is no project of this scale and size to address the issue of portable observability data.
If your use case is just logging or metrics monitoring, you can use a specific client library. But in most scenarios, it is recommended to use OpenTelemetry as it will future-proof your instrumentation.
OpenTelemetry was formed after the merger of two open-source projects - OpenCensus and OpenTracing in 2019. Since then, it has been the go-to open-source standard for instrumenting cloud-native applications.
The specification is designed into distinct types of telemetry known as signals. Presently, OpenTelemetry has specifications for these three signals:
- Logs
- Metrics and
- Traces
Together, these three signals form the three pillars of observability. OpenTelemetry is the bedrock for setting up an observability framework. The application code is instrumented using OpenTelemetry client libraries, which enables the generation of telemetry data. Once the telemetry data is generated and collected, OpenTelemetry needs a backend analysis tool like SigNoz to which it can send the data.
The Use Cases of OpenTelemetry
OpenTelemetry can be applied in various scenarios across software development and operations. Here are some prominent use cases:
Distributed Tracing:
OpenTelemetry can be used to generate trace data that tracks a request across a distributed system, enabling developers to understand the end-to-end flow of a request and identify bottlenecks or errors.
For example, if a user complains about slow response times, you can use OpenTelemetry tracing data to trace the request through all the services and identify the service that is causing the delay. You will need to instrument your application with OpenTelemetry client libraries to generate traces.
Performance Monitoring:
You can collect metrics from applications and infrastructure, such as CPU usage, memory usage, network traffic, and response times. This data can be used to monitor the performance of an application or infrastructure, identify performance bottlenecks, and optimize resource usage.
Logging:
OpenTelemetry can be used to generate and collect logs from applications and infrastructure, enabling developers to debug issues and troubleshoot errors. If you’re already using a logging library or collectors like Flluentbit, FluentD, etc., you can use the OpenTelemetry Collector to collect the logs and forward them to an observability tool.
Cloud Monitoring:
It can be used to monitor cloud infrastructure, such as Kubernetes clusters, AWS services, or Google Cloud Platform services. This data can be used to optimize resource usage, identify security issues, and troubleshoot issues.
Resource Utilization Monitoring:
OpenTelemetry allows for tracking the usage of resources like CPU, memory, and network, enabling optimization of resource allocation and identification of potential bottlenecks.
Basically, you can use OpenTelemetry to fulfill any use case that involves the generation and collection of telemetry signals - logs, metrics, and traces. Even if you want to do a single signal, you can use OpenTelemetry. It will save you rework in case you want to expand the scope of your monitoring capabilities.
Now let us go through some of the OpenTelemetry alternatives that we mentioned earlier.
OpenTelemetry Alternatives
In this section, we will look at some of the alternatives to OpenTelemetry. They are:
- Prometheus
- Zipkin
- Jaeger
Prometheus
Prometheus is an open-source monitoring tool that specializes in collecting and analyzing metrics from various systems, particularly those involving time-series data — metrics that evolve over time, like requests per second on an endpoint.Prometheus is an efficient metrics monitoring tool. But that shouldn’t stop you from using OpenTelemetry. You can actually use Prometheus and OpenTelemetry in combination. You can use OpenTelemetry Collector to pull Prometheus metrics and export them to an OpenTelemetry backend like SigNoz.
Zipkin
Zipkin is an open-source distributed tracing system designed to monitor and troubleshoot microservices-based architectures, providing a framework for visualizing the flow of requests across various services in a distributed system.
Zipkin provides client libraries to instrument applications for traces. You can either use these client libraries to instrument your application for traces, or you can also use OpenTelemetry tracing libraries. OpenTelemetry provides a Zipkin JSON Exporter. It can process, package trace data, and send it to the designated Zipkin collector endpoint using JSON over HTTP.
Jaeger
Jaeger is an open-source distributed tracing system used for monitoring and troubleshooting the performance of applications, especially in complex, distributed systems. Jaeger provides insights into the timing and dependencies of operations within a system, allowing for in-depth analysis and optimization.In its earlier iterations, Jaeger was equipped with its own set of SDKs, including tracers and client libraries, designed to facilitate tracing through the OpenTracing API. However, a significant shift occurred in 2022 when Jaeger announced the discontinuation of support for these SDKs. Instead, it now strongly advocates the adoption of OpenTelemetry for seamless and advanced tracing capabilities in conjunction with Jaeger.
OpenTelemetry: Shaping the Future of Observability
OpenTelemetry stands as the de facto standard for observability in modern software development and is the future for setting up observability for cloud-native apps. Its widespread adoption in the industry attests to its pivotal role in shaping the way we observe and optimize applications.
By utilizing OpenTelemetry, you seamlessly instrument your applications, generating critical logs, metrics, and traces. This standardized approach ensures consistency and compatibility across a wide spectrum of technologies and frameworks.
OpenTelemetry is backed by a huge community and covers a wide variety of technology and frameworks. Using OpenTelemetry, engineering teams can instrument polyglot and distributed applications with peace of mind.
Getting started with OpenTelemetry
It is important to note that OpenTelemetry helps only to generate and collect telemetry data. You need to export the telemetry data to a backend analysis tool so that your teams can store, query, and visualize the collected data. And that's where SigNoz comes into the picture.
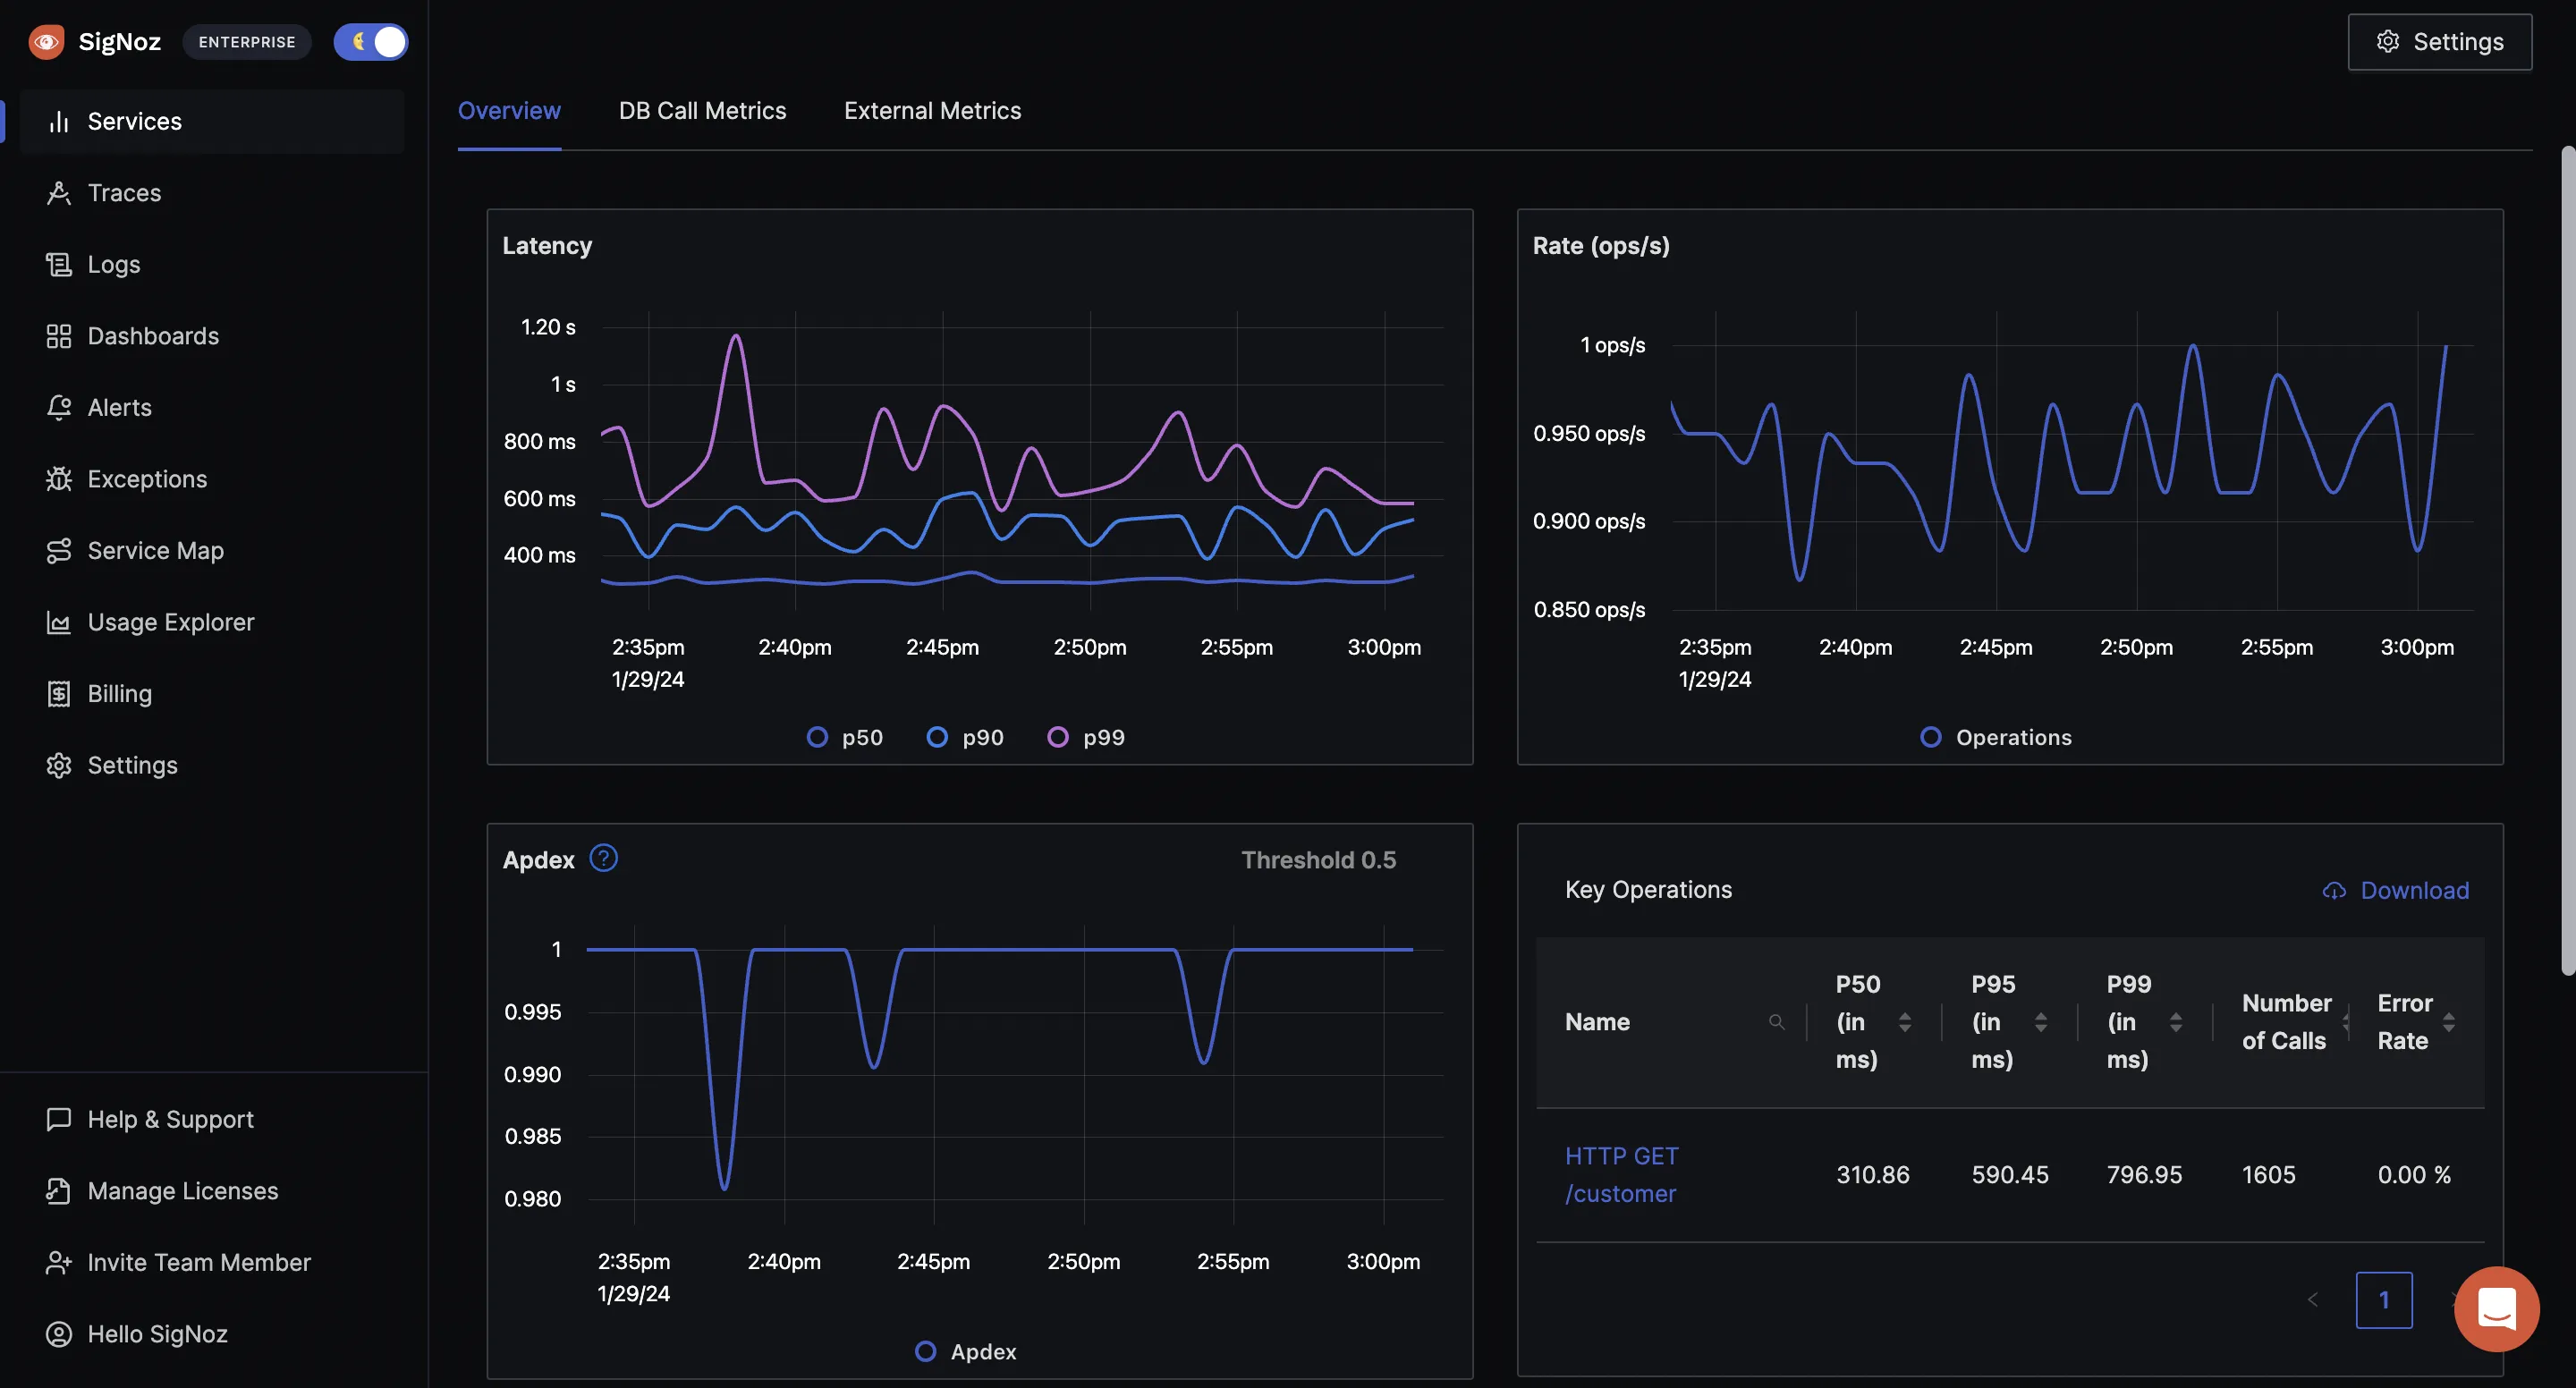
SigNoz is an open-source observability tool that supports OpenTelemetry natively. It provides logs, metrics, and traces under a single pane of glass.
With SigNoz's support for OpenTelemetry, users can easily integrate their applications with SigNoz's observability platform, enabling them to gain deeper insights into their applications with out-of-the-box charts and visualizations.

One of the standout features of SigNoz is its intuitive visualization capabilities. It enables users to generate insightful visual representations like Flamegraphs and Gantt charts based on the tracing data collected through OpenTelemetry.
These visualizations provide valuable insights into the performance and behavior of applications, making troubleshooting and performance optimization significantly more efficient.

Getting started with SigNoz
SigNoz cloud is the easiest way to run SigNoz. Sign up for a free account and get 30 days of unlimited access to all features.
You can also install and self-host SigNoz yourself since it is open-source. With 16,000+ GitHub stars, open-source SigNoz is loved by developers. Find the instructions to self-host SigNoz.
Related Posts


