An Open Source Observability Platform | SigNoz
Cloud computing and containerization have brought many benefits to IT systems, like speed to market and on-demand scaling. But it has also increased operational complexity. Applications built on dynamic and distributed infrastructure are challenging to operate and maintain. A robust observability framework can help application owners stay on top of their software systems.
In this article, we will introduce SigNoz - an open source observability platform. But before that, let’s talk about observability a bit.
In today’s digital ecosystem, users expect applications to meet their needs in seconds. Any latency is missed business opportunity. For keeping a tab on application health, you need to monitor many things like resource utilization metrics from Kubernetes and Docker, request rates, error rates of APIs, latency, database performance metrics, and much more.
But if monitoring your IT systems is enough, why do we need observability?
There is a lot of debate around the term observability. How is observability different from monitoring, and how does it help run complex modern distributed applications?
What is Observability?
We believe the aim of observability is to solve customer issues quickly. Creating monitoring dashboards is useless if it can’t help engineering teams quickly identify the root causes of performance issues.
A modern distributed software system has a lot of moving components. So while setting up monitoring, you might not know what answers you would need to solve an issue. And that’s where observability comes into the picture.
Observability enables application owners to get answers to any question that might arise while debugging application issues.
Observability is a data analytics problem
Observability is fundamentally a data analytics problem. Suppose you have collected all sorts of telemetry data from your IT infrastructure and application code. Now the challenge is creating an analytics layer to help you reach potential solutions quickly.
Logs, metrics, and traces are often touted as the three pillars of observability. At SigNoz, we believe differently, but having access to these three telemetry signals is the first step towards observability. The tooling ecosystem for these three telemetry signals is so varied that it might be daunting for application owners to decide which tools to use. There are broadly two options: a SaaS observability vendor or open source observability tools.
Open Source better suited for Observability
Open source has changed the way software is developed. Most software systems today are built with off-the-shelf components from open source libraries like HTTP clients, proxies, web frameworks, etc. A SaaS observability vendor will provide their proprietary agents for instrumenting the open source libraries and frameworks used by your application.
The agents are designed to support the data storage system used by the vendor. As such, application owners run a risk of getting locked in with the vendor. A switch to some other observability system will require re-instrumentation from scratch.
You are also dependent on the vendor to provide support for the instrumentation of new technologies and open source libraries. And that’s where open source observability solutions are better suited. Open source solutions are more flexible, and can be self-hosted within your infra. Many solutions are available in the open source ecosystem for observability. Most organizations have multiple tools for different telemetry signals.
Multiple tools can create data silos
As discussed earlier, observability is fundamentally a data analytics problem. Having different tools for different telemetry signals creates another challenge - data silos. Engineering teams need to ramp themselves up on multiple tools, and correlation among different telemetry signals is hard.
For example, you might use Prometheus for metrics and Jaeger for traces. But how would you correlate your metrics with traces?
For robust observability, having a seamless way to correlate your telemetry signals is critical. For example, if you see that the latency of a particular service is high at the moment, can you deep-dive into relevant logs quickly? Can you correlate your metrics with traces to figure out where in the request journey the problem occurred? Building correlation across different tools is painful and requires a lot of engineering bandwidth. At SigNoz, we believe in providing a single pane of glass for observability.
Single pane of glass for observability
The objective of having a single pane of glass for observability is to provide intelligent correlation between telemetry signals. Having your logs, metrics, and traces under a single dashboard and stored in single columnar database enables advanced querying and visualization.
But that’s not all. The journey of open source observability starts with open source instrumentation. Having a vendor-agnostic instrumentation layer has many benefits in the long run. And that’s where OpenTelemetry comes into the picture.
Open Source Instrumentation with OpenTelemetry
OpenTelemetry is an open-source collection of tools, APIs, and SDKs that aims to standardize how we generate and collect telemetry data. It is incubated under Cloud Native Computing Foundation(CNCF), the same foundation under which Kubernetes graduated.It follows a specification-driven development. The OpenTelemetry specification has design and implementation guidelines for how the instrumentation libraries should be implemented. In addition, it provides client libraries in all the major programming languages which follow the specification.
OpenTelemetry was formed after the merger of two open-source projects - OpenCensus and OpenTracing in 2019. Since then, it has been the go-to open source standard for instrumenting cloud-native applications.
OpenTelemetry has specifications for all three signals:
- Logs,
- Metrics, and
- Traces
Together these three signals can form the bedrock for setting up an observability framework. The application code is instrumented using OpenTelemetry client libraries, which enables the generation of telemetry data. Once the telemetry data is generated and collected, you can send the data to an observability backend of your choice.
Open Source Observability based on OpenTelemetry - SigNoz
SigNoz is built to support OpenTelemetry natively. Most vendors now claim to support OpenTelemetry. But in reality, it isn’t easy to shift from legacy systems. Choosing an OpenTelemetry native observability backend can ensure a better user experience.
SigNoz supports all three telemetry signals under a single dashboard. You can seamlessly correlate your application metrics and traces, and also use it for things like infrastructure monitoring. Some of the key features of SigNoz are:
Out of the box application metrics
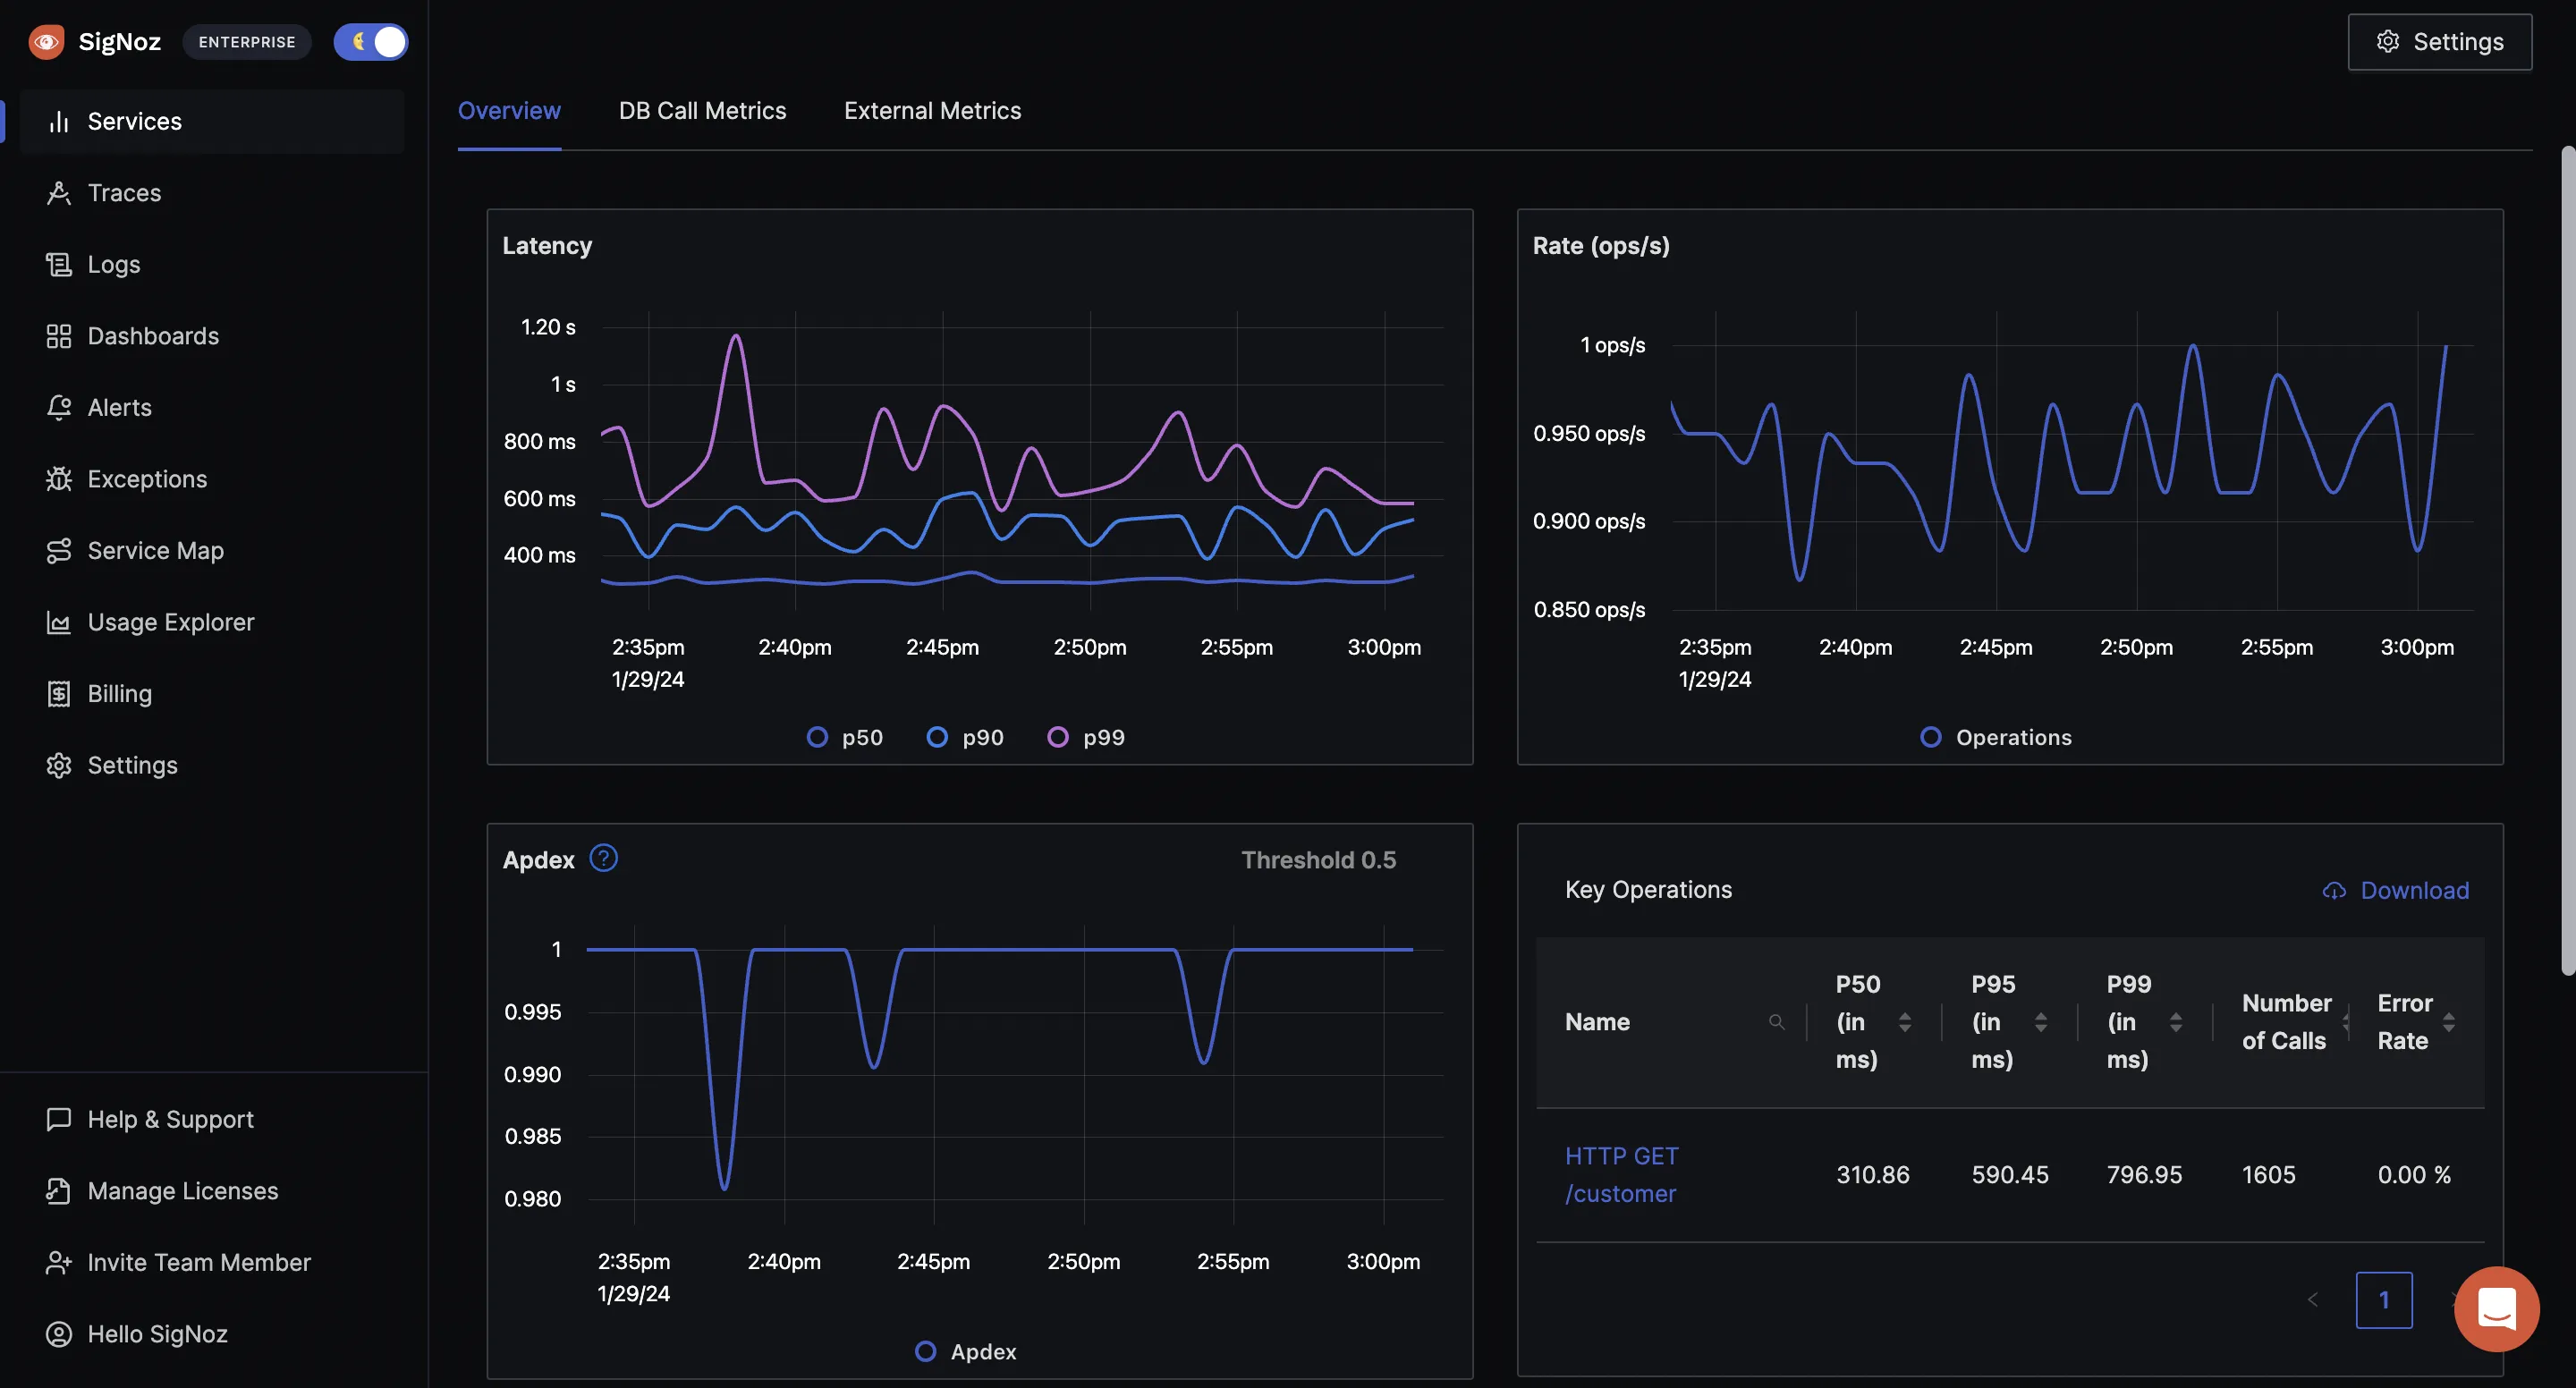
Get p90, p99 latencies, RPS, Error rates and top endpoints for a service out of the box.
Seamless flow between metrics & traces
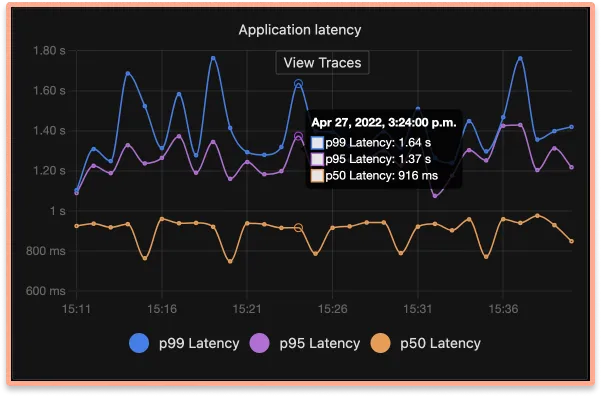
Found something suspicious in a metric, just click that point in the graph & get details of traces which may be causing the issues. Seamless, Intuitive.
Advanced filters on trace data
Under our traces tab, you can analyze the traces data using filters based on tags, status codes, service names, operation, etc.
Using tags, you can find latency experienced by customers who have customer_type set as premium.

Custom aggregates on filtered traces
Create custom metrics from filtered traces to find metrics of any type of request. Want to find p99 latency of customer_type: premium who are seeing status_code:400. Just set the filters, and you have the graph. Boom!

Detailed Flamegraphs & Gantt charts
Detailed flamegraph & Gantt charts to find the exact cause of the issue and which underlying requests are causing the problem. Is it a SQL query gone rogue or a Redis operation is causing an issue?

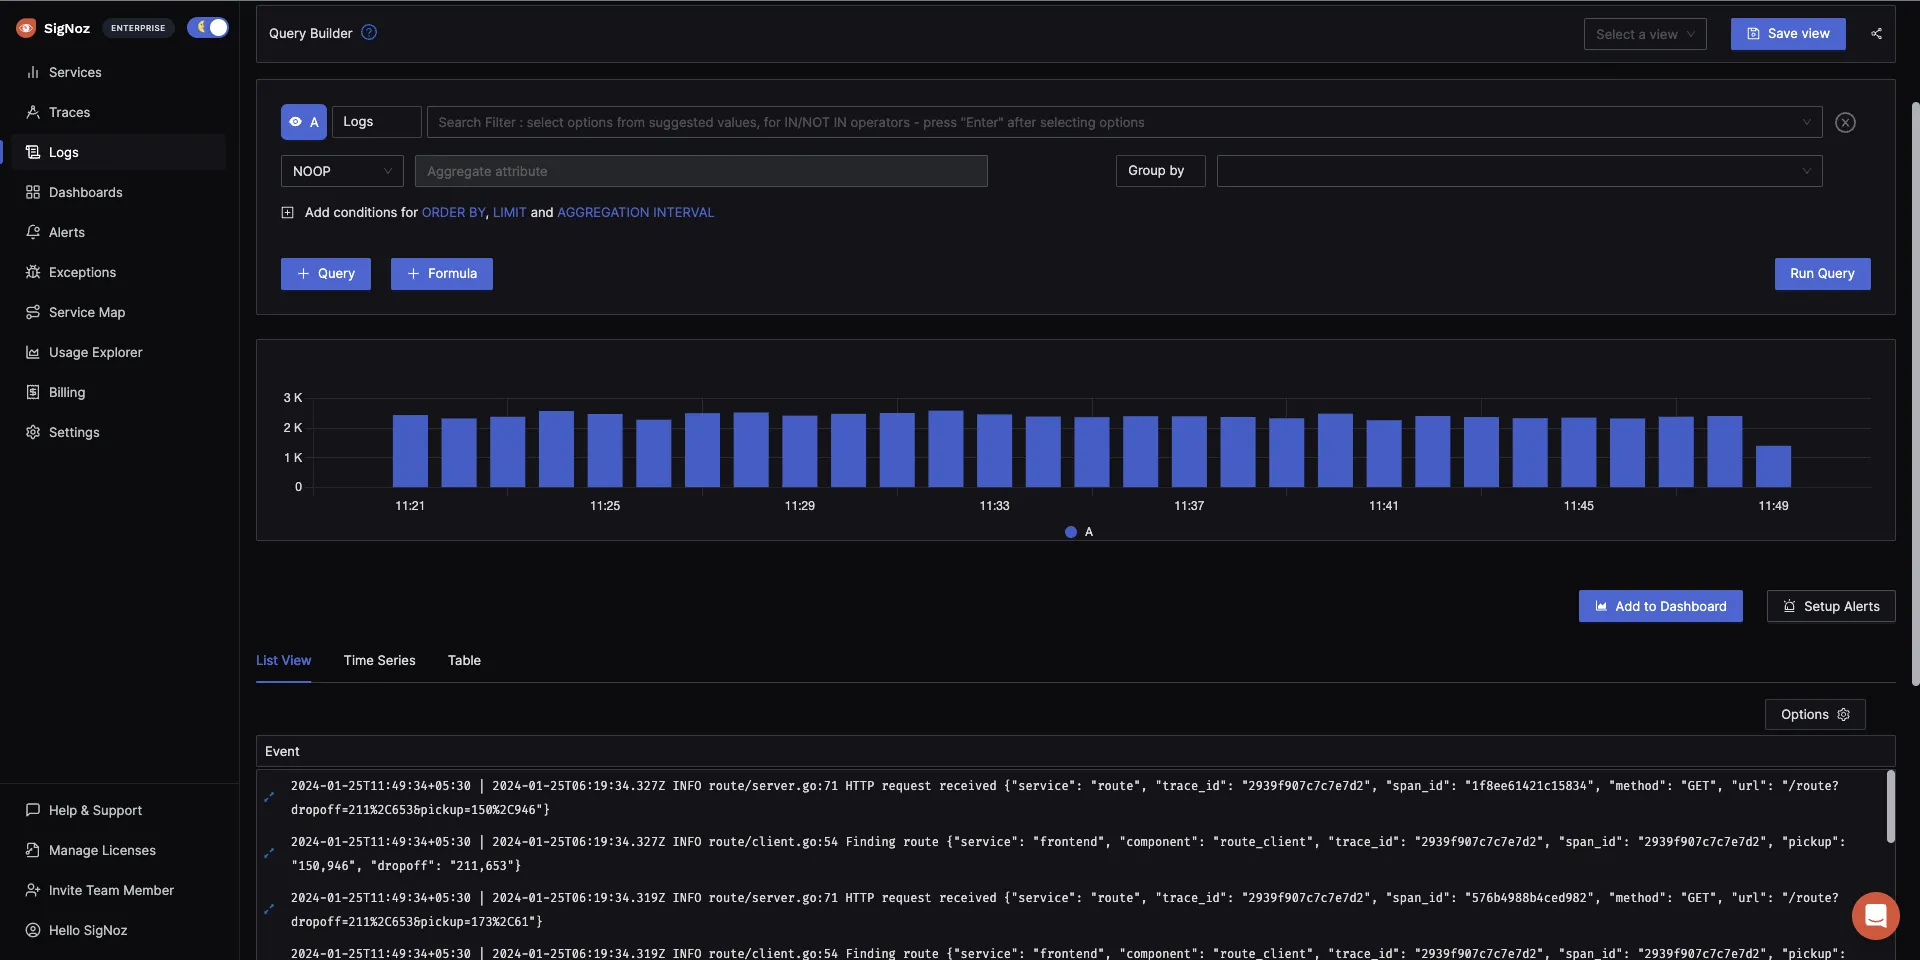
Logs Management with advanced log query builder and live tailing
SigNoz provides Logs management with advanced log query builder. You can also monitor your logs in real-time using live tailing.
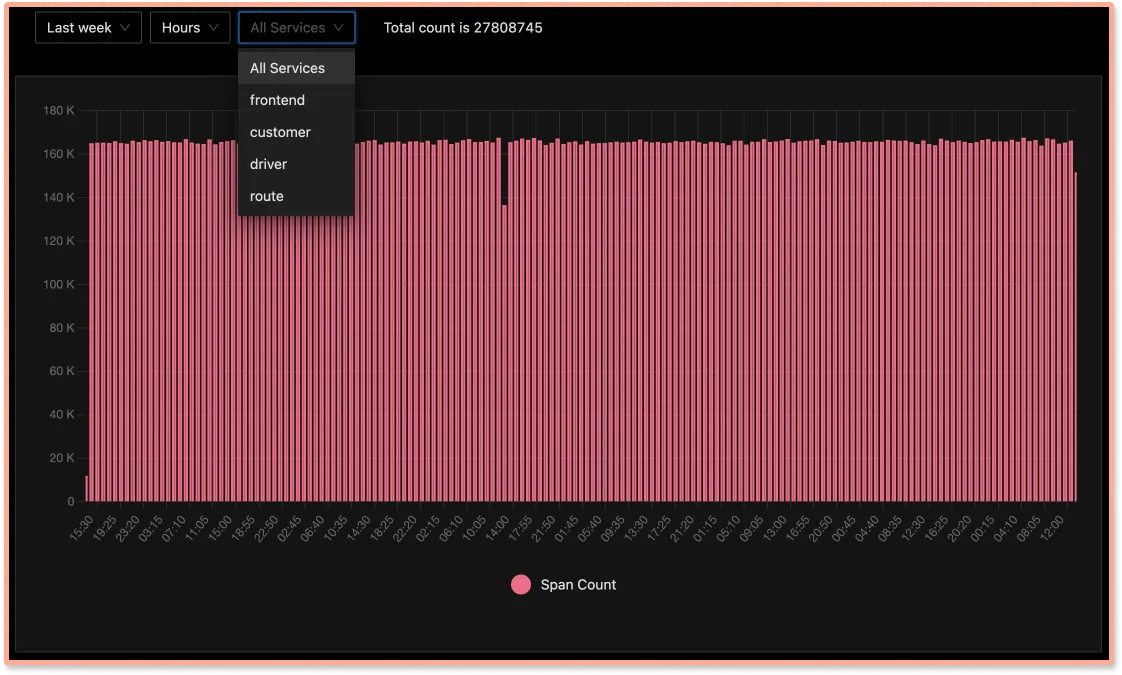
Transparent usage Data
You can drill down details of how many events is each application sending or at what granularity, so that you can adjust your sampling rate as needed and not get a shock at the end of the month ( case with SaaS vendors many a times)
Getting started with SigNoz
You can get started with SigNoz using just three commands at your terminal.
git clone -b main https://github.com/SigNoz/signoz.git
cd signoz/deploy/
./install.sh
For detailed instructions, you can visit our documentation.
If you liked what you read, then check out our GitHub repo 👇
Our slack community is a great place to get your queries solved instantly and get community support for SigNoz. Link to join 👇
SigNoz slack community
Related Content
Not 3 pillars but a single whole to help customers solve issues faster
An Open Source OpenTelemetry APM

