SigNoz - Open-Source Alternative to DataDog
More and more companies are now shifting to a cloud-native & microservices-based architecture. Having an application monitoring tool is critical in this world because you can’t just log into a machine and figure out what’s going wrong.
We have spent years learning about application monitoring & observability. What are the key features an observability tool should have to enable fast resolution of issues.
In our opinion, good observability tools should have
- Out of the box application metrics
- Way to go from metrics to traces to find why some issues are happening
- Seamless flow between metrics, traces & logs — the three pillars of observability
- Filtering of traces based on different tags and filters
- Ability to set dynamic thresholds for alerts
- Transparency in pricing
User experience not great in current open-source tools
We found that though there are open-source tools like Prometheus & Jaeger, they don’t provide a great user experience as SaaS products do. It takes lots of time and effort to get them working, figuring out the long-term storage, etc. And if you want metrics and traces, it’s not possible as Prometheus metrics & Jaeger traces have different formats.
SaaS tools like DataDog and NewRelic do a much better job at many of these aspects:
- They are easy to setup & get started
- Provide out-of-box application metrics
- Provides correlation between metrics & traces
But it has the following issues:
- Crazy node-based pricing, which doesn’t make sense in today’s micro-services architecture. Any node which is live for more than 8hrs in a month is charged. So, unsuitable for spiky workloads
- Very costly. They charge custom metrics for $5/100 metrics
- It is cloud-only, so not suitable for companies that have concerns with sending data outside their infra
- For any small feature, you are dependent on their roadmap. We think this is an unnecessary restriction for a product which developers use. A product used by developers should be extendible
To fill this gap we built SigNoz, an open-source alternative to DataDog.
Key Features of SigNoz - a DataDog alternative
Some of our key features which makes SigNoz vastly superior to current open-source products and a great alternative to DataDog are:
- Metrics, traces, and logs under a single pane of glass
- Correlation of telemetry signals
- Out of the box application metrics
- Seamless flow between metrics, traces & logs
- Filtering based on tags
- Custom aggregates on filtered traces
- Detailed Flamegraphs & Gantt charts
- Infrastructure dashboards
- Exceptions monitoring
- Transparent usage data & pricing
- OpenTelemetry-native
Application metrics
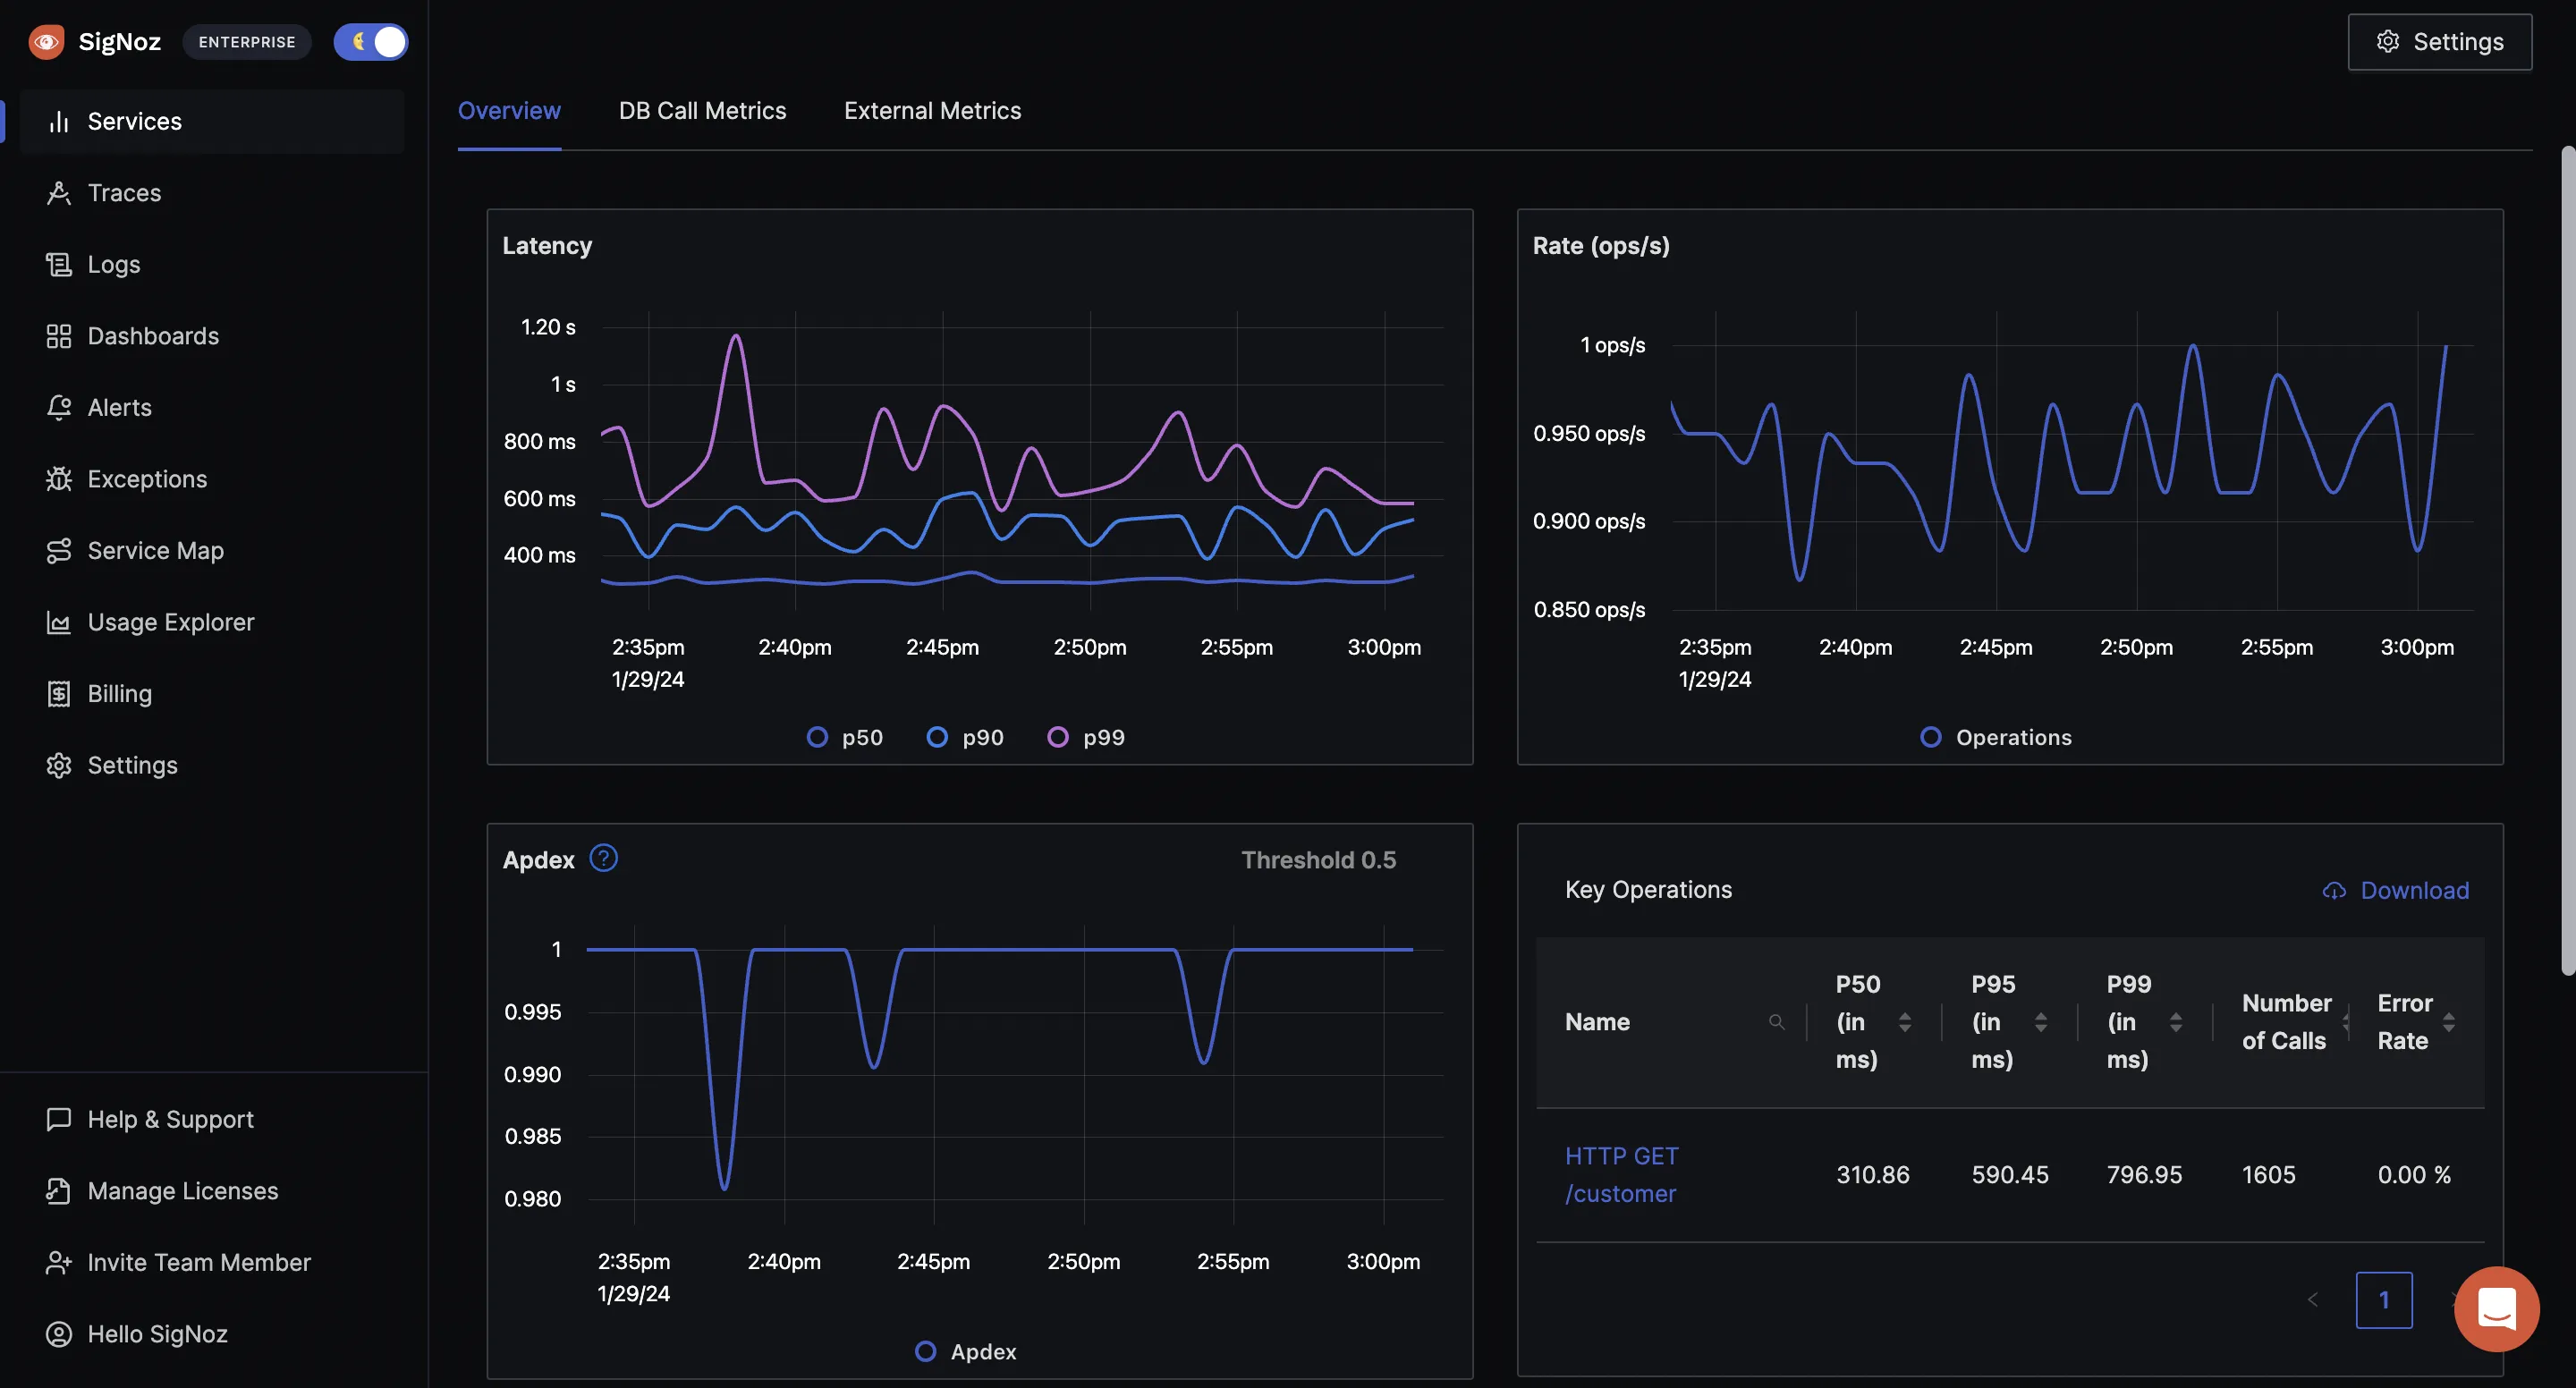
Get out of the box p90, p99 latencies, RPS, Error rates and top endpoints for a service out of the box.
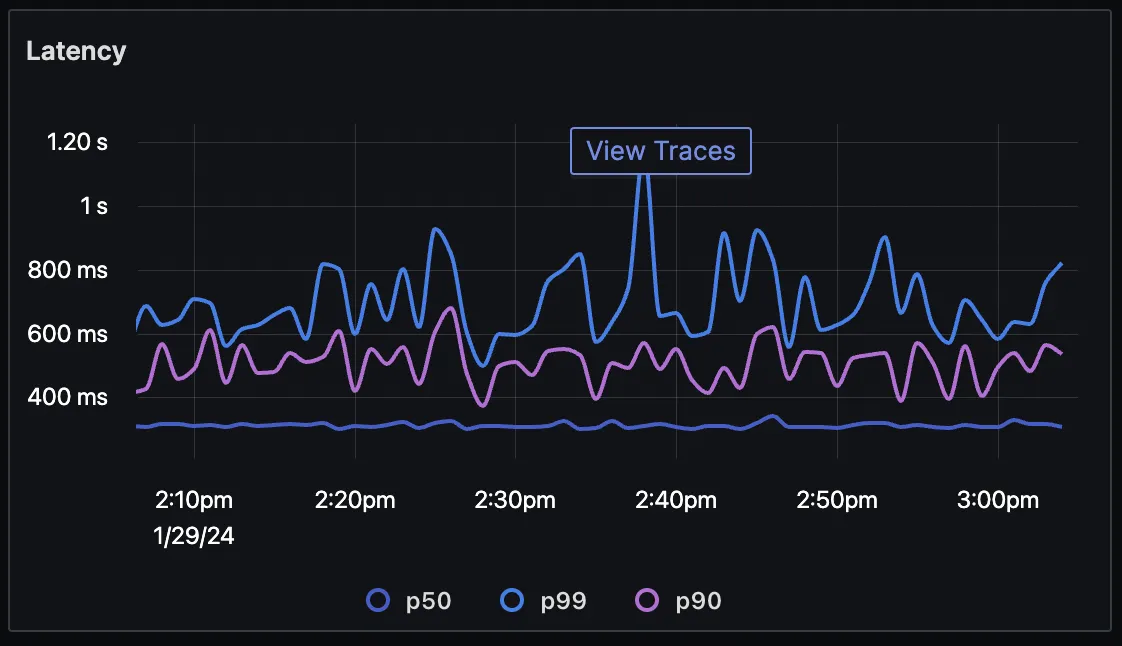
Seamless flow between metrics & traces
Found something suspicious in a metric, just click that point in the graph & get details of traces which may be causing the issues. Seamless, Intuitive.
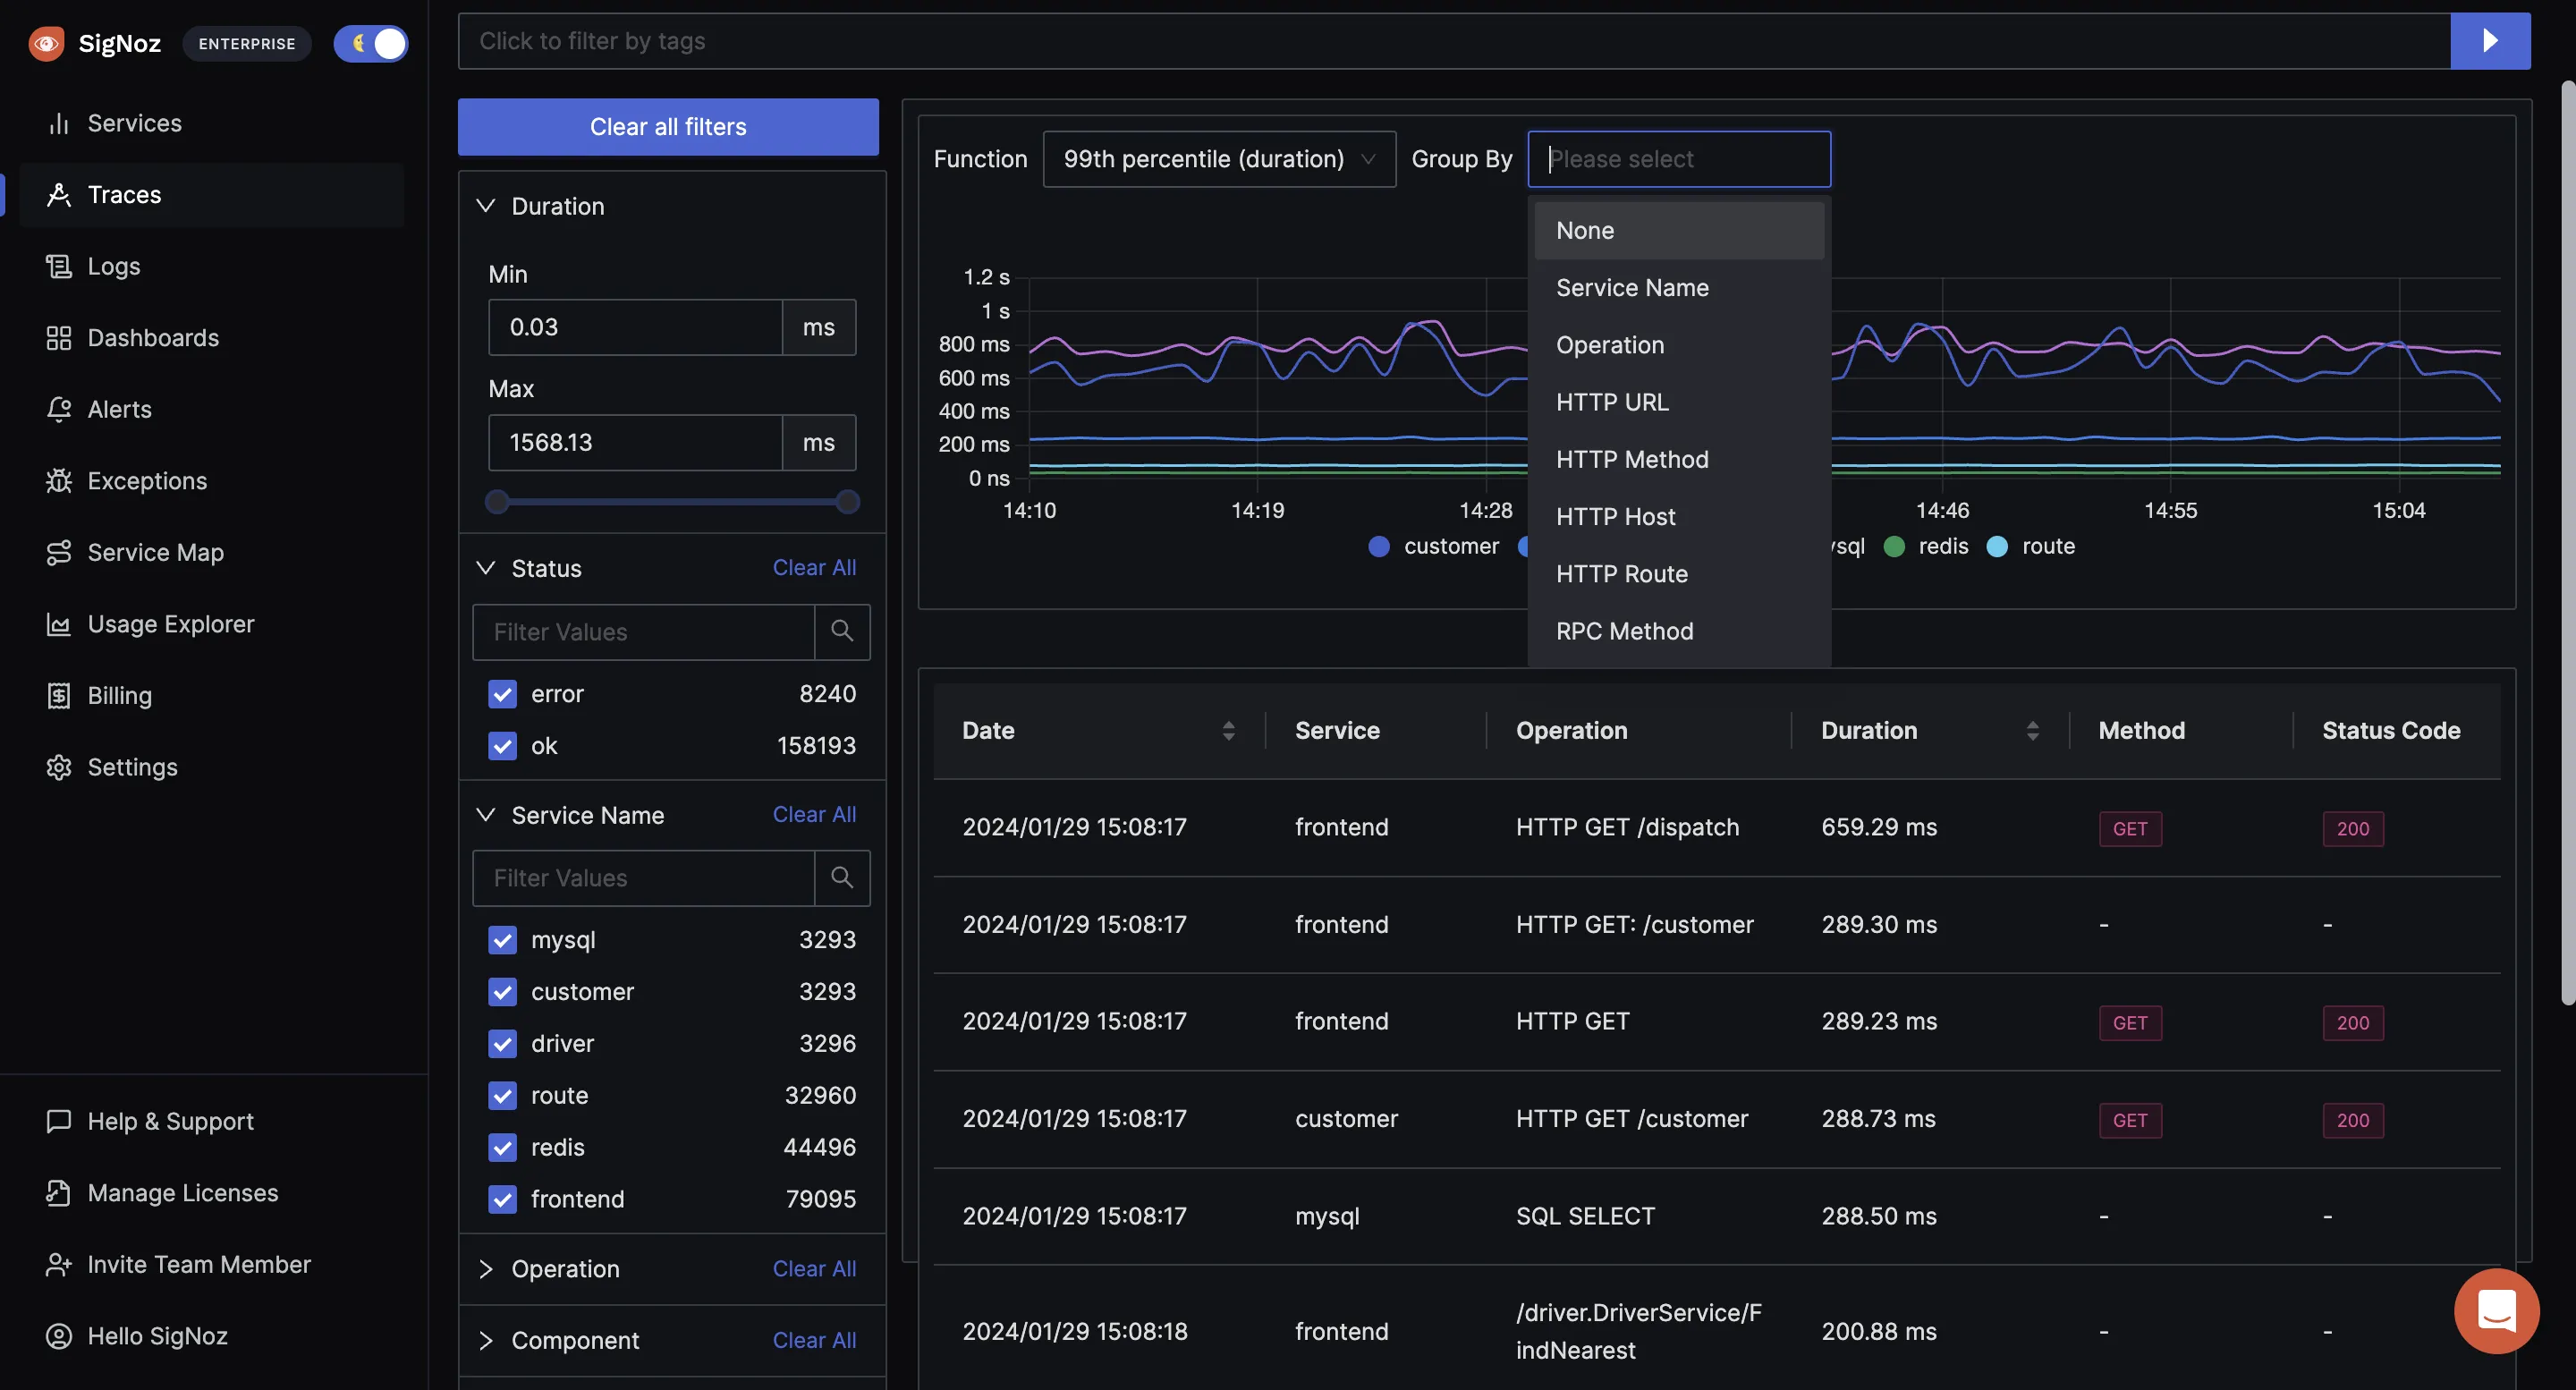
Advanced filters on trace data
Under our traces tab, you can analyze the traces data using filters based on tags, status codes, service names, operation, etc.
Using tags, you can find latency experienced by customers who have customer_type set as premium.
Custom aggregates
Create custom metrics from filtered traces to find metrics of any type of request. Want to find p99 latency of customer_type: premium who are seeing status_code:400. Just set the filters, and you have the graph. Boom!

Flamegraphs & Gantt charts
Detailed flamegraph & Gantt charts to find the exact cause of the issue and which underlying requests are causing the problem. Is it a SQL query gone rogue or a Redis operation is causing an issue? Get more context on your spans with tags and events.

Logs Management
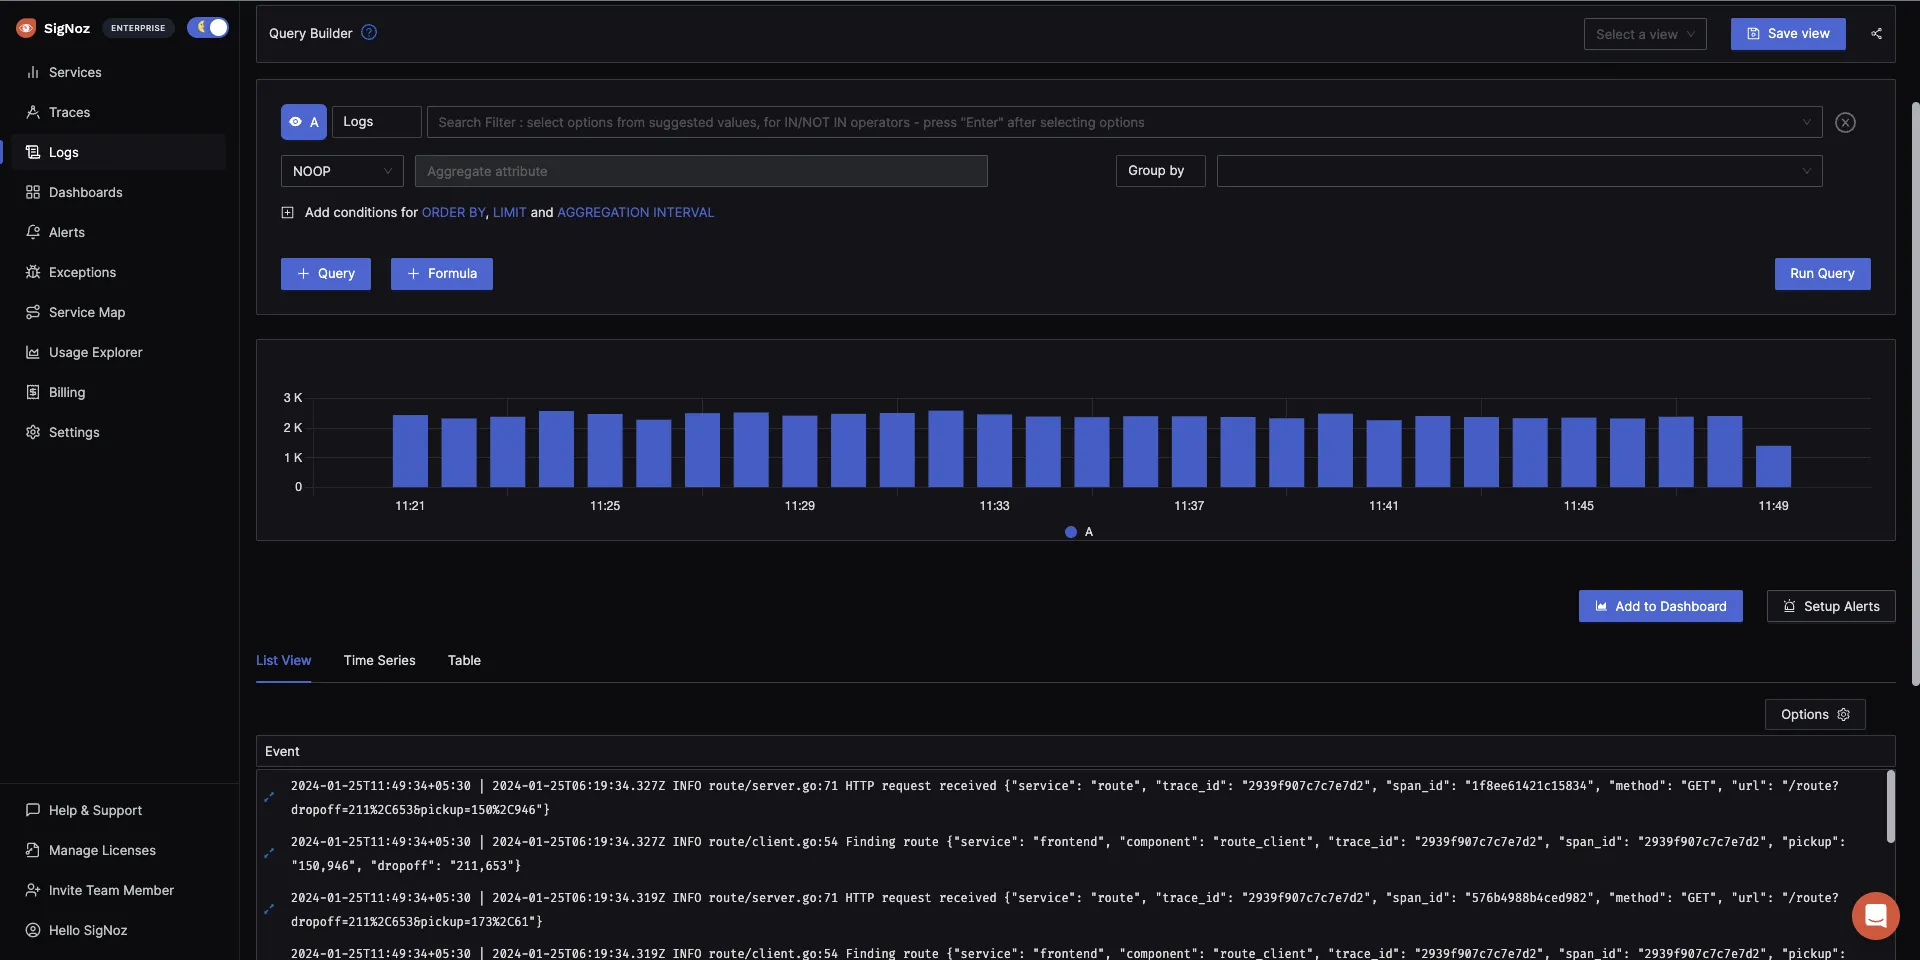
SigNoz provides Logs management with advanced log query builder. You can also monitor your logs in real-time using live tailing. SigNoz uses a columnar database ClickHouse to store logs, which is very efficient at ingesting and storing logs data. Columnar databases like ClickHouse are very effective in storing log data and making it available for analysis.
Transparent usage Data
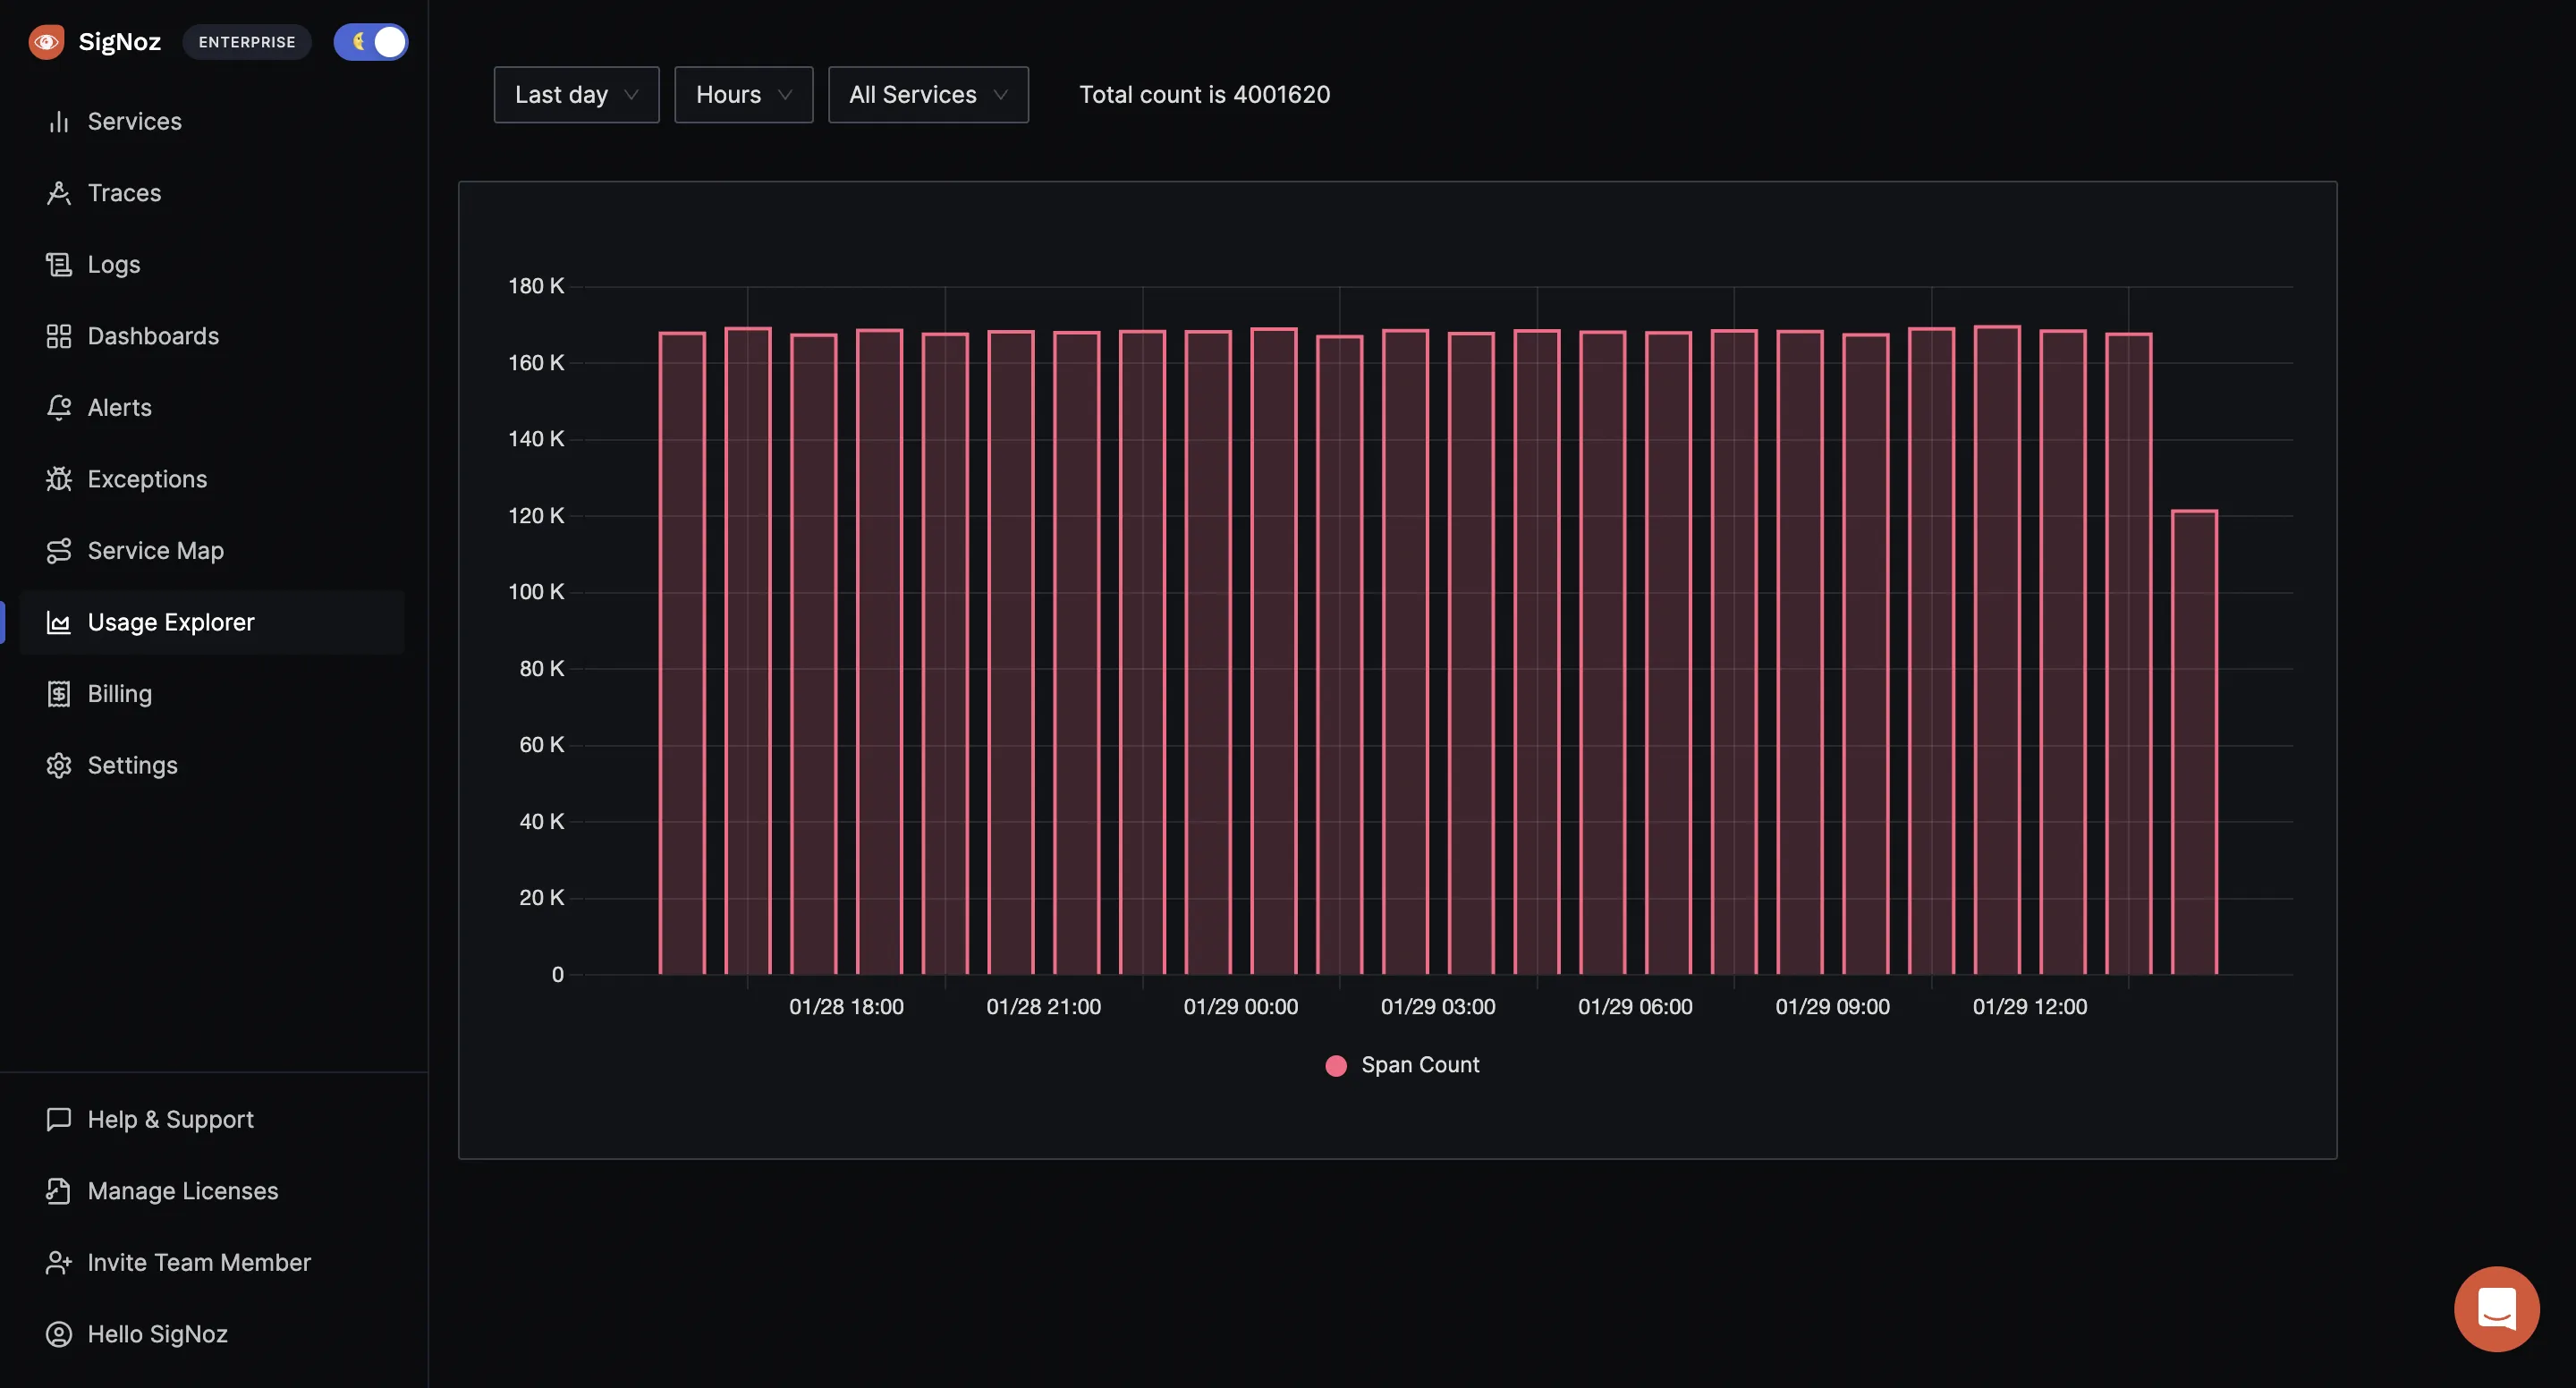
You can drill down details of how many events is each application sending or at what granularity, so that you can adjust your sampling rate as needed and not get a shock at the end of the month ( case with SaaS vendors many a times)
Getting started with SigNoz
SigNoz cloud is the easiest way to run SigNoz. Sign up for a free account and get 30 days of unlimited access to all features.
You can also install and self-host SigNoz yourself since it is open-source. With 16,000+ GitHub stars, open-source SigNoz is loved by developers. Find the instructions to self-host SigNoz.


