Top 13 Open Source APM Tools [2024 Guide]
Choosing the right APM tool is critical. How do you know which is the right one for you? Here are the top 13 open source application performance monitoring(APM) tools which can solve your monitoring needs.

What is an open source APM tool?
APM stands for Application Performance Monitoring. APM tools help you to monitor your application for any performance issues. When you opt for an open source APM tool, you get the added advantage of having access to the tool's source code. You can host the tool within your infra to adhere to data governance and privacy regulations.
Open source APM tools have added benefits over their SaaS counterparts. Open source tools are more transparent as you can verify its source code, and you can use it without going through the pains of taking approvals usually required for using a third-party vendor tool.
Benefits of Open Source APM tool over SaaS APM tools:
Customization - You can customize the tool's source code to suit your needs.
Self-hosting - You don't need to send your data outside your environment. With privacy laws becoming more stringent, this might be the future of APM tools.
Data Privacy and control - When you use a self-hosted open source apm, you don't have to send any data outside your infra. This gives user more control over their data. You don't have to worry about sending any PII data to third party tools.
Developer First - Your org's developers can look under the hood of an open source APM tool. They can decide for themselves whether the tool meets their requirements or not.
Community support - Open source tools have active communities around them. Communities ensure code accountability and support. You can directly influence a product's roadmap by raising GitHub issues.
But first, let's understand what is application performance monitoring and why is it needed?
What is application performance monitoring(APM)?
Application performance monitoring is the process of keeping your app's health in check. APM tools enable you to be proactive about meeting the demands of your customers. Some of the top metrics that APM tools monitor are application latency, error rate, and requests per second.
Why is application performance monitoring(APM) needed?
A robust APM tool can provide your engineering teams the much-needed visibility and context into the inner workings of your application. Modern distributed systems have enabled scale at a global scale but at the same time have increased the complexity of an application.
A few essential APM benefits in solving performance issues are as follows:
- Gives a centralized context and visibility into the app's inner workings across a distributed system
- Allows you to proactively identify issues that can cause breakdown and solves latency issues
- Helps you to meet end-user expectations and demands
- Increase revenue by protecting against downtime and user churn
- Saves engineering bandwidth in debugging and troubleshooting
List of top 13 open source APM tools in 2024
- SigNoz
- Graphite
- Pinpoint
- Prometheus
- Javamelody
- Stagemonitor
- Scouter
- Zipkin
- Jaeger
- Apache Skywalking
- Elastic APM
- App Metrics
- Glowroot
Top Open Source APM Tools
Now let's explore the top 13 open source APM tools in 2024.
SigNoz

- Github stars: 15.7k
- Alternative to: Datadog, New Relic, Dynatrace
- SigNoz on GitHub
SigNoz is a full-stack open source APM and observability tool. It provides logs, metrics, and traces under a single pane of glass. It is built to support OpenTelemetry natively, and uses Clickhouse - a powerful OLAP database for faster ingestion and aggregations.

SigNoz has most features that vendors like Datadog offers. The feature set covers capabilities across the three telemetry signals: logs, metrics, and traces. You can monitor APM metrics like user requests for each of your applications, error rate, app latencies, etc.
Using distributed tracing, you can identify the root cause of performance issues. The logs tab in SigNoz comes with advanced query builder, multiple compact views, and live tail logging.
Open Source license and Cloud Option
SigNoz Open Source is free to use. You can get started with the open source by using Docker, Docker Swarm or Kubernetes. You can find the instructions to self-host SigNoz here.
Signing up for SigNoz cloud gives you the most easiest way to get started with SigNoz. The cloud version gives you access to some paid-only features as well as customer support. SigNoz can help you save up to 86% of your Datadog bill. Here's a pricing comparsion with detailed spreadsheet.
Graphite
🌐 Website
💻 GitHub
Graphite is a time-series monitoring tool that was released in 2008. Graphite consists of three software components:
- carbon - a service that listens for time-series data
- whisper - a database library for storing time-series data
- graphite-web - Graphite's user interface & API for rendering graphs and dashboards
The primary purpose of Graphite is to store numeric time-series data and render graphs of this data. Time-series data is a sequence of data points for a particular metric indexed over time. It can give you insights into the performance of any application, process, or service.
Graphite does not do data collection. Instead, your app needs to be configured to send data to Graphite which passively listens for data using Carbon - a Twisted daemon. Carbon then sends the data to Whisper to store the time-series data to a filesystem.
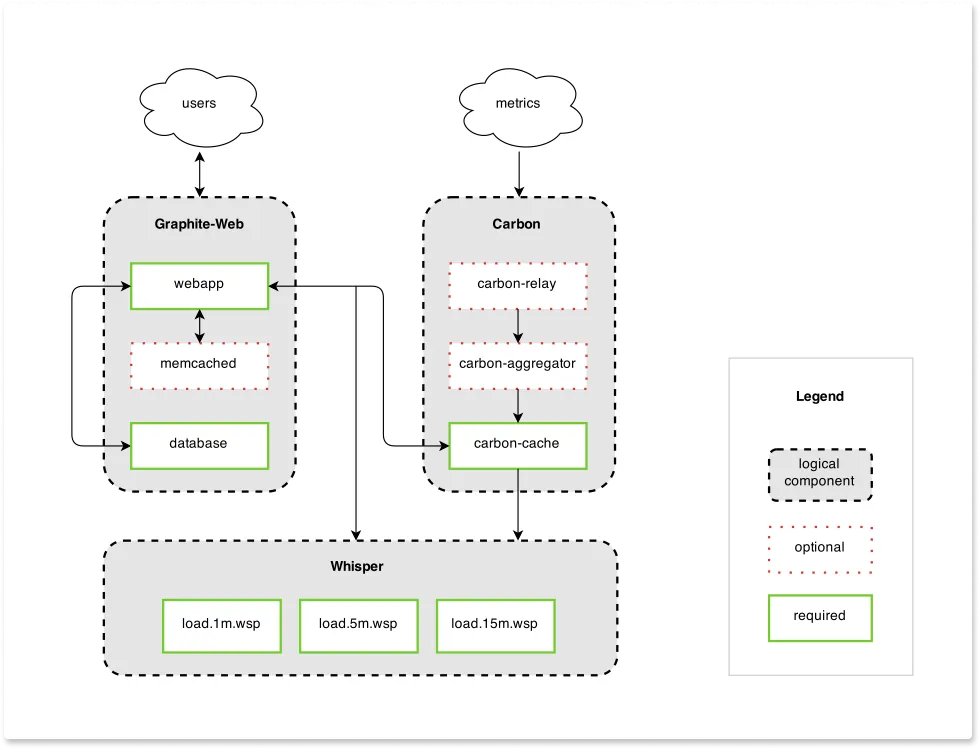
Graphite comes with an in-built UI, but that is fairly basic. Usually, for visualizations, Graphite is clubbed together with Grafana, which is an open source visualization tool.
Pinpoint
🌐 Website
💻 GitHub
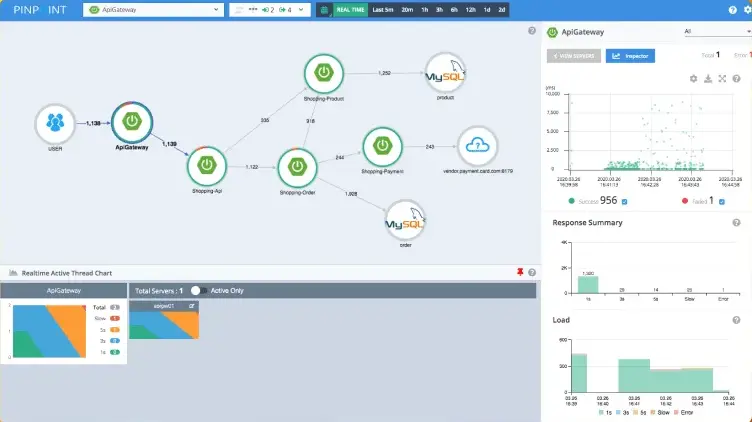
Pinpoint is an open source APM tool meant for large-scale distributed systems written in Java, Python, or PHP. This project is inspired and modeled after Google's Dapper. It traces transactions across different components of an application and provides insights to identify potential issues. Some of the key features of the Pinpoint APM tool includes:
- Application topology at a glance
- Real-time application monitoring
- Code-level visibility to every transaction
- APM agents which require minimal changes to code
- Minimal impact on performance
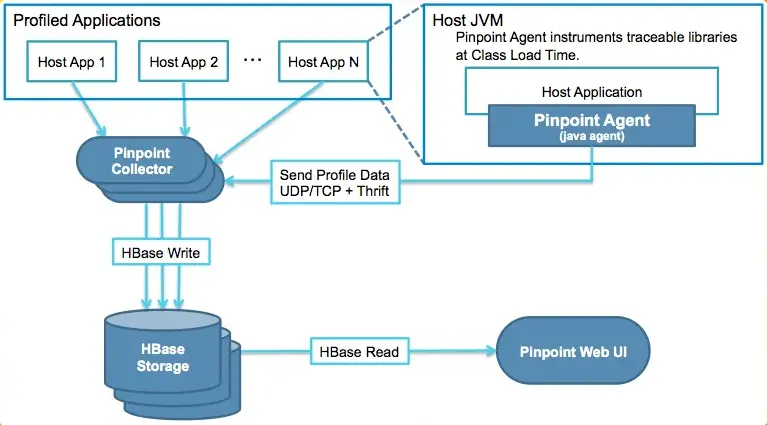
The main purpose of the Pinpoint APM tool is to identify and track how transactions flow between different components of a system. It does not track logs and metrics.
Prometheus
🌐 Website
💻 GitHub
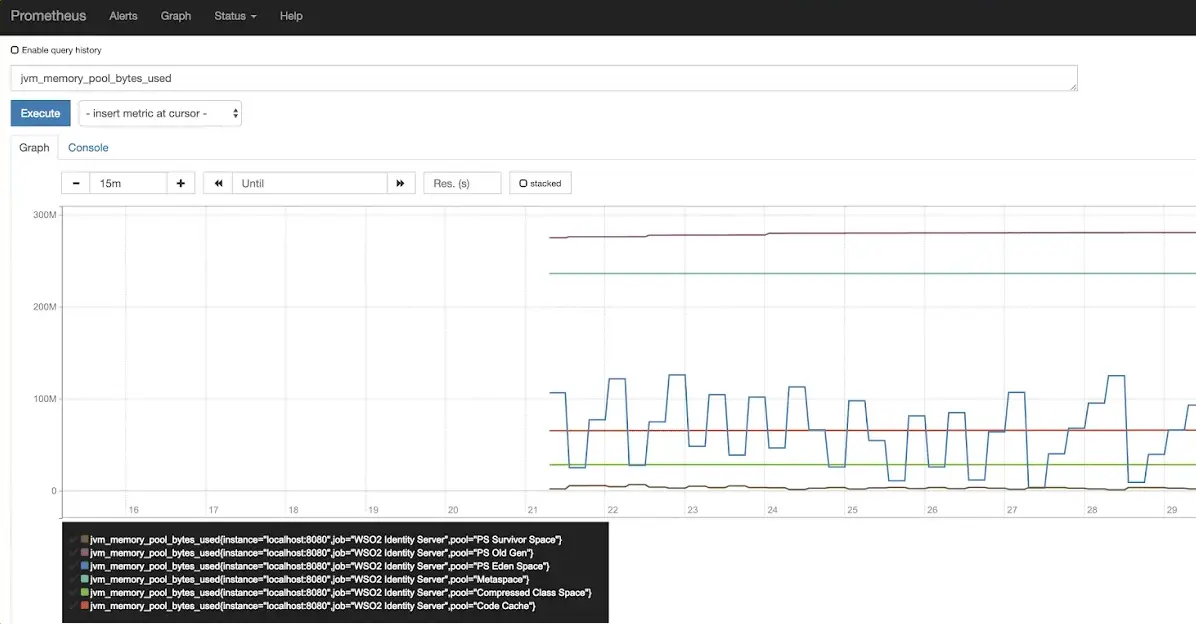
Prometheus enables you to capture time-series data as metrics. These metrics can be aggregated to give insights into the behavior of our systems.
It was initially developed at SoundCloud in 2012 before being released as an open-source project. It was the second project to graduate from CNCF after Kubernetes.
Prometheus monitoring stack includes the following components:
- Prometheus server
- Client Libraries & Exporters
- Push Gateway
- Alertmanager
- Visualization Layer
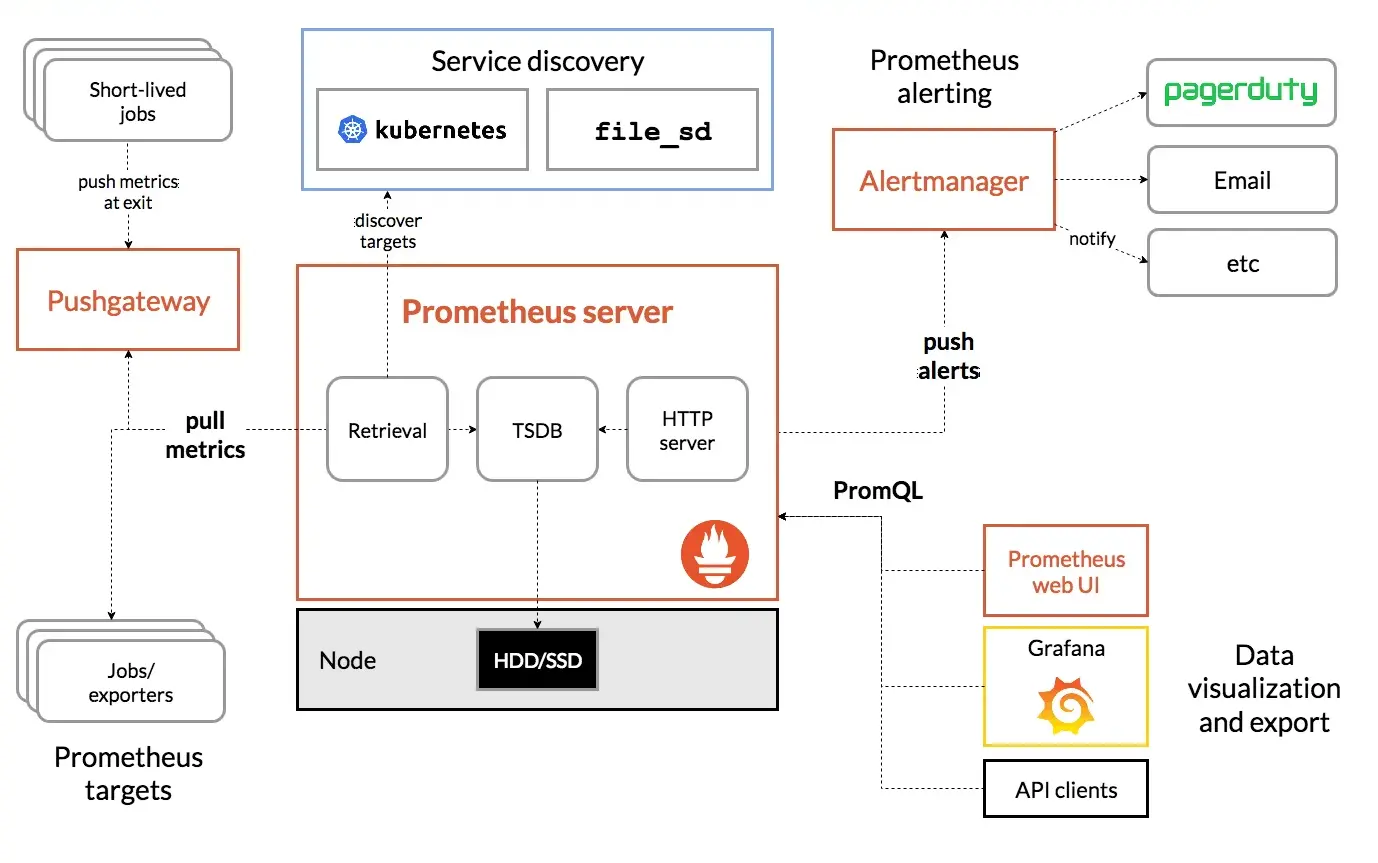
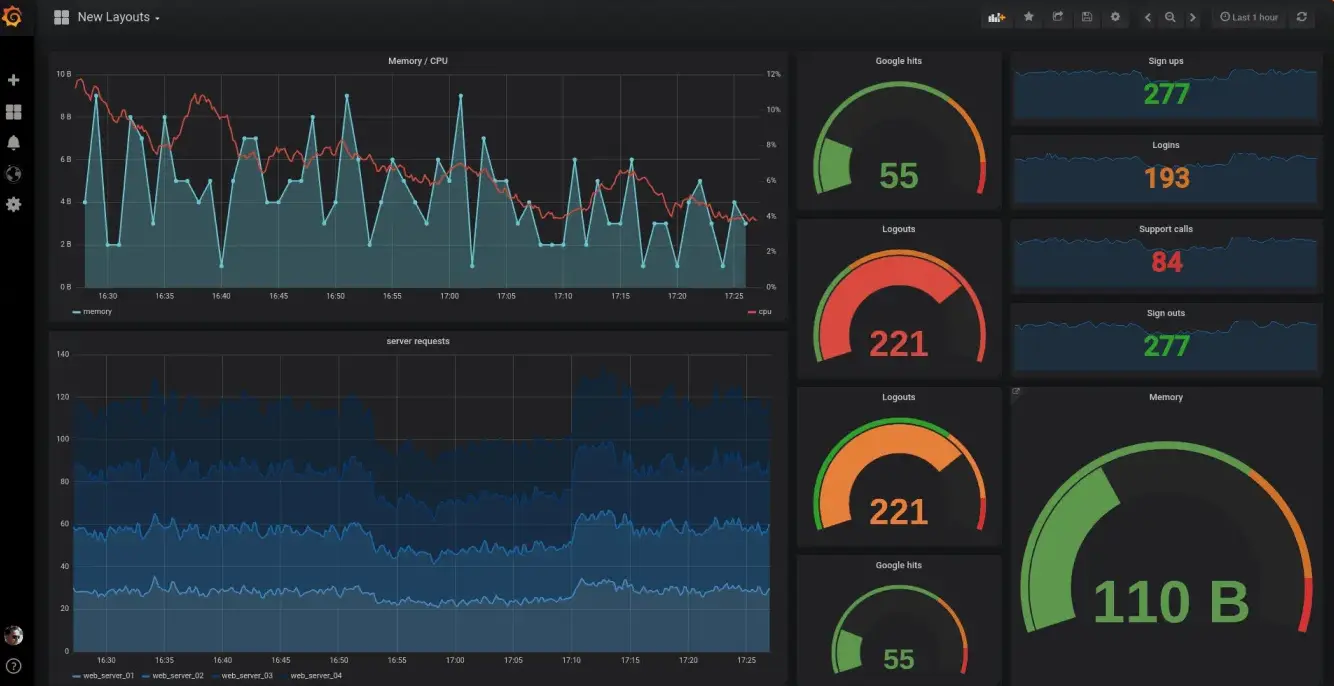
Prometheus does not do distributed tracing but can be used effectively to monitor time-series data as metrics. It also has some limitations at scale as it is designed for a single machine. The visualization layer of Prometheus is basic, but it is generally used with Grafana, a visualization tool to create charts and graphs.
Javamelody
💻 GitHub
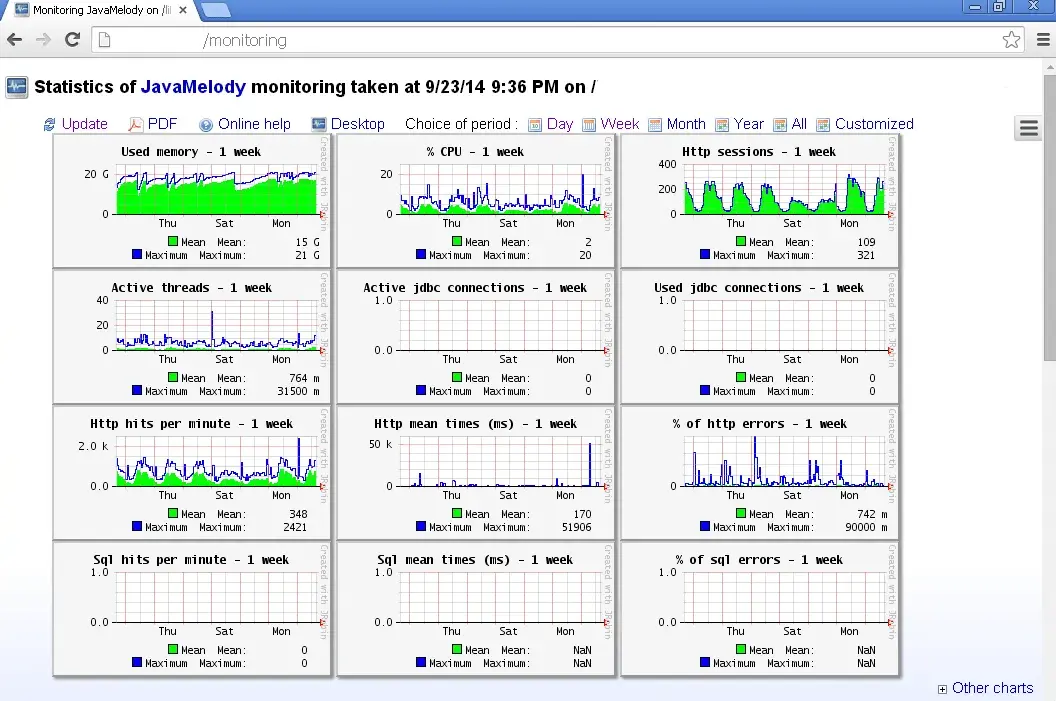
Javamelody is an open source APM tool that aims to monitor Java or Java EE applications in QA and production environments. It is mainly used to track and measure the statistics of requests on an application based on its usage.
Some of the key metrics captured by the Javamelody APM tool are as follows:
- Number of executions, mean execution time
- percentage of errors of HTTP requests, SQL requests, JSF actions, struts actions
- Java memory usage and CPU usage
- Number of user sessions
- Number of JDBC connections
Stagemonitor
🌐 Website
💻 GitHub
Stagemonitor is an open source APM tool for Java server applications. It enables you to monitor the performance of your Java web app throughout its lifecycle in development, QA, and production. It monitors applications with the help of servlet filters and bytecode manipulation.
Stagemonitor integrates well with time-series databases like ElasticSearch, Graphite, and InfluxDB to analyze graphed metrics and Kibana to analyze requests and call stacks.
Some of the key features of Stagemonitor APM tool includes:
- Development-time Monitoring
- Production Monitoring
- Preconfigured Dashboards

Scouter
💻 GitHub
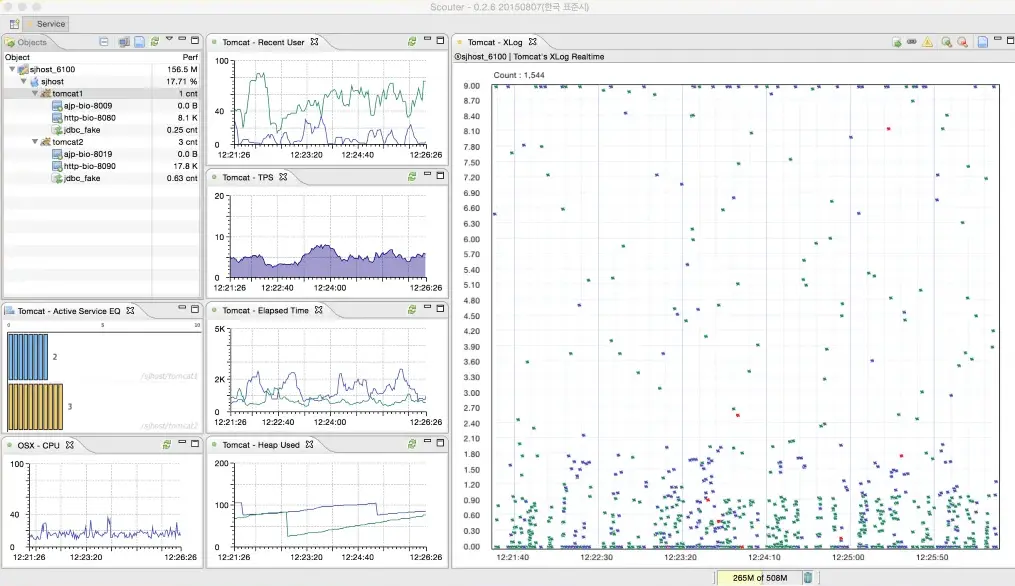
Scouter is an open source APM tool written in Java, Javascript, and Scala. It captures and shows metrics about users, services, and resources. Some of the key metrics that Scouter captures:
- Users - active users and recent users
- Services - Active service, TPS, Response time, Application profiles
- Resources - Cpu, Memory, Network and Heap usage, Connection pools, etc.
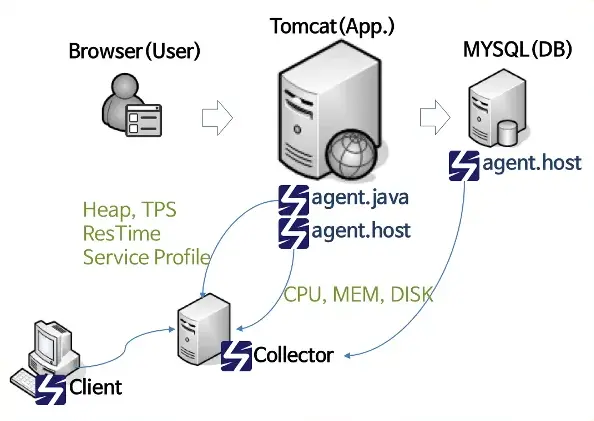
Scouter's architecture consists of the following components:
- Server also called Collector to process data transferred by the host
- Host Agent to capture metrics for CPU, Memory, Disk performance
- Java Agent to capture performance data of the Java program such as heap memory, thread, profiles
- Client(Viewer) to visualize collected data
Zipkin
🌐 Website
💻 GitHub
Zipkin is an open source APM tool used for distributed tracing. Zipkin captures timing data need to troubleshoot latency problems in service architectures. In distributed systems, it's a challenge to trace user requests across different services. If a request fails or takes too long, distributed tracing helps to identify the events that caused it.
Zipikin was initially developed at Twitter and drew inspiration from Google's Dapper. Unique identifiers called Trace ID are attached to each request which then identifies that request across services.
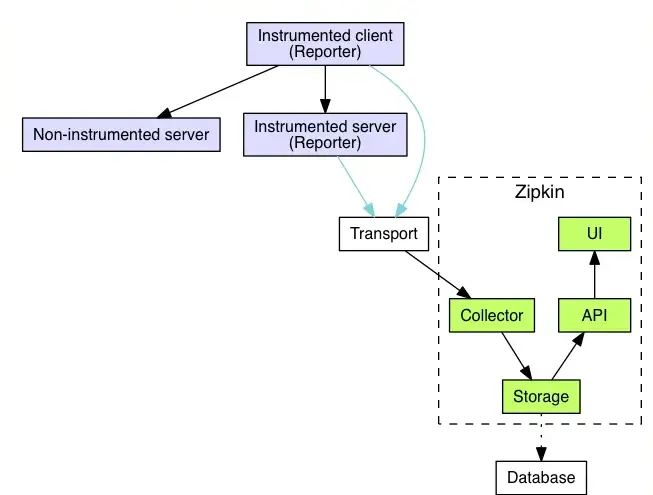
Zipkin's architecture includes:
- Reporters to send data to Zipkin
- Collectors which persist trace data to storage
- API to query data
- UI
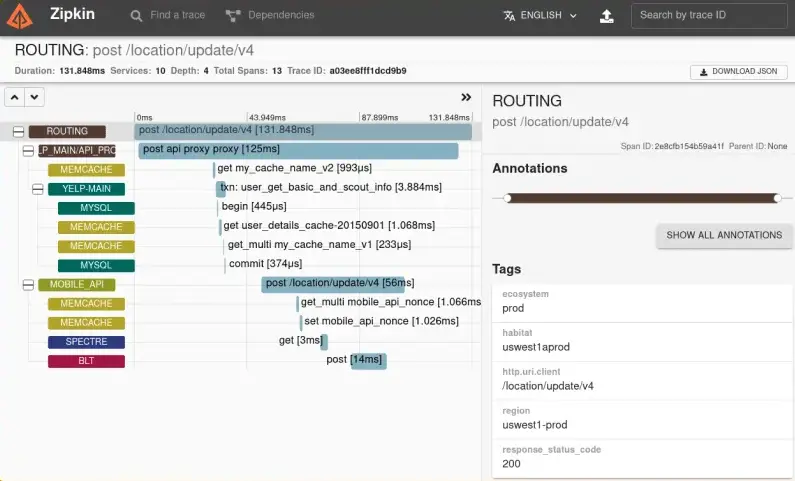
Zipkin's in-built UI is limited, and you can use Grafana or Kibana from the ELK stack for better analytics and visualizations.
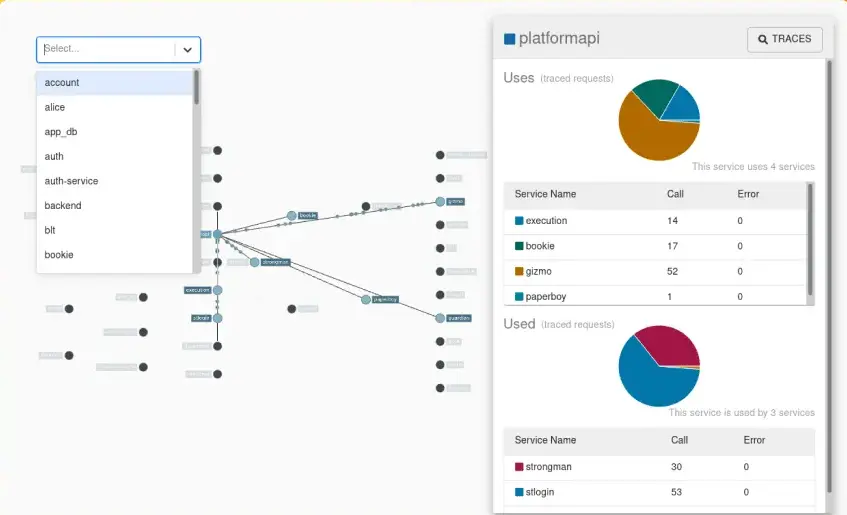
It also includes a dependency diagram that shows how many user requests went through each service. It can help you to identify error paths and calls to deprecated services.
Jaeger
🌐 Website
💻 GitHub
Jaeger is an open source APM tool developed at Uber, which was later donated to Cloud Native Computing Foundation(CNCF). Inspired by Google's Dapper, Jaeger is a distributed tracing system.
It is used for monitoring and troubleshooting microservices-based distributed systems. Some of its key features include:
- Distributed context propagation
- Distributed transaction monitoring
- Root cause analysis
- Service dependency analysis
- Performance / latency optimization
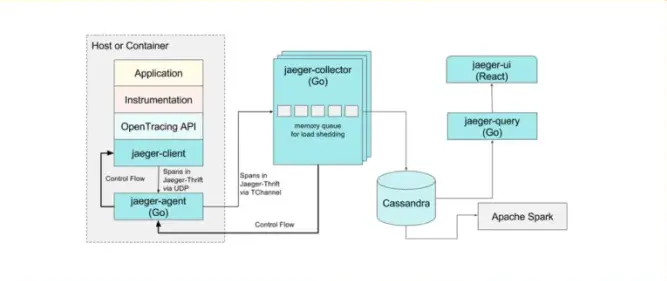
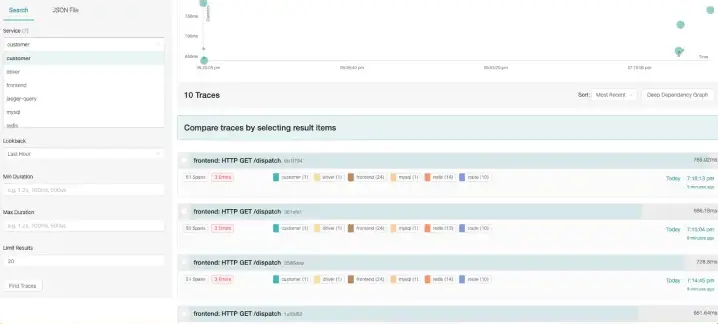
Jaeger supports two popular open source NoSQL databases as trace storage backends: Cassandra and Elasticsearch. Jaeger's UI can be used to see individual traces. You can also filter the traces based on service, duration, and tags.
Apache Skywalking
🌐 Website
💻 GitHub
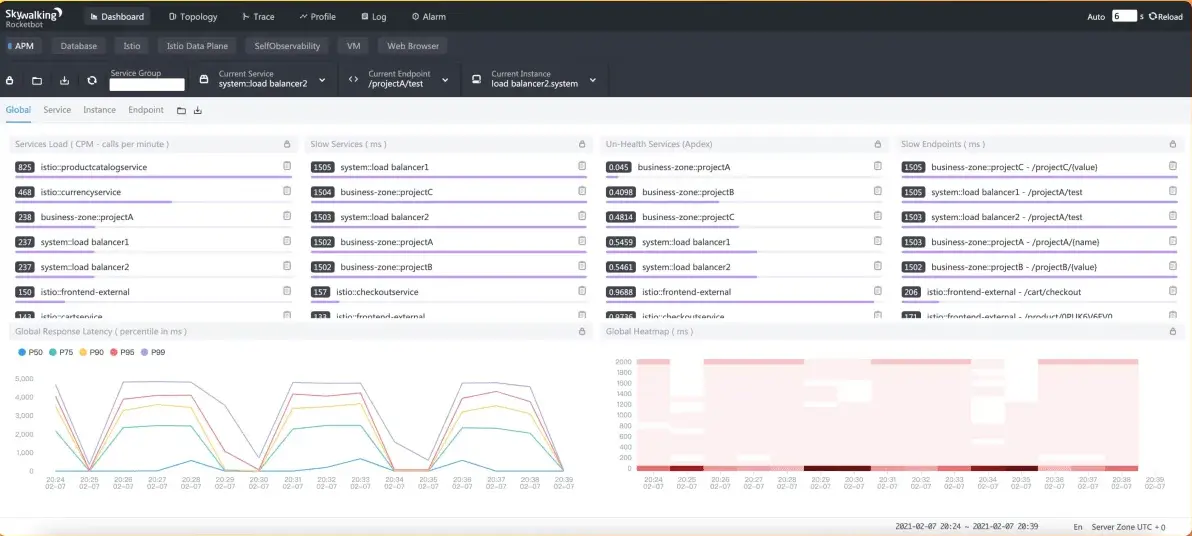
This open source APM tool is focused on monitoring distributed systems, including microservices, cloud-native, and container-based architectures. Some of the key features of the APM tool includes:
- Service, service instance, endpoint metrics analysis
- Root cause analysis with code profiling
- Service topology map analysis
- Slow services and endpoint detection
- Distributed tracing and context propagation
Skywalking also supports the collection of telemetry data in multiple formats.
Elastic APM
🌐 Website
💻 GitHub
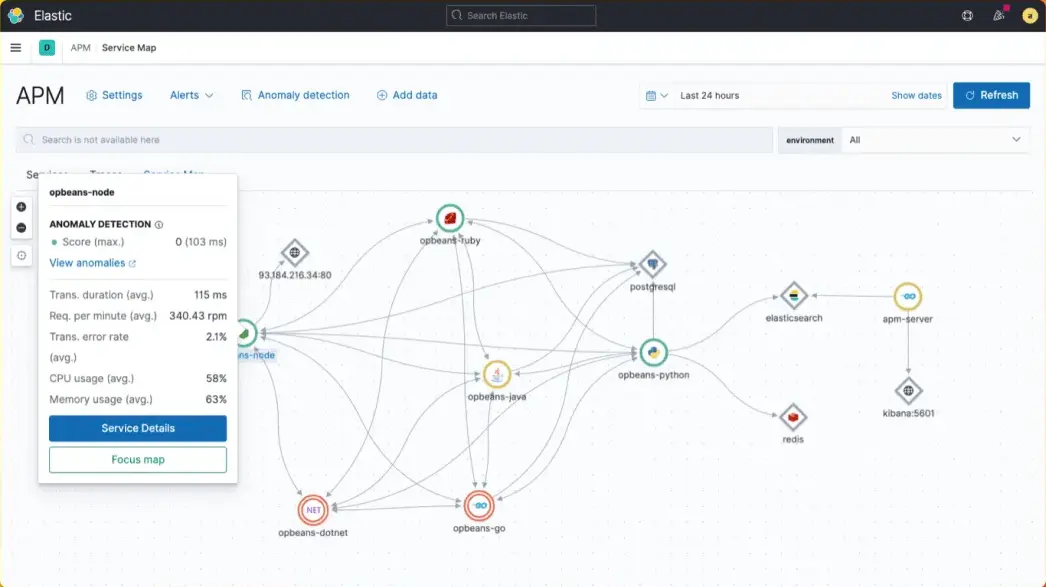
You might already be familiar with Elasticsearch. Elastic APM is an open source application performance monitoring tool built on top of the ELK stack (Elasticsearch, Logstash, Kibana). It consists of 4 main components:
- APM agents - These are open source libraries installed in your services for collecting performance data.
- APM server -It is a separate component that is free and open source. It receives performance data from the APM agents. The APM server validates and processes events from the APM agents.
- Elasticsearch - It is used to store the APM performance metrics.
- Kibana - It is a visualization platform designed to work with Elastsearch.

With Kibana, you can have visualize your requests and services.
App Metrics
🌐 Website
💻 GitHub
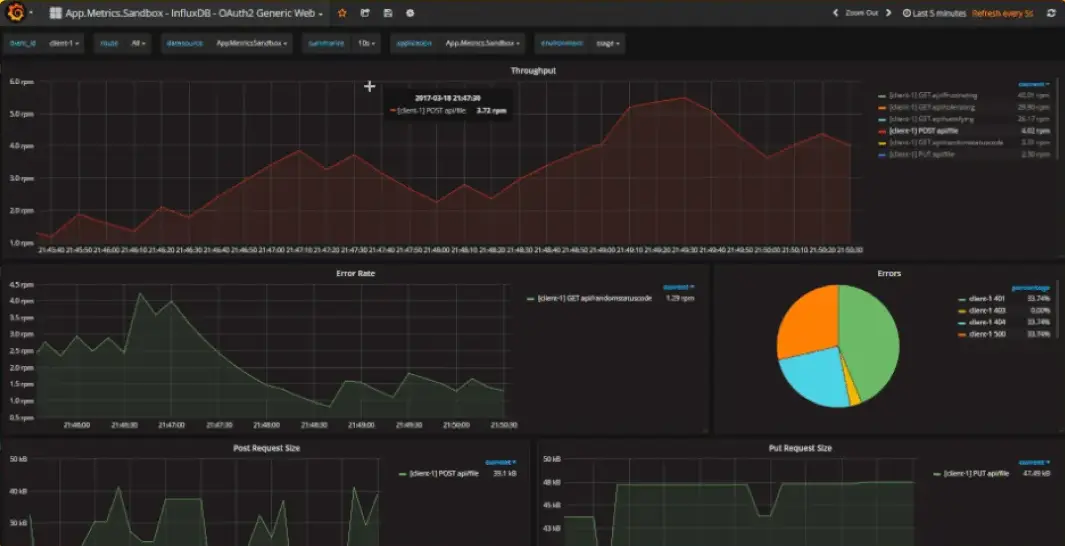
App Metrics is an open source and cross-platform .NET library that can be used to capture application metrics within any .NET application. App Metrics provides extensions to report to various open source time-series databases. It also provides dashboards to visualize application metrics in real-time. Some of the key features of this open source APM tool includes:
- Track metrics for any type of .NET applications
- Measure the performance and error of each endpoint in an MVC or Web API project
- Freedom to choose where to persist captured metrics and which dashboard tool to use for visualization
App Metrics does not include a visualization tool, but it does provide App Metrics specific Grafana dashboards.
Glowroot
🌐 Website
💻 GitHub
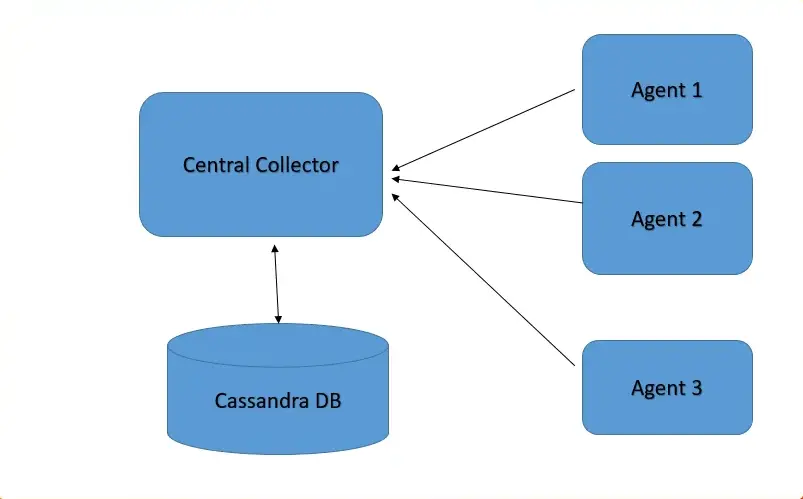
Glowroot is an open source Java APM tool. It is used to monitor Java-based applications. Glowroot can be implemented in two ways:
- With embedded collectors that can be used to monitor stand-alone applications
- With central collector that can be used to monitor distributed systems
Glowroot agents help to capture metrics like:
- API’s average response time
- The average time taken by DB queries
- Trace capture for slow requests and errors
- Continuous profiling
How to choose the right open source APM tool for you?
Choosing the right open source APM tool is critical to your team's ability to monitor and troubleshoot issues in your deployed application. If you are going for an open source tool, you must ensure that the tool is being actively developed on GitHub. You can ask yourself the following questions before choosing any open source tool:
- How recent was the last commit made?
- Are the maintainers of the repo responsive?
- How active is the community around the tool?
- Is the tool based on the latest industry-standard components?
But this is just one aspect. Another aspect is whether the tool serves all your needs for application monitoring or not. You don't want your team to manage multiple tools for end-to-end visibility into the performance of your apps.
Logs, metrics, and traces form the three cornerstones of full-stack APM tools. In that scenario, a tool like SigNoz can serve all your needs for application monitoring. As the instrumentation is based on OpenTelemetry, you also have the added advantage of not being locked into any product.
Getting started with SigNoz
SigNoz cloud is the easiest way to run SigNoz. Sign up for a free account and get 30 days of unlimited access to all features.
You can also install and self-host SigNoz yourself since it is open-source. With 16,000+ GitHub stars, open-source SigNoz is loved by developers. Find the instructions to self-host SigNoz.
Further Reading
Kubernetes Monitoring Tools
New Relic Alternatives
Log Monitoring


