NGINX Logging | Configuring Error and Access Logs, Sending Nginx Logs to Syslog & more
NGINX is a prominent web server, reverse proxy server, and mail proxy utilized by many websites and applications to serve content to their users. One important aspect of managing a web server is logging, which refers to the process of recording information about the server's activity and performance.
In NGINX, logging is done using the error_log and access_log directives.
error_log directive specifies the file where NGINX should log errors.
access_log directive specifies the file where NGINX should log information about incoming requests and responses.
What are Nginx Error Logs?
The error_log directive is typically used to log information about errors and other important events that occur on the server. This can include messages about failed requests, issues with the server configuration, and other issues that may require attention.
An example of an error log is shown in the picture below:

What are Nginx Access Logs?
The access_log directive, on the other hand, is used to log information about incoming requests and responses. This can include details such as the IP address of the client making the request, the URL of the requested resource, the response status code, and the size of the response.
An example of access logs is shown in the picture below:

NGINX logs can be useful for various purposes, including tracking the server's performance, identifying potential issues or errors, and analyzing the usage patterns of the server. However, managing logs can also be challenging, as they can quickly grow in size and become difficult to manage.
In this tutorial, we will illustrate how to handle NGINX logs with an open source log management tool - SigNoz.
Let's get started.
Prerequisites
- Docker
- Nginx
Installing SigNoz
SigNoz may be installed in three simple steps on macOS or Linux PCs using a simple install script.
Docker Engine is installed automatically on Linux by the installation script. However, before running the setup script on macOS, you must manually install Docker Engine.
git clone -b main https://github.com/SigNoz/signoz.git
cd signoz/deploy/
./install.sh
You can visit the documentation for instructions on how to install SigNoz using Docker Swarm and Helm Charts.
Installing Nginx
Installing NGINX on Linux
sudo apt update
sudo apt install nginx
To start NGINX
service nginx start
Installing NGINX on Mac
You can install NGINX on Mac using Homebrew :
brew install nginx
To start NGINX:
brew services start nginx
You can then access your NGINX server on localhost. Go to http://localhost, and you should see a screen like the one below.

Configuring NGINX to generate access logs
Let's go ahead and make the necessary changes to the nginx.conf file in order to change the location and structure of the logs.
By default, NGINX logs all incoming requests to the access.log file in the /var/log/nginx directory. The format of the log entries in this file is defined by the log_format directive in the NGINX configuration file.
Let’s define the custom Nginx log pattern to the nginx.conf file in the directory /etc/nginx/nginx.conf, as shown below.
log_format logger-json escape=json
'{'
'"source": "nginx",'
'"message":"nginx log captured",'
'"time": $time_iso8601,'
'"resp_body_size": $body_bytes_sent,'
'"host": "$http_host",'
'"address": "$remote_addr",'
'"request_length": $request_length,'
'"method": "$request_method",'
'"uri": "$request_uri",'
'"status": $status,'
'"user_agent": "$http_user_agent",'
'"resp_time": $request_time,'
'"upstream_addr": "$upstream_addr"'
'}';
When configuring the server's access logs, we provide the preferred log_format (logger-json) in a server directive.
Make a log format with the name and pattern shown below.
http {
        sendfile on;
        tcp_nopush on;
        tcp_nodelay on;
        keepalive_timeout 65;
        types_hash_max_size 2048;

                log_format logger-json escape=json '{"source": "nginx","message":"nginx log captured","time": $time_iso8601, "resp_body_size": $body_bytes_sent, "host": "$http_host", "address": "$remote_addr", "request_length": $request_length, "method": "$request_method", "uri": "$request_uri", "status": $status,  "user_agent": "$http_user_agent", "resp_time": $request_time, "upstream_addr": "$upstream_addr"}';

        include /etc/nginx/mime.types;
        default_type application/octet-stream;

        ##
        # Logging Settings
        ##

        access_log /home/user/Work/logs/access.log logger-json;
}
A list of available variables can be found here.
Restart the Nginx for the config to take effect:
sudo service nginx restart
Note: The nginx config path for Mac OS will be under
/usr/local/etc/nginx. So please ensure to update the config properly.
Go to url http://localhost and now look at the access.log file.
Every line in the access.log file, which is in /home/user/Work/logs/access.log, has one log record. One example of a log record is shown below.
{
  "source": "nginx",
  "message": "nginx log captured",
  "time": 2022-12-11T03:52:58-08:00,
  "resp_body_size": 396,
  "host": "192.168.1.2",
  "address": "192.168.1.8",
  "request_length": 198,
  "method": "GET",
  "uri": "/",
  "status": 200,
  "user_agent": "PostmanRuntime/7.29.2",
  "resp_time": 0.000,
  "upstream_addr": ""
}
You can view the access.log file through the terminal using the cat command as shown below.
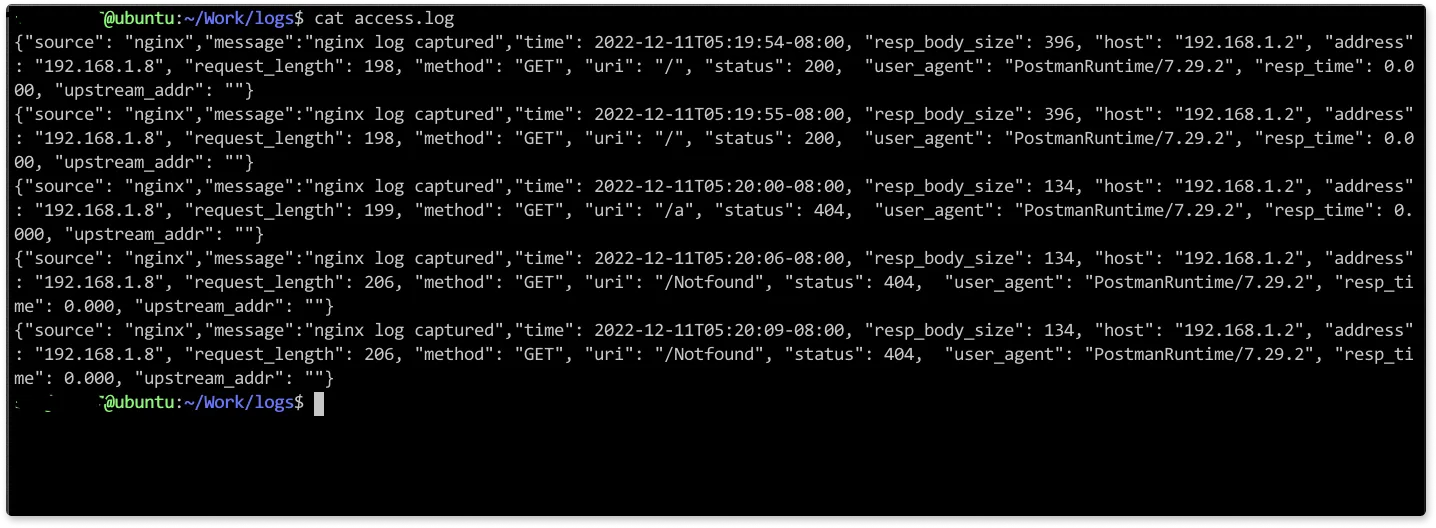
The next step is to send these logs to the SigNoz platform.
Configuring NGINX to generate error logs
To enable the error log, choose the log level and log file location. Using the error log directive in the nginx.conf configuration file, you may select the log level as shown below:
error_log  /home/user/Work/logs/nginx_error.log emerg;
error_log  /home/user/Work/logs/nginx_info.log info;
There are several levels of error logging that you can use to specify the types of errors that should be logged. These log levels are:
debug: Debug-level messages are very detailed and are typically used for debugging purposes.info: Information-level messages are used to log important events, such as the start and stop of the Nginx server.notice: Notice-level messages are used to log events that are not necessarily error conditions, but are worth noting.warn: Warning-level messages are used to log potential error conditions that may require attention.error: Error-level messages are used to log actual error conditions that have occurred.crit: Critical-level messages are used to log very severe error conditions that may require immediate attention.alert: Alert-level messages are used to log conditions that require immediate action.emerg: Emergency-level messages are used to log conditions that are so severe that the Nginx server may be unable to continue running.
You need to reload the nginx configuration for these changes to take effect. You can do this by running the command service nginx restart

Sending NGINX logs to Syslog
Syslog is a standard for logging system events. It is used to record and store the log messages produced by various system components, including the kernel, system libraries, and applications. Syslog provides a centralised method for managing and storing log messages, making it easier to monitor and resolve system issues.
To collect syslog from Nginx, you will need to configure Nginx to send its log messages to syslog.
Add the following line to the configuration file, replacing "syslog_server_hostname" with the hostname or IP address of your syslog server:
error_log syslog:server=syslog_server_hostname:54527,facility=local7,tag=nginx,severity=error;
access_log syslog:server=syslog_server_hostname:54527,facility=local7,tag=nginx,severity=debug;
Save the configuration file and restart Nginx.
Now, Nginx will send its log messages to the syslog server, which can be accessed and analyzed as needed.
There are several options that you can use to customize the way that Nginx sends syslog messages. Here are a few examples:
"facility": This option specifies the facility to which the log message should be sent. The facility is used to categorize log messages and can be used to filter log data on the syslog server. Common facilities include "local0" through "local7", "user", "daemon", and "system".
"tag": This option specifies a tag to be added to the log message. The tag can be used to identify the source of the log message, and can be used to filter log data on the syslog server.
"severity": This option specifies the severity level of the log message. Common severity levels include "emerg", "alert", "crit", "error", "warning", "notice", "info", and "debug".
💡 Note: The above configuration will send only error messages to syslog. If you want to send other log levels (e.g. info, warning, etc.), you can adjust the "severity" parameter in the configuration line.
To configure syslog on the signoz platform, refer this documentation.
NGINX Logging and Analysis with SigNoz
SigNoz is a full stack observability platform which provides metrics, traces and logs in a single pane. You can easily correlate these signals to get more contextual information while debugging your application.
SigNoz uses a columnar database ClickHouse to store logs, which is very efficient at ingesting and storing logs data. Columnar databases like ClickHouse are very effective in storing log data and making it available for analysis.
Using SigNoz for NGINX logs can make troubleshooting easier. SigNoz comes with an advanced log query builder, live tail logs, and the ability to filter log data across multiple fields.
Let us see how to collect and analyze Nginx logs with SigNoz.
Steps for collecting Nginx logs into SigNoz
Modify the docker-compose.yaml file present inside deploy/docker/clickhouse-setup to expose to mount the log file to otel-collector. The file is located here. Mount the path where the Nginx access logs are available ~/Work/logs/access.log:/tmp/access.log to docker volume.
otel-collector:
    image: signoz/signoz-otel-collector:0.88.11
    command: ["--config=/etc/otel-collector-config.yaml"]
    user: root # required for reading docker container logs
    volumes:
      - ./otel-collector-config.yaml:/etc/otel-collector-config.yaml
      - /var/lib/docker/containers:/var/lib/docker/containers:ro
      - ~/Work/logs/access.log:/tmp/access.log
Here we are mounting the log file of our application to the tmp directory of SigNoz otel-collector. You will have to replace <path>with the path where your log file is present.
Add the filelog reciever to otel-collector-config.yaml which is present inside deploy/docker/clickhouse-setup and include the path /tmp/access.log:
receivers:
  filelog:
    include: [  "/tmp/access.log" ]
    start_at: beginning
    operators:
    - type: json_parser
      timestamp:
        parse_from: attributes.time
        layout: '%Y-%m-%dT%H:%M:%S%z'
    - type: move
      id: parse_body
      from: attributes.message
      to: body
    - type: remove
      id: time
      field: attributes.time
Next we will modify our pipeline inside otel-collector-config.yaml to include the receiver we have created above.
service:
    ....
    logs:
        receivers: [otlp, filelog]
        processors: [batch]
        exporters: [clickhouselogsexporter]
Once the changes are made, we need to restart the OTel Collector container to apply new changes. Use the command docker compose restart.
Check if all the containers are running properly by using the command docker ps:
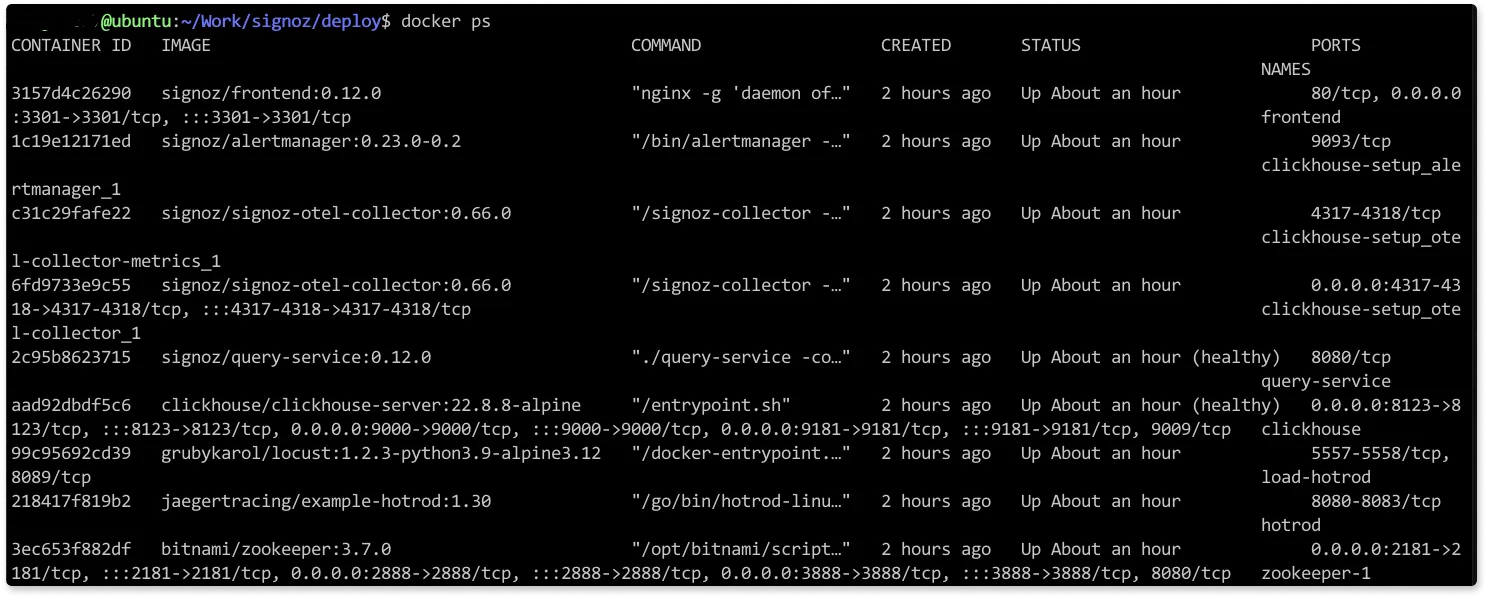
We can now go to the URL http://localhost and generate some Nginx logs into the access.log
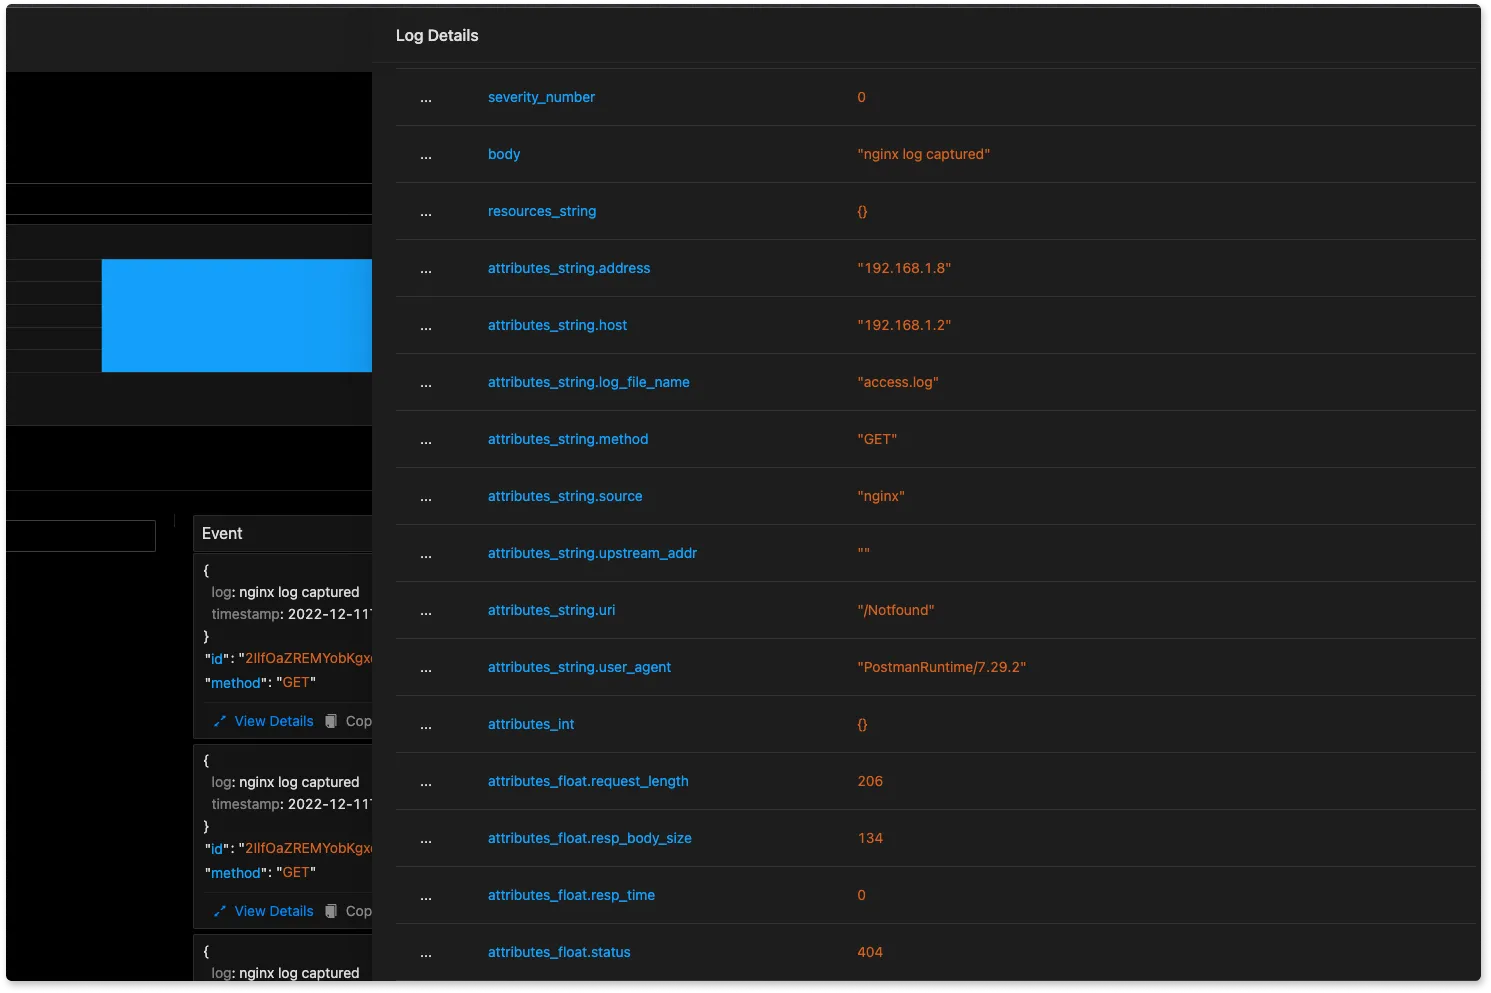
Go to the SigNoz URL, click on the Logs tab, and look for the word "nginx”. http://localhost:3301/
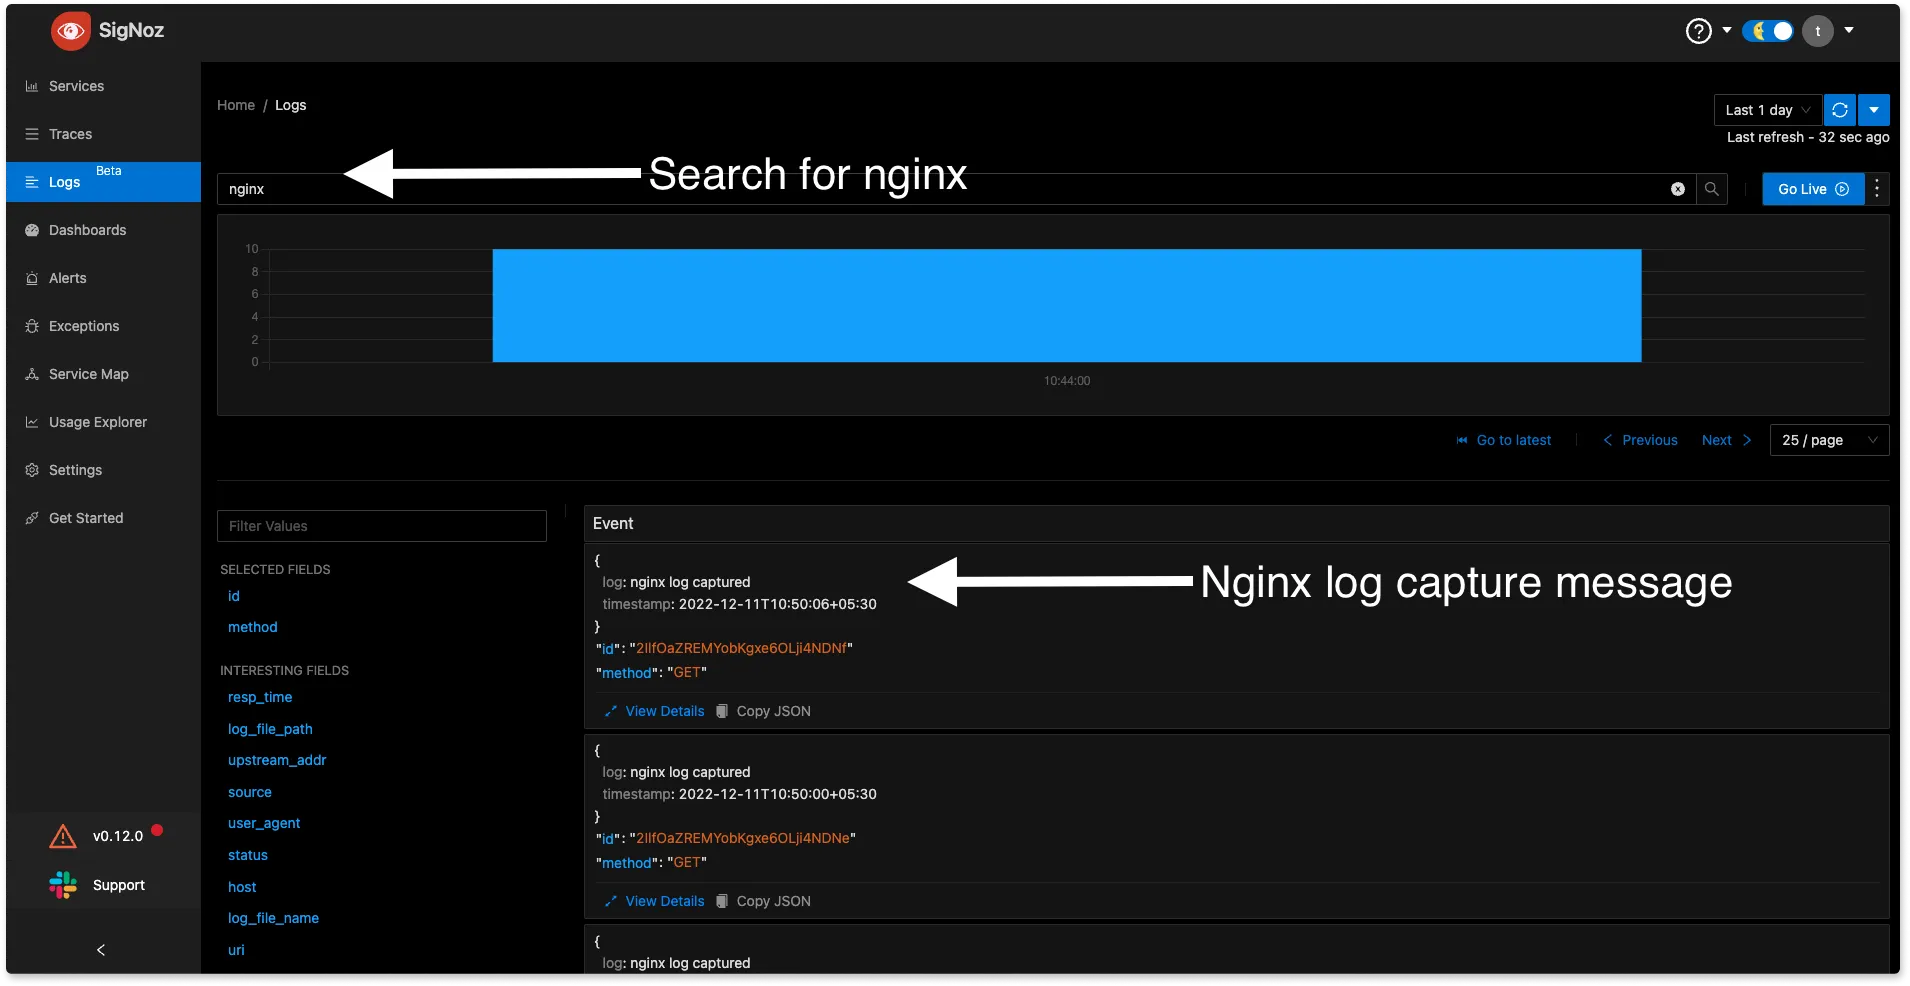
Click on the individual log to get a detailed view:
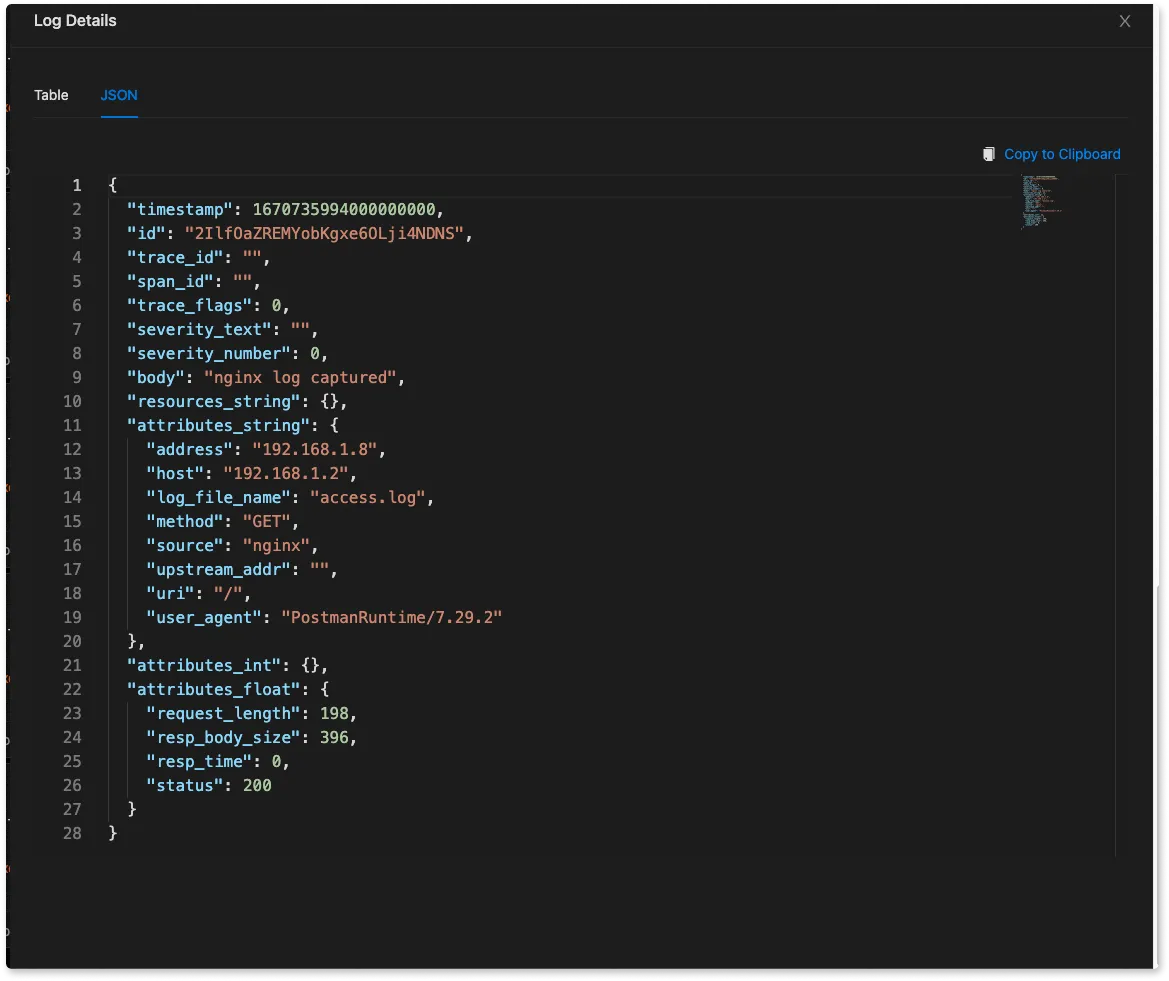
You can also view the logs in JSON format.
Conclusion
NGINX logs provides useful information to debug Nginx web servers. By using the error_log and access_log directives, you can track the performance and usage of your server and identify potential issues or errors.
The error_log directive can give you information about all errors, and you can use these logs to identify exactly what went wrong. The access_log directive gives you information about HTTP requests received by the Nginx server, and other client information like IP address, response status code, etc.
While debugging a single Nginx server by directly accessing Nginx logs can be done, it’s often not the case in production. Managing multiple Nginx servers and troubleshooting them effectively requires a centralized log management solution. In case of server downtime, you need to troubleshoot issues quickly, and effective dashboards around Nginx monitoring is needed.
With SigNoz logs, you can effectively manage your Nginx logging. You can check out its GitHub repo now.
Related Posts


