Top 11 New Relic Alternatives & Competitors [Updated for 2024]
Are you looking for a New Relic alternative? Then you have come to the right place. New Relic is a comprehensive observability tool. But it might be too complex for your use case, or you might have been bugged by its complex pricing policies like user seats-based pricing. We have made a list of top 11 New Relic alternatives that you might want to consider.
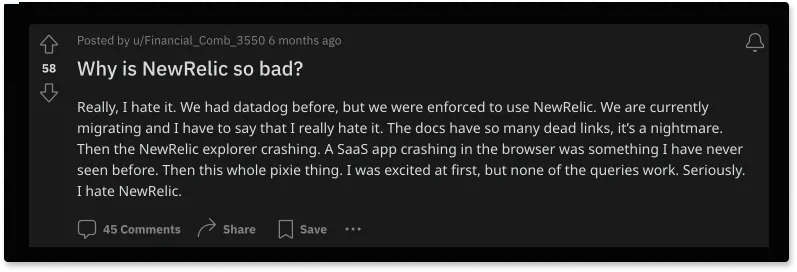
New Relic provides an array of tools for monitoring and observability. But it’s not meant for everyone. New Relic’s user pricing can go up to $549/user. Even for teams with 10-15 devs, the cost becomes significant. At scale, the cost of adding users can go up to 66% of the total bill. (Learn more)
As a legacy tool, users are also getting stuck with its documentation and tooling.
In this article, we'll explore the top 11 alternatives & competitors to New Relic.
Top 11 New Relic Alternatives & Competitors at a glance
| Tool | Best For | Standout Feature | Pricing |
|---|---|---|---|
| SigNoz | Most advanced OpenTelemetry-native APM that provides logs, metrics, and traces under a single pane of glass. | Correlation between signals, exceptions correlated with Traces, ClickHouse for storage, Logs ingestion pipeline to parse unstructured logs easily | Simple usage-based pricing. Can save up to 60% of your New Relic Bill. ["] |
| Grafana | Integration with various data sources, visualizing time-series data. | Highly customizable dashboards | Cloud Pro plan starts at $29 plus usage. $0.5 per GB for Logs and Traces and $8 per 1k metrics active series. Charges for user-seats. ["] |
| Appdynamics | Large IT teams who need a comprehensive platform that includes APM, network & security monitoring | Can build dashboards for key business transactions | Enterprise edition starts at $50 per month per CPU core. ["] |
| Dynatrace | Enterprise teams that need a wide array of tools for app and infra-observability | An AI agent called Davis AI that helps with data insights | Min. annual spend commitment + hourly pricing for various services. ["] |
| Datadog | Cloud monitoring that integrates APM, logs management, and infra monitoring. | Easy onboarding, lots of integrations. | SKU-based pricing. APM starts at $40 per host per month for 150 GB spans and then $0.1/GB. ["] |
| IBM Instana | Automatic service discovery to monitor all components of your tech stack. | A lightweight agent on each host discovers all components. | Starts at $75 per APM host with min. 12-month service term. For 100 hosts, it is $6450 per month in a 12-month contract. ["] |
| Appoptics | Cloud-based application performance monitoring (APM) and infrastructure monitoring solutions. | Identify outliers at a glance with transaction heatmaps. | Infrastructure + APM starts at $24.99 per host per month and is sold in packs of 10 hosts and 100 containers. ["] |
| Sematext | Managed ELK service, infrastructure monitoring, and tracing. | Real user monitoring with details about page loads, HTTP requests, etc. | Log monitoring starts at $50 per month for 1GB/day and a retention period of 7 days. ["] |
| Elastic APM | Log monitoring powered by Elasticsearch | Anomaly detection for your services and databases. | Offers several pricing tiers starting with $95 per month to $175 per month for 120GB storage/2 zones. ["] |
| Sentry | Best known for real-time error tracking, which helps to identify, diagnose, and fix crashes in applications. | Allows session replays of users before and after they encounter an issue. | The team plan starts at $29 per month + usage beyond 50k monthly errors. ["] |
| Honeycomb | Ability to handle high-dimensional data to provide insights for debugging applications. | BubbleUp feature to identify and investigate anomalies in system performance. | Pro plan starts at $130 per month with 100M events volume. ["] |
SigNoz (Open-Source)

SigNoz is a great New Relic alternative that is open-source and provides three signals in a single pane of glass. You can monitor logs, metrics, and traces and correlate signals for better insights into application performance.
One of the biggest benefits of using SigNoz over New Relic is adding as many team members as you like to improve collaboration. (Learn more.)
With SigNoz, you can do the following:
- Visualise Traces, Metrics, and Logs in a single pane of glass
- Monitor application metrics like p99 latency, error rates for your services, external API calls, and individual endpoints.
- Find the root cause of the problem by going to the exact traces which are causing the problem and see detailed flamegraphs of individual request traces.
- Run aggregates on trace data to get business-relevant metrics
- Filter and query logs, build dashboards and alerts based on attributes in logs
- Monitor infrastructure metrics such as CPU utilization or memory usage
- Record exceptions automatically in Python, Java, Ruby, and Javascript
- Easy to set alerts with DIY query builder
Who is SigNoz for?
SigNoz is a great fit for engineering teams looking for an open-source alternative to New Relic. SigNoz also offers cloud and enterprise plans. This makes it a great choice for teams that want the flexibility of having their dev and staging environment on open-source and their prod services monitored by SigNoz cloud.
SigNoz is also a great choice for engineering teams that want to shift their observability stack to OpenTelemetry. OpenTelemetry is quietly becoming the open-source standard for cloud-native application instrumentation for observability. It provides many benefits like no vendor lock-in, future-proof instrumentation, and covers a lot of use-cases.
SigNoz is built to support OpenTelemetry natively. OpenTelemetry is backed by Cloud Native Computing Foundation and is the second most active project after Kubernetes in the CNCF landscape. OpenTelemetry frees you from vendor lock-in and offers a host of other benefits.
SaaS vendors like New Relic and Datadog do not support OpenTelemetry data well. If you want to use OpenTelemetry, then SigNoz is a much better choice than New Relic.
Pricing
The pricing of SigNoz is usage-based. The cloud plan starts at $199 per month, which includes data usage. After that, logs and traces are charged at $0.3 per GB ingested and metrics at $0.1 per mn samples.
You can find more details on pricing here.
Grafana - Loki, Tempo, Mimir
What is Grafana?
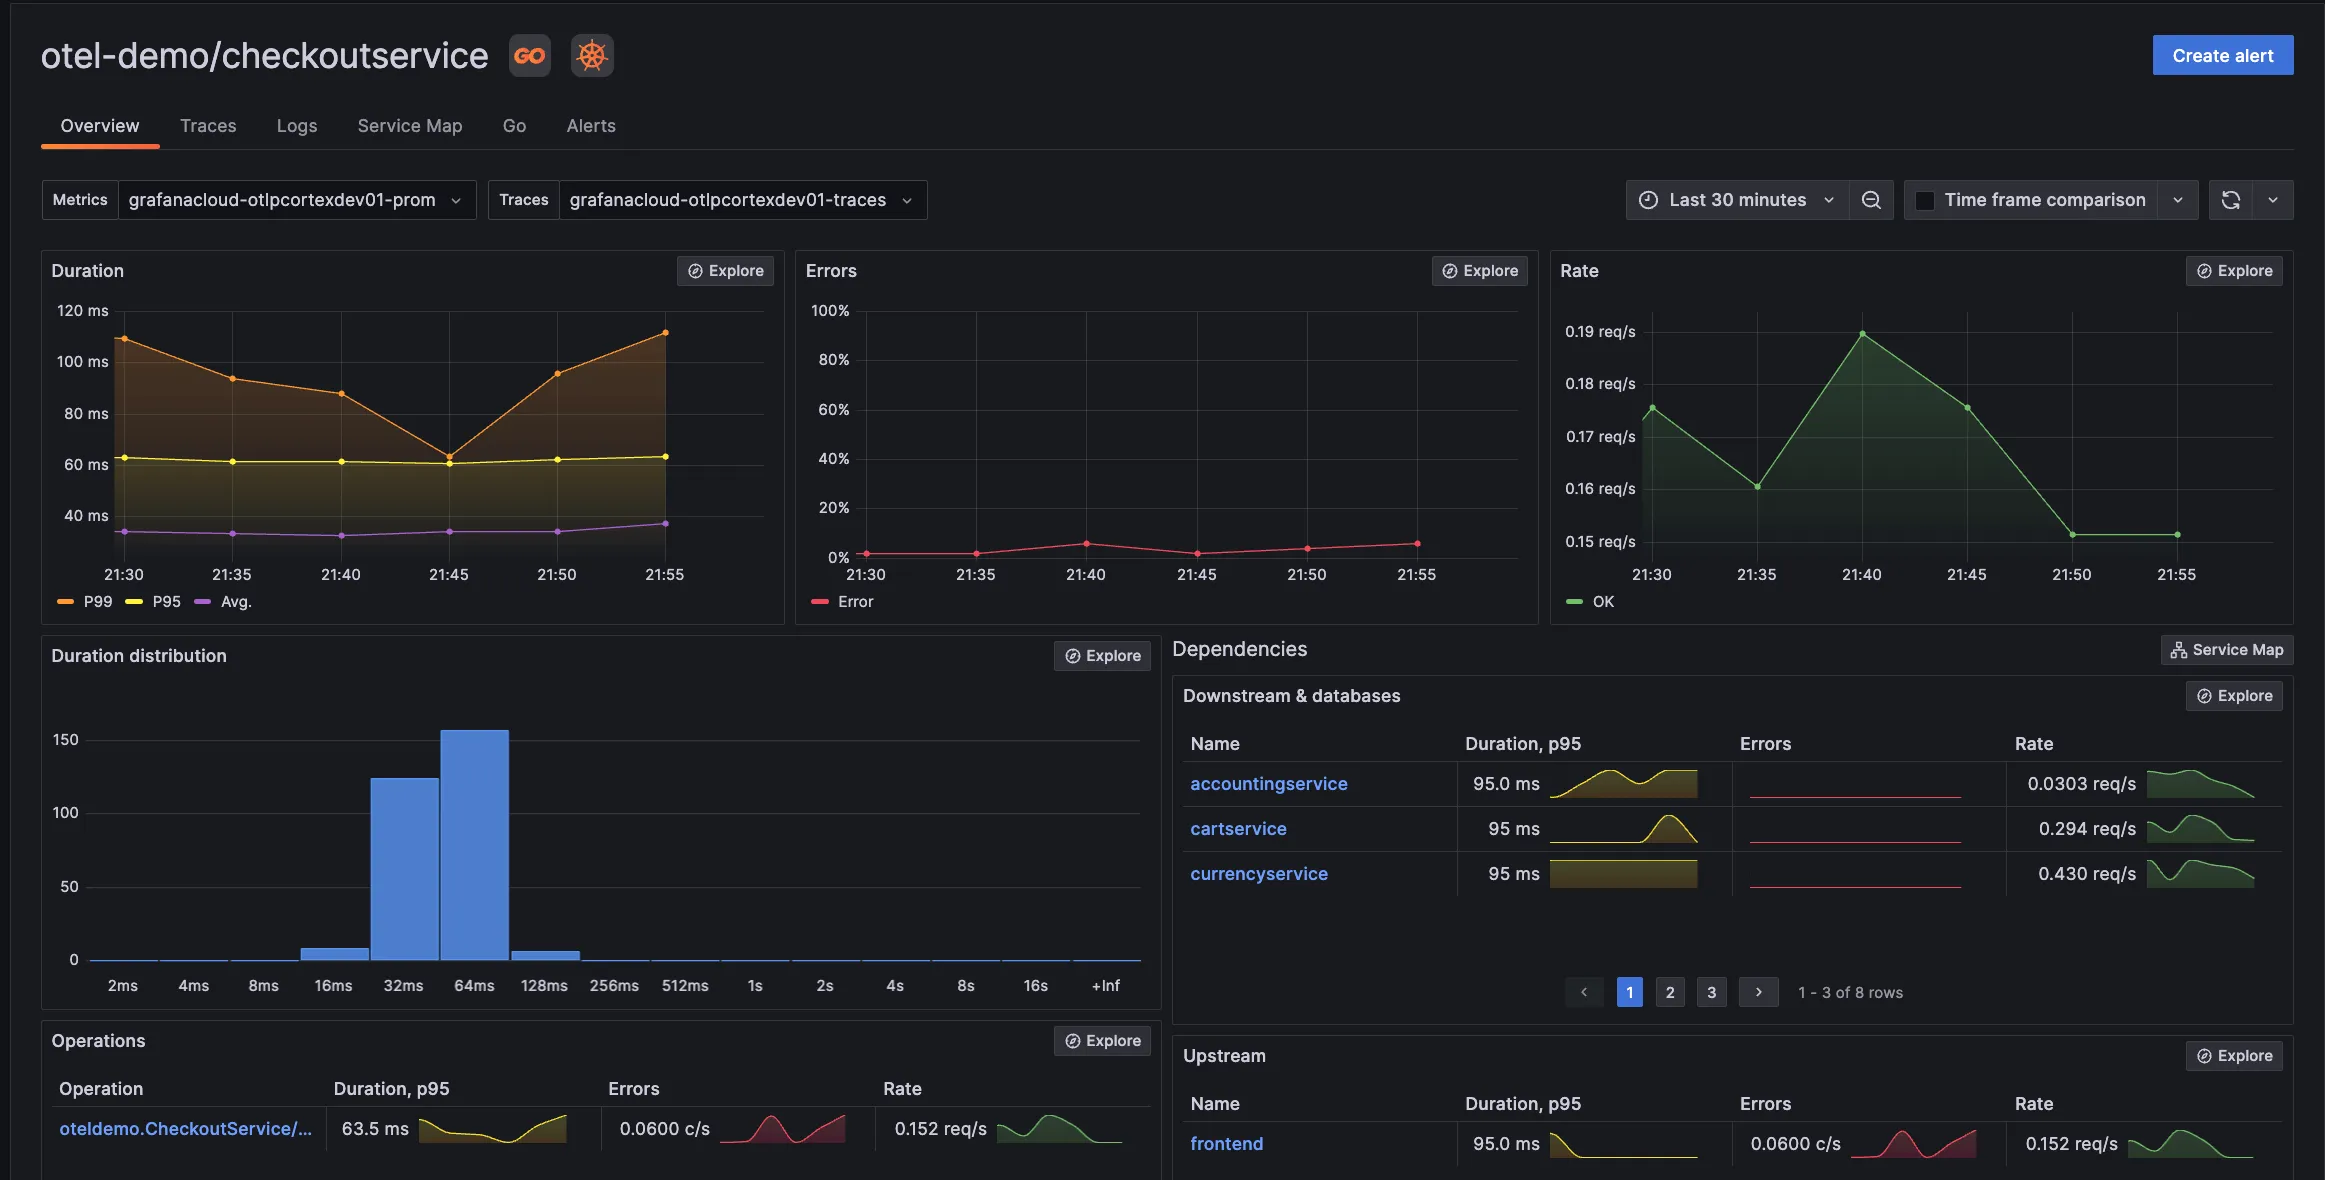
Grafana started as a data visualization tool whose primary strength lies in its integration with various data sources. It is primarily used for monitoring metrics and data visualization. For application observability, Grafana provides Loki, Mimir, and Tempo.
- Loki: A log aggregation system designed for storing and querying logs efficiently. Loki is closely integrated with Grafana, allowing users to query their logs directly from the Grafana dashboard.
- Mimir: An extension of Prometheus, Mimir provides scalable, long-term storage for metrics data, enhancing Grafana's metrics visualization and analysis capabilities.
- Tempo: A distributed tracing backend, Tempo works with Grafana to store and retrieve traces, aiding in the analysis of distributed systems performance.
Grafana is open-source, and you can self-host the above tools based on your needs. If you don’t want to self-host, you can use the paid services of Grafana cloud. In Grafana Cloud, Loki, Mimir, and Tempo work together to provide a comprehensive observability suite.
Who is Grafana for?
Grafana is suited for DevOps teams that need to monitor time-series data from multiple data sources. Grafana Cloud is also suited for teams that need logs, metrics, and traces under a single pane of glass. Companies choose Grafana for the following reasons:
- Data Visualization capabilities: Grafana offers a lot of different types of graphs, like Gauge charts, Pi charts, Bar charts, line charts, etc., with an interactive user interface that makes it easier to visualize different metrics,
- Infrastructure Monitoring: It offers rich visualizations from different data sources, which makes it easier for users to understand the health metrics of different infrastructure components.
- Open Source: Many companies choose Grafana because they prefer to self-host and control costs for their observability system.
Pricing
Grafana offers several pricing tiers for their cloud services:
- Cloud Free: A no-cost tier with limited usage, including 50GB each for logs, traces, and profiles, 10,000 series metrics, 500 virtual user hours for k6 testing, and up to 3 team members.
- Cloud Pro: Priced at $29/month plus usage costs. This includes higher limits like 100GB for logs, traces, and profiles, 20,000 series metrics, 1,000 virtual user hours, and support for 5 Grafana monthly active users.
- Cloud Advanced: At $299/month plus usage, it offers usage limits similar to Cloud Pro but with additional features like 24/7 support and access to all enterprise plugins.
More details on the Grafana pricing page.
AppDynamics
What is AppDynamics?
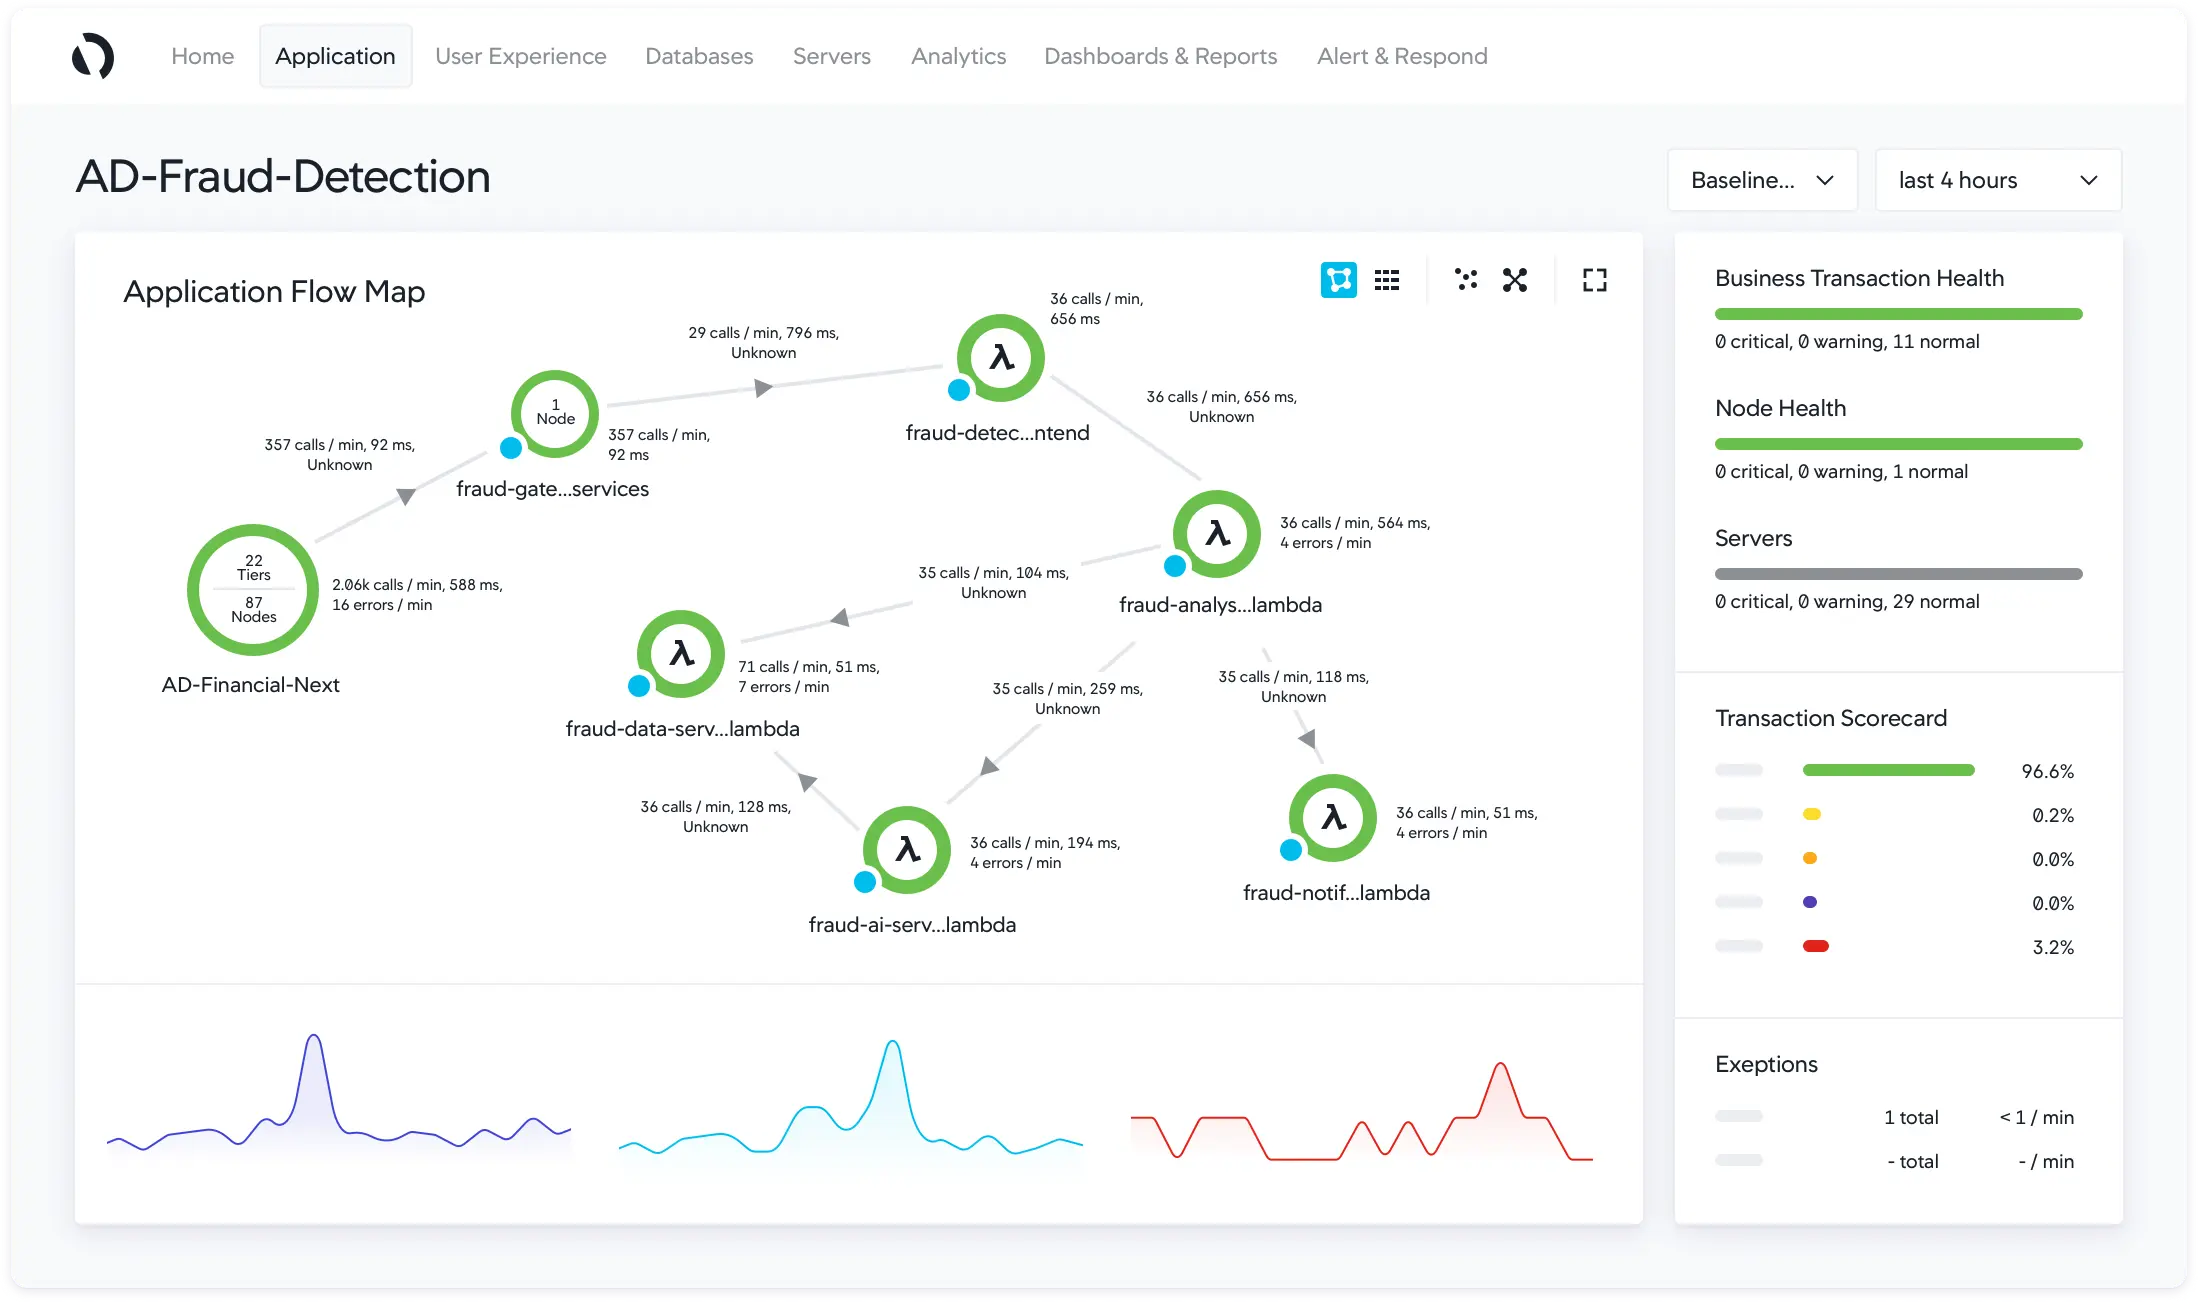
AppDynamics is an Application Performance Monitoring (APM) tool that provides real-time monitoring of applications, infrastructure, and end-user experiences. It was acquired by Cisco in 2017. It offers granular code-level visibility and alerting, enabling precise identification of performance bottlenecks.Some of the key features of the AppDynamics APM tool includes:
- Language support for Java, .NET, Node.js, PHP, Python, C/C++ and more
- Troubleshooting capabilities for issues slow response times, error rates, and transaction performance
- Automatic discovery of application topology
- Visibility into the underlying infrastructure
Who is Appdynamics for?
AppDynamics is an ideal Application Performance Monitoring (APM) tool for large enterprises with complex, multi-layered architectures, especially those aligning IT performance with business metrics.
Its AI-powered automated root cause analysis and customizable dashboards make it a perfect fit for organizations in cloud-native or hybrid environments, as well as for DevOps and Agile teams. Offering comprehensive insights into application performance and user experience, AppDynamics is tailored for companies seeking a robust, adaptable APM solution to optimize both technical and business outcomes.
Pricing
Here's a summarized table to understand AppDynamics' pricing structure for the US region(at the time of writing this article):
| Edition | Pricing (per CPU Core per month) | Additional Notes |
|---|---|---|
| Infrastructure Monitoring | $6 | - |
| Premium | $33 | - |
| Enterprise | $50 | - |
| Enterprise for SAP | $95 | Specialized SAP Solutions |
| Real User Monitoring | $0.06 per 1,000 tokens | - |
| Cisco Secure Application | $13.75 | - |
More details on the Appdynamics pricing page.
Dynatrace
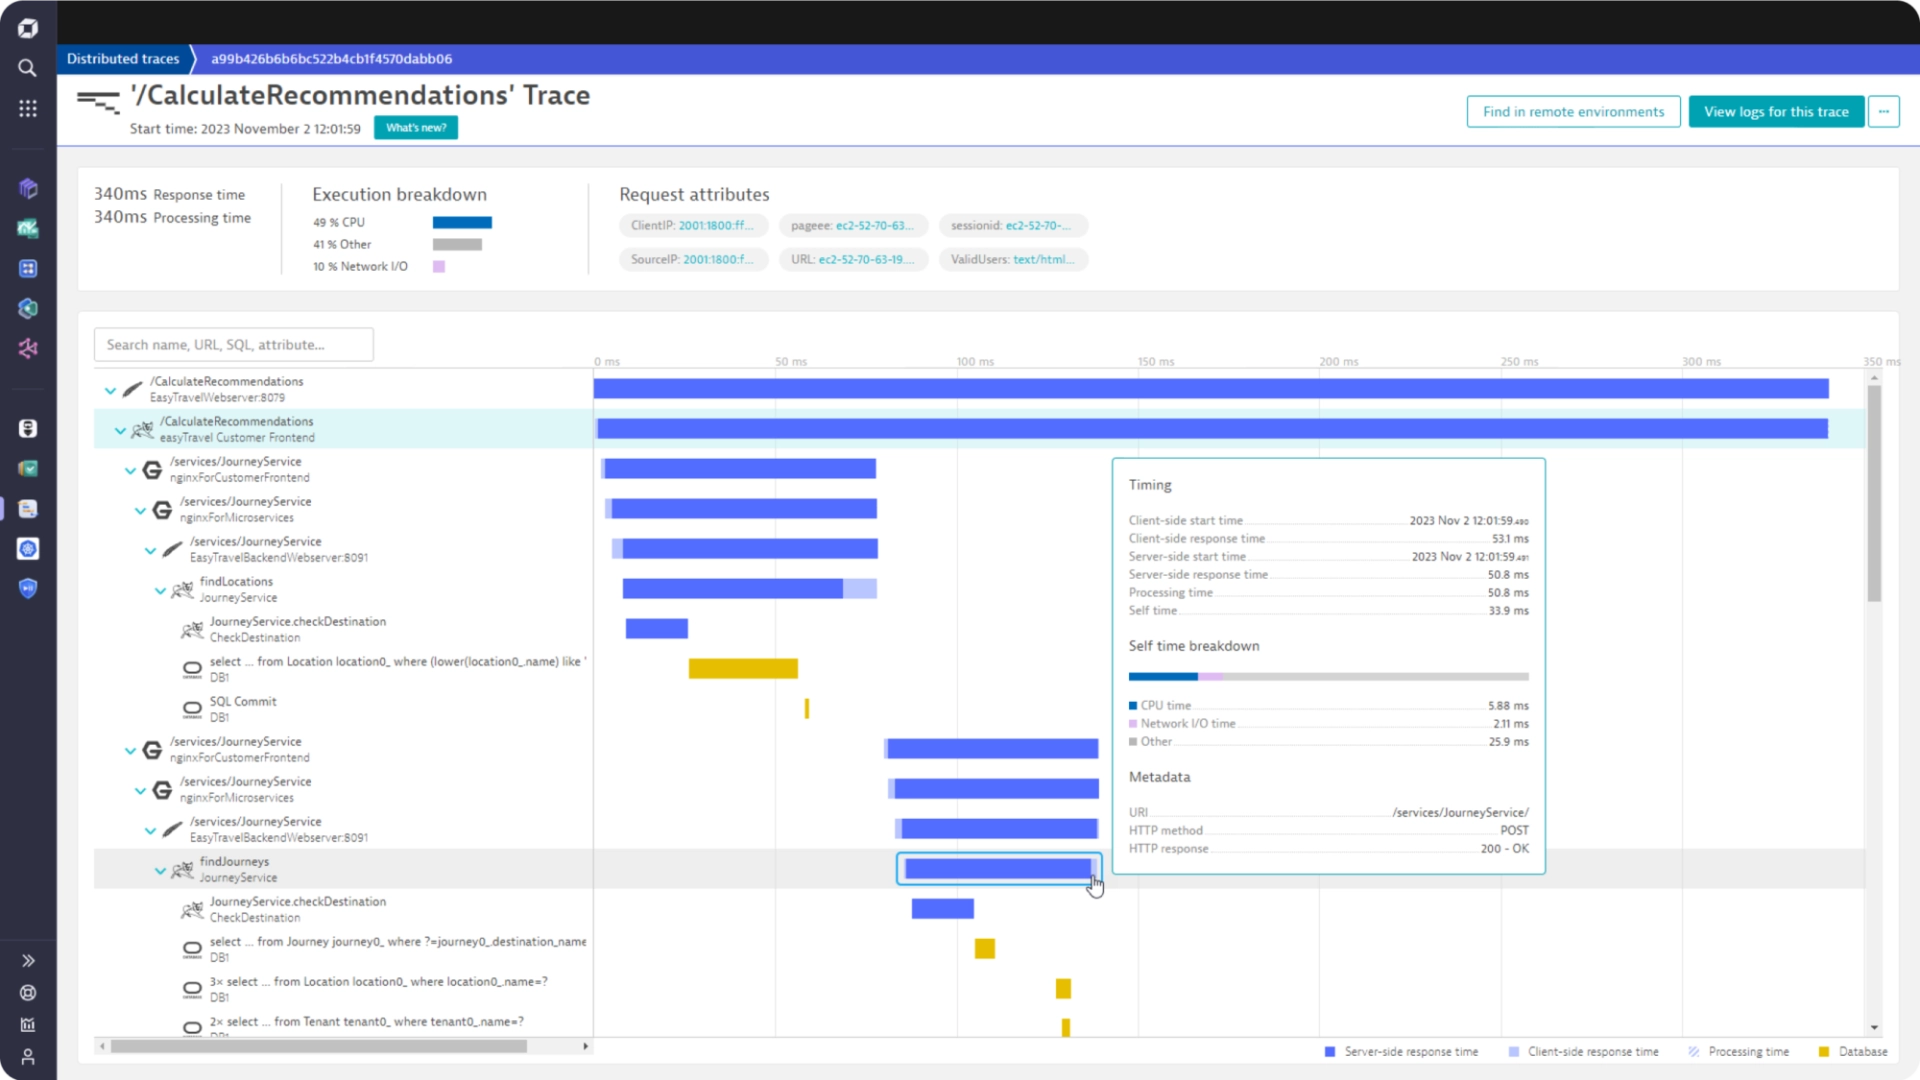
What is Dynatrace?
Dynatrace is a robust monitoring solution designed for large-scale enterprises that provide comprehensive observability for applications, ensuring optimal performance through real-time insights and AI-driven analytics.It also offers monitoring capabilities for both on-premises and cloud environments, enabling organizations to gain valuable insights into the performance and health of their applications, services, and infrastructure. This flexibility is particularly beneficial for businesses with hybrid or multi-cloud setups, as it ensures they can maintain comprehensive visibility and control across their entire IT landscape.
With Dynatrace, you can:
- Analyze the performance of every user request in your application
- Monitor server-side services
- Monitor network activity
- Oversee cloud and virtual machine performance
- Monitor containerized environments like Docker, Kubernetes
- Conduct in-depth root-cause analysis
Who is Dynatrace for?
Dynatrace is best suited for large organizations. It can be quite complex and expensive for smaller organizations. Based on the user reviews from G2, here are some key takeaways about Dynatrace:
- Highly Valued for APM: Effective in delivering live alerts, synthetic monitoring, and advanced data analysis.
- AI-Powered Insights: The Davis AI Engine is appreciated for reducing monitoring workload and providing intelligent insights.
- Complex for New Users: Its extensive feature set can be overwhelming for novices.
- Effective Root Cause Analysis: Users find it extremely helpful in identifying and resolving issues quickly.
- Cost Considerations: While beneficial, some users find the pricing relatively high.
- Intuitive UI: The user interface is generally user-friendly, though some find it could be improved.
- Versatile for Debugging: Useful for debugging in both development and production environments, with some limitations in data handling and conditional breakpoints.
- Suited for Large, Complex Environments: Particularly beneficial for large and complex IT infrastructures needing comprehensive monitoring and real-time analysis.
These takeaways suggest that Dynatrace is particularly suited for larger organizations and technical teams requiring in-depth, AI-driven application performance analysis and real-time troubleshooting.
Pricing
Dynatrace's pricing is based on an hourly rate, offering various services:
- Full-Stack Monitoring: $0.08 per hour for 8 GB host, covering APM, Application Observability, AIOps, and Infrastructure Monitoring.
- Infrastructure Monitoring: $0.04 per hour for any size host, focusing on cloud platforms, containers, networks, and data center technologies.
- Application Security: $0.018 per hour for 8 GiB host, providing real-time vulnerability analysis and threat protection.
- Real User Monitoring: $0.00225 per session, for monitoring mobile, hybrid, and single-page applications.
- Synthetic Monitoring: $0.001 per synthetic request, for HTTP monitors and 3rd party API ingestion.
- Log Management & Analytics: $0.20 per GiB (Ingest & Process), $0.0007 per GiB per day (Retain), $0.0035 per GiB (Query).
More details on Dynatrace pricing page.
Datadog
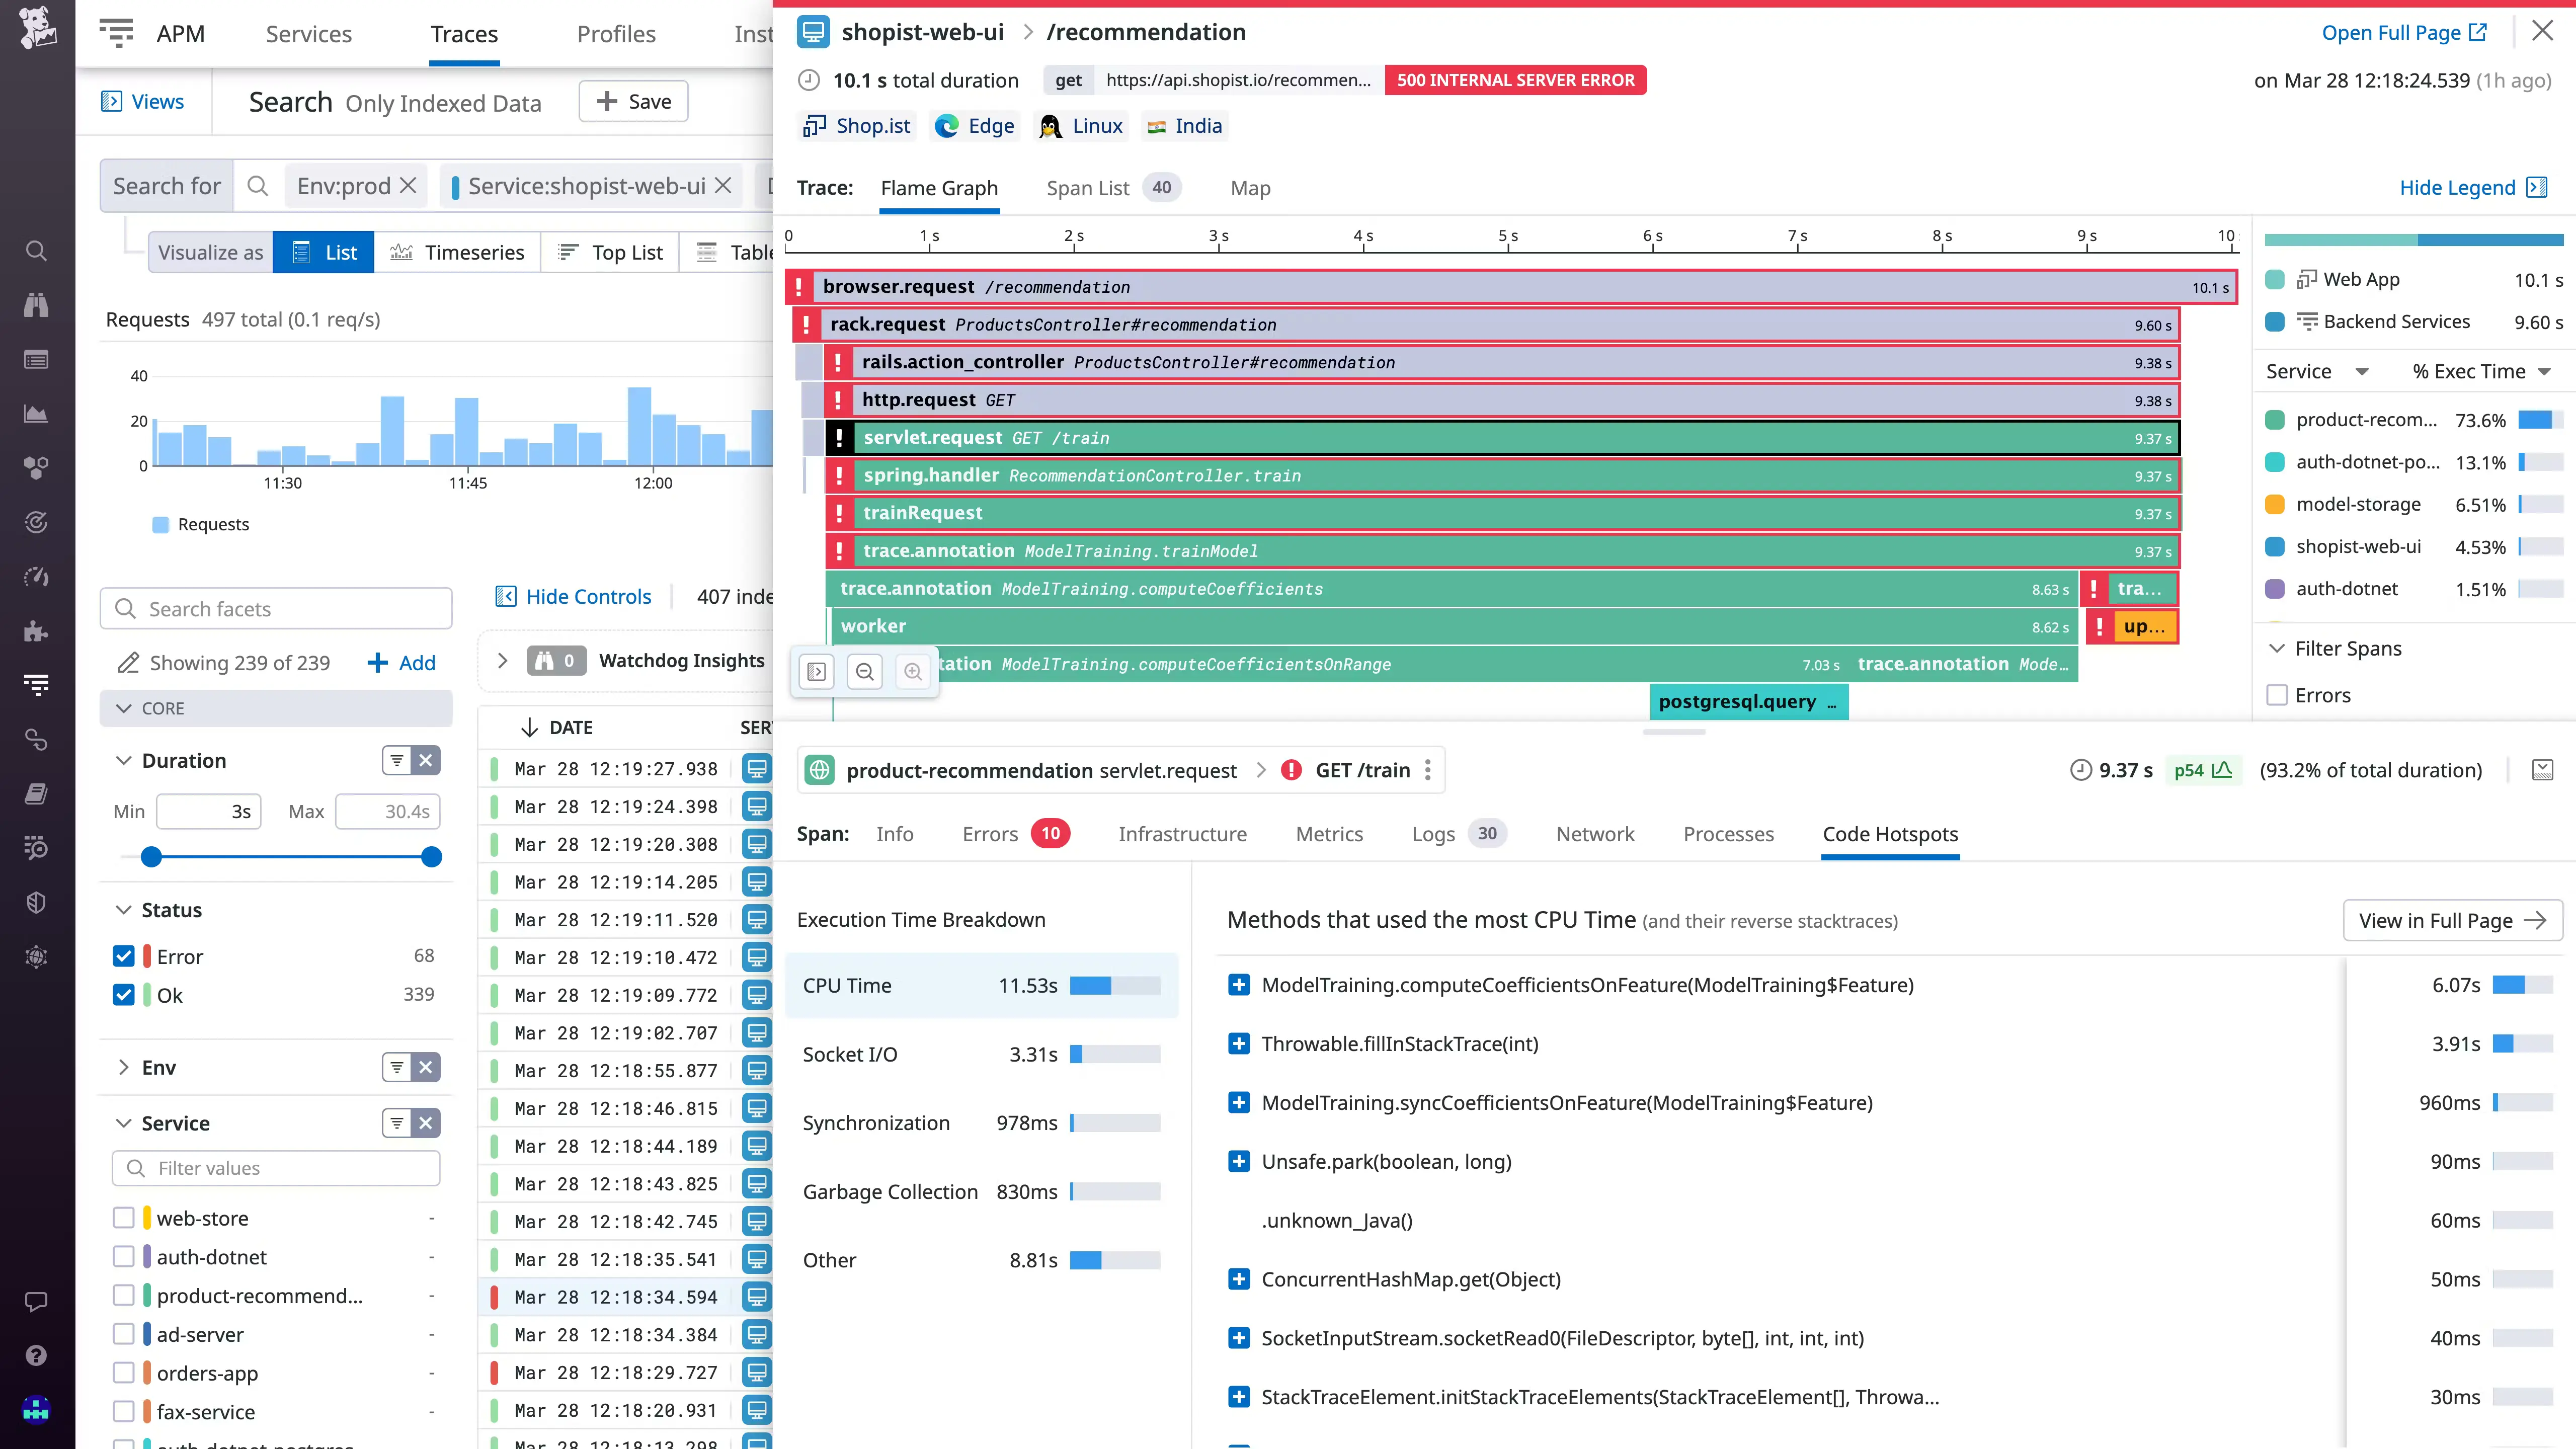
What is Datadog?
Datadog is a comprehensive monitoring and observability platform, that gives insights into the performance of IT infrastructure, applications, and services, utilizing metrics, traces, and logs for in-depth insights and proactive issue resolution.It offers a wide range of capabilities encompassing infrastructure monitoring, log management, application performance monitoring, and security monitoring. It achieves comprehensive visibility into applications by enabling:
- Tracing requests from start to finish across distributed systems
- Instrumenting with open-source libraries
- Enabling smooth navigation between logs, metrics, and traces.
Who is Datadog for?
Datadog is a great product for end-to-end application observability. But if you’re moving out of New Relic due to price, then Datadog is not an option as it can be more expensive.
Based on the G2 reviews, Datadog is best suited for:
- Large enterprises and DevOps/SRE teams requiring comprehensive monitoring across diverse platforms, particularly beneficial for cloud and Kubernetes environments.
- Organizations seeking real-time alerting and detailed insights into infrastructure and application performance.
- Teams needing robust log management and analysis, with an emphasis on debugging production environments.
- Users valuing a user-friendly interface, although some may find certain aspects complex.
- Businesses where integration with tools like Slack and Pager Duty for operational efficiency is crucial.
It's particularly effective for environments requiring centralized monitoring and real-time analytics, though the cost factor and the need for technical proficiency in setup and utilization are considerations.
Pricing
Datadog’s pricing is complex and SKU-based. It varies by service:
- Infrastructure Monitoring: Free for up to 5 hosts. Pro at $15/host/month and Enterprise at $23/host/month for additional features.
- Log Management: $0.10 per ingested GB/month. Retention plans vary from 7 days to 15 months.
- APM & Continuous Profiler: APM Pro starts at $35 per host per month
- Synthetic Monitoring: Starts at $5/month for 10,000 test runs.
- Real User Monitoring: From $15/month for 10,000 sessions.
- Security Monitoring: $0.20 per ingested GB/month.
More details on Datadog’s pricing page.
Instana
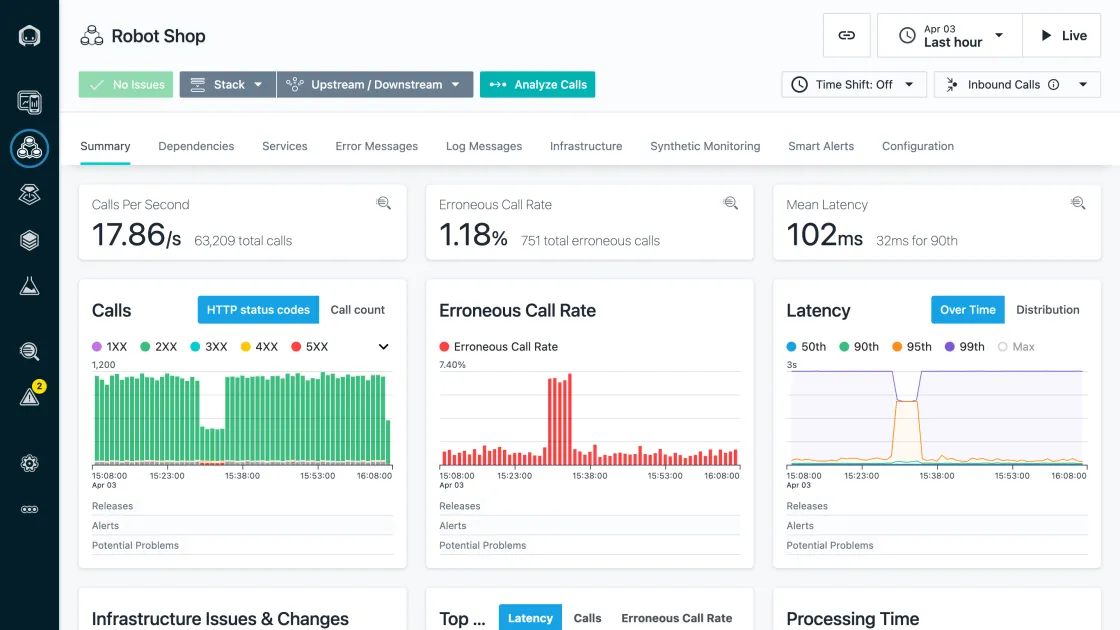
What is IBM Instana?
IBM Instana is an Application Performance Monitoring (APM) solution designed for managing the performance of modern cloud-native applications. It provides real-time observability and automatic application discovery, enabling teams to detect and resolve issues rapidly.
Its key features include:
- Automatic Application Discovery: Instana automatically detects and maps all services, their dependencies, and configuration changes in real-time.
- Smart alerts and remediation: It provides automatic identification of likely root cause of incidents to improve mean time to resolution.
- Rich Integrations: Instana supports more than 300 integrations to get you started quickly.
Who is IBM Instana for?
IBM Instana is particularly well-suited for:
- Enterprises with complex, distributed, and cloud-native applications.
- Organizations employing microservices and container-based architectures.
- DevOps teams needing real-time, automated application performance monitoring.
- Businesses seeking AI-powered insights for proactive issue resolution and performance optimization.
Its capabilities are especially beneficial in dynamic environments where rapid detection and resolution of performance issues are crucial.
Pricing
IBM Instana pricing starts at $75 per APM host with a minimum of 12-month service term. For 100 hosts, it is $6450 per month in a 12-month contract. More details on IBM Instana pricing page.
Appoptics [Solarwinds]
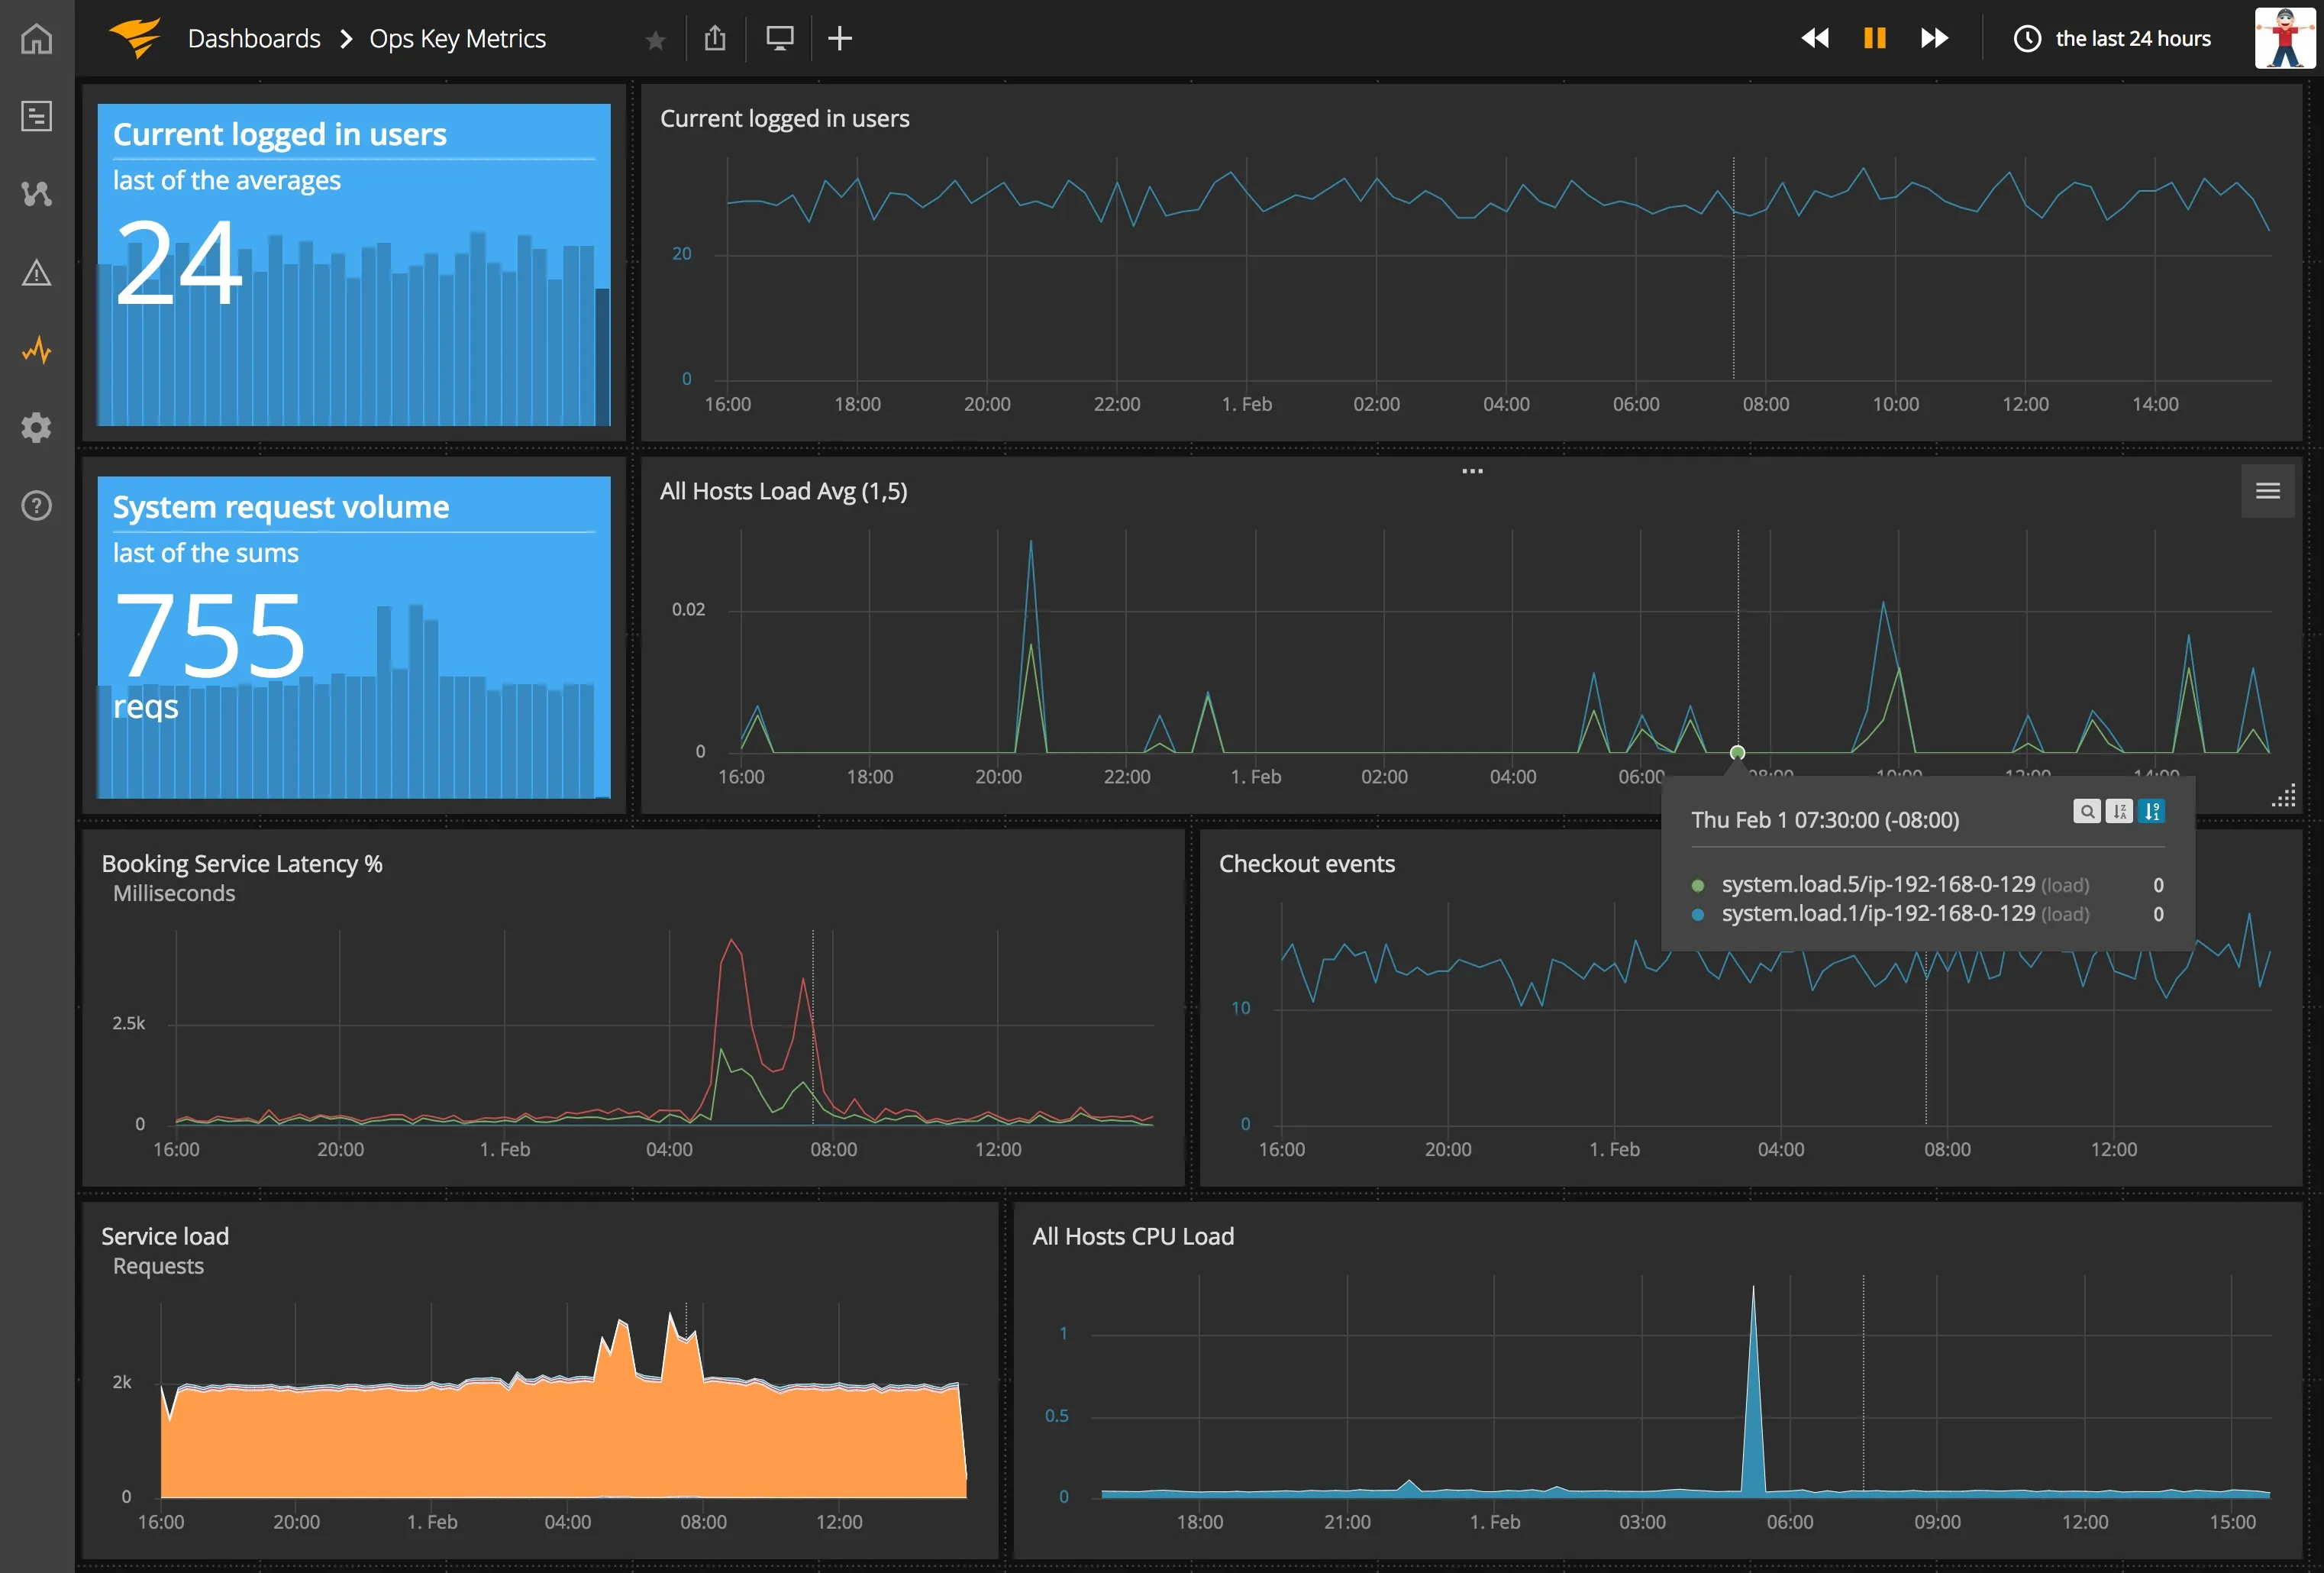
What is Appoptics?
AppOptics is a cloud-based APM tool by SolarWinds that provides comprehensive monitoring for both infrastructure and applications. It offers features like customizable dashboards, distributed tracing, alerting, and integration with other tools. This helps in efficiently managing and optimizing the performance of applications and infrastructure components.Some of the key features of the AppOptics APM tool include:
- Support for various programming languages such as .Net, Go, Java, Node.js, PHP, Python, and Ruby.
- Visualization of application service topology maps.
- Ability to pinpoint the underlying cause of performance challenges.
- Offers distributed tracing, monitors hosts and IT infrastructure, and integrates seamlessly with various systems.
Who is Appoptics for?
AppOptics is best suited for:
- Small to medium-sized businesses looking for cost-effective, full-stack monitoring solutions.
- IT teams requiring integrated infrastructure and application performance monitoring.
- Organizations with hybrid cloud environments needing real-time analytics and troubleshooting.
- DevOps teams seeking efficient monitoring with detailed tracing and exception tracking.
It's ideal for those who need a unified view of their technology stack without a significant investment in complex APM tools.
Pricing
AppOptics by SolarWinds offers two main pricing tiers:
- Infrastructure Monitoring: Priced at $9.99 per host per month, focusing on modern hybrid infrastructure monitoring. It's sold in packs of 10 hosts or 100 containers.
- Infrastructure & Application Monitoring: Costs $24.99 per host per month, offering full-stack application performance monitoring with features like distributed tracing, live code profiling, and exception tracking. This package is also sold in packs of 10 hosts or 100 containers.
For more detailed pricing information, you can visit SolarWinds AppOptics Pricing.
Sematext
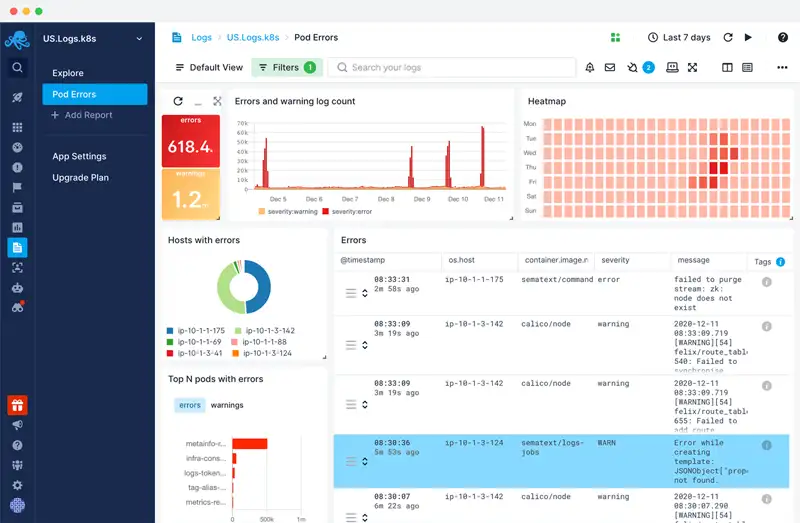
What is Sematext?
Sematext is an all-in-one monitoring and logging service that delivers critical insights into the performance of applications and infrastructure. It can be used as a New Relic alternative, but it focuses more on log monitoring.
Some of the key features of Sematext include:
- Log Management: Advanced tools for collecting, storing, analyzing, and visualizing log data, crucial for troubleshooting and understanding system behavior.
- Infrastructure Monitoring: Detailed monitoring of infrastructure components like servers, containers, and databases.
- Real-Time Monitoring: Offers real-time insights into application and server performance.
- Kubernetes Monitoring: Specialized features for monitoring Kubernetes clusters and containers.
- User Experience Monitoring: Client-side performance tracking to understand the end-user experience.
Who is Sematext for?
According to G2 reviews, Sematext is well-suited for the below use cases:
- Orgs with Diverse Infrastructure Monitoring Needs: Sematext caters well to organizations with varied infrastructure requirements, including those using Kubernetes, containers, and cloud-based systems, by offering comprehensive insights and monitoring capabilities.
- API-Intensive Environments: Sematext is well-suited for environments heavily reliant on APIs, offering reliable monitoring and alerting for API performance, which is crucial for Lambda-based applications and REST APIs.
- Good for Log Management: Sematext’s product is primarily focused on log management, and it provides hosted ELK as a service. So, it makes a good choice for users who are familiar with the ELK ecosystem.
Pricing
Sematext offers several pricing plans for its services:
- Logs Management:
- Starts at $50 per month (or $40.50 per month when billed annually).
- Basic Plan: Free, with 7 days retention and 500 MB/day log volume.
- Infrastructure Monitoring:
- Starts at $3.6 per host per month (or $3.24 per host per month when billed annually).
- Experience (Real User Monitoring):
- Starts at $9 per month (or $8.1 per month when billed annually).
- Synthetics (Website & API Monitoring):
- Starts at $2 per monitor per month.
All plans come with a 14-day free trial. More details on the Sematext Pricing Page.
Elastic APM
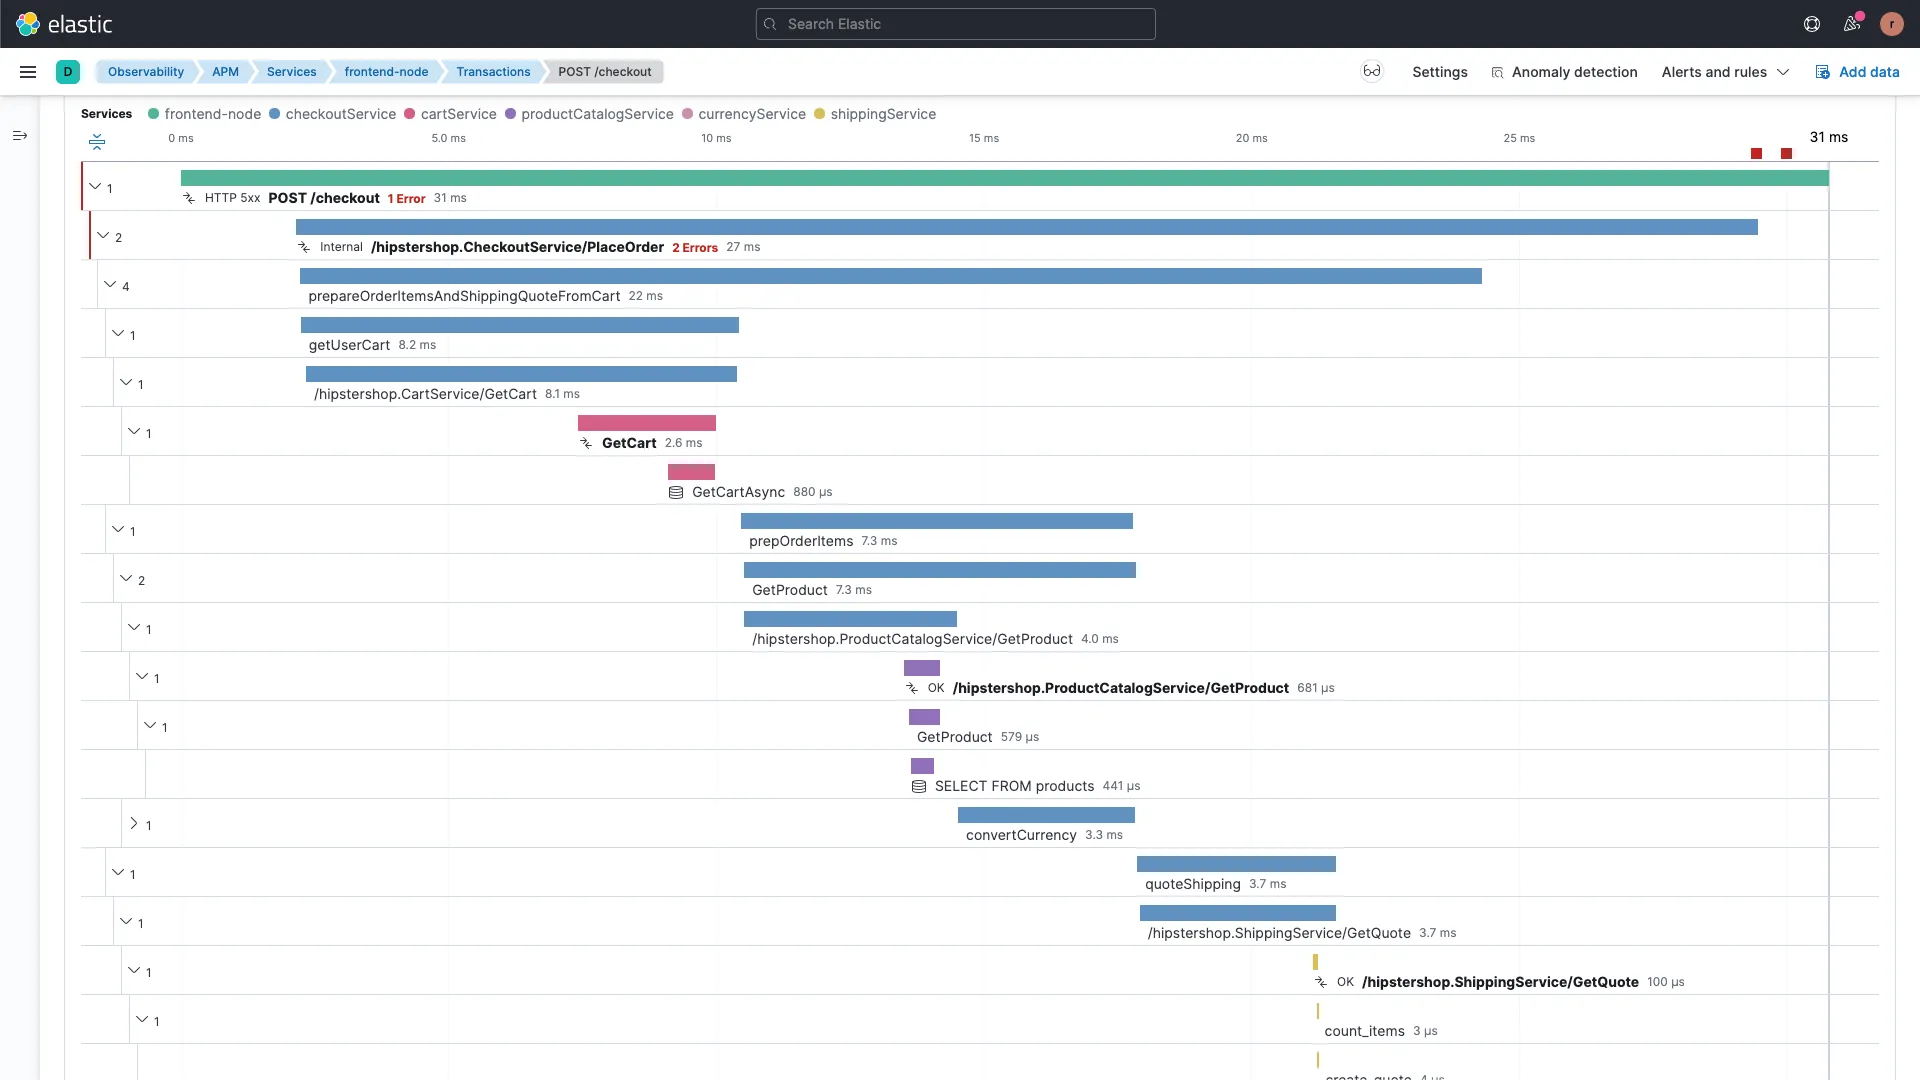
What is Elastic APM?
Elastic APM is part of the Elastic Observability solution, which also includes infrastructure and log monitoring, enhancing overall application and system observability. The easiest way to use Elastic APM is by subscribing to the hosted Elasticsearch service on Elastic Cloud. You can also opt to self-manage the Elastic stack, where you need to decide how to run and configure the APM server.
Some of the key features of Elastic APM include:
- End-to-End Distributed Tracing: Provides comprehensive tracing of transactions across various services.
- Real User Monitoring: Captures and analyzes user interactions with front-end applications.
- Error Tracking: Identifies and helps in analyzing application errors effectively.
- Anomaly Detection with Machine Learning: Uses advanced machine learning algorithms for detecting anomalies in application performance.
- CI/CD Pipeline Visibility: Offers insights into the impact of code changes on application performance.
Who is Elastic APM for?
Elastic APM is suited for users who are already using Elasticsearch self-hosted or managed services. Elasticsearch is majorly used for log management because of its search capabilities. So, if you’re already using Elasticsearch for logs, you can extend the capabilities of your monitoring stack by using Elastic APM, too.
Compared to New Relic, Elastic APM can be preferred for its open-source foundation and flexibility. New Relic, on the other hand, offers a more comprehensive APM solution and is known for its user-friendly interface, detailed reporting, and extensive integrations.
Pricing
Elastic APM is part of the Elastic Cloud offerings. Pricing for Elastic Cloud starts at $95 per month for the Standard plan, $109 per month for the Gold plan, $125 per month for the Platinum plan, and $175 per month for the Enterprise plan.
Each tier offers progressively more features and capabilities. The Standard plan includes core Elastic Stack features, while higher tiers add advanced security, machine learning, and support options. Specific pricing may vary based on configuration and usage.
More details on the Elastic pricing page.
Honeycomb
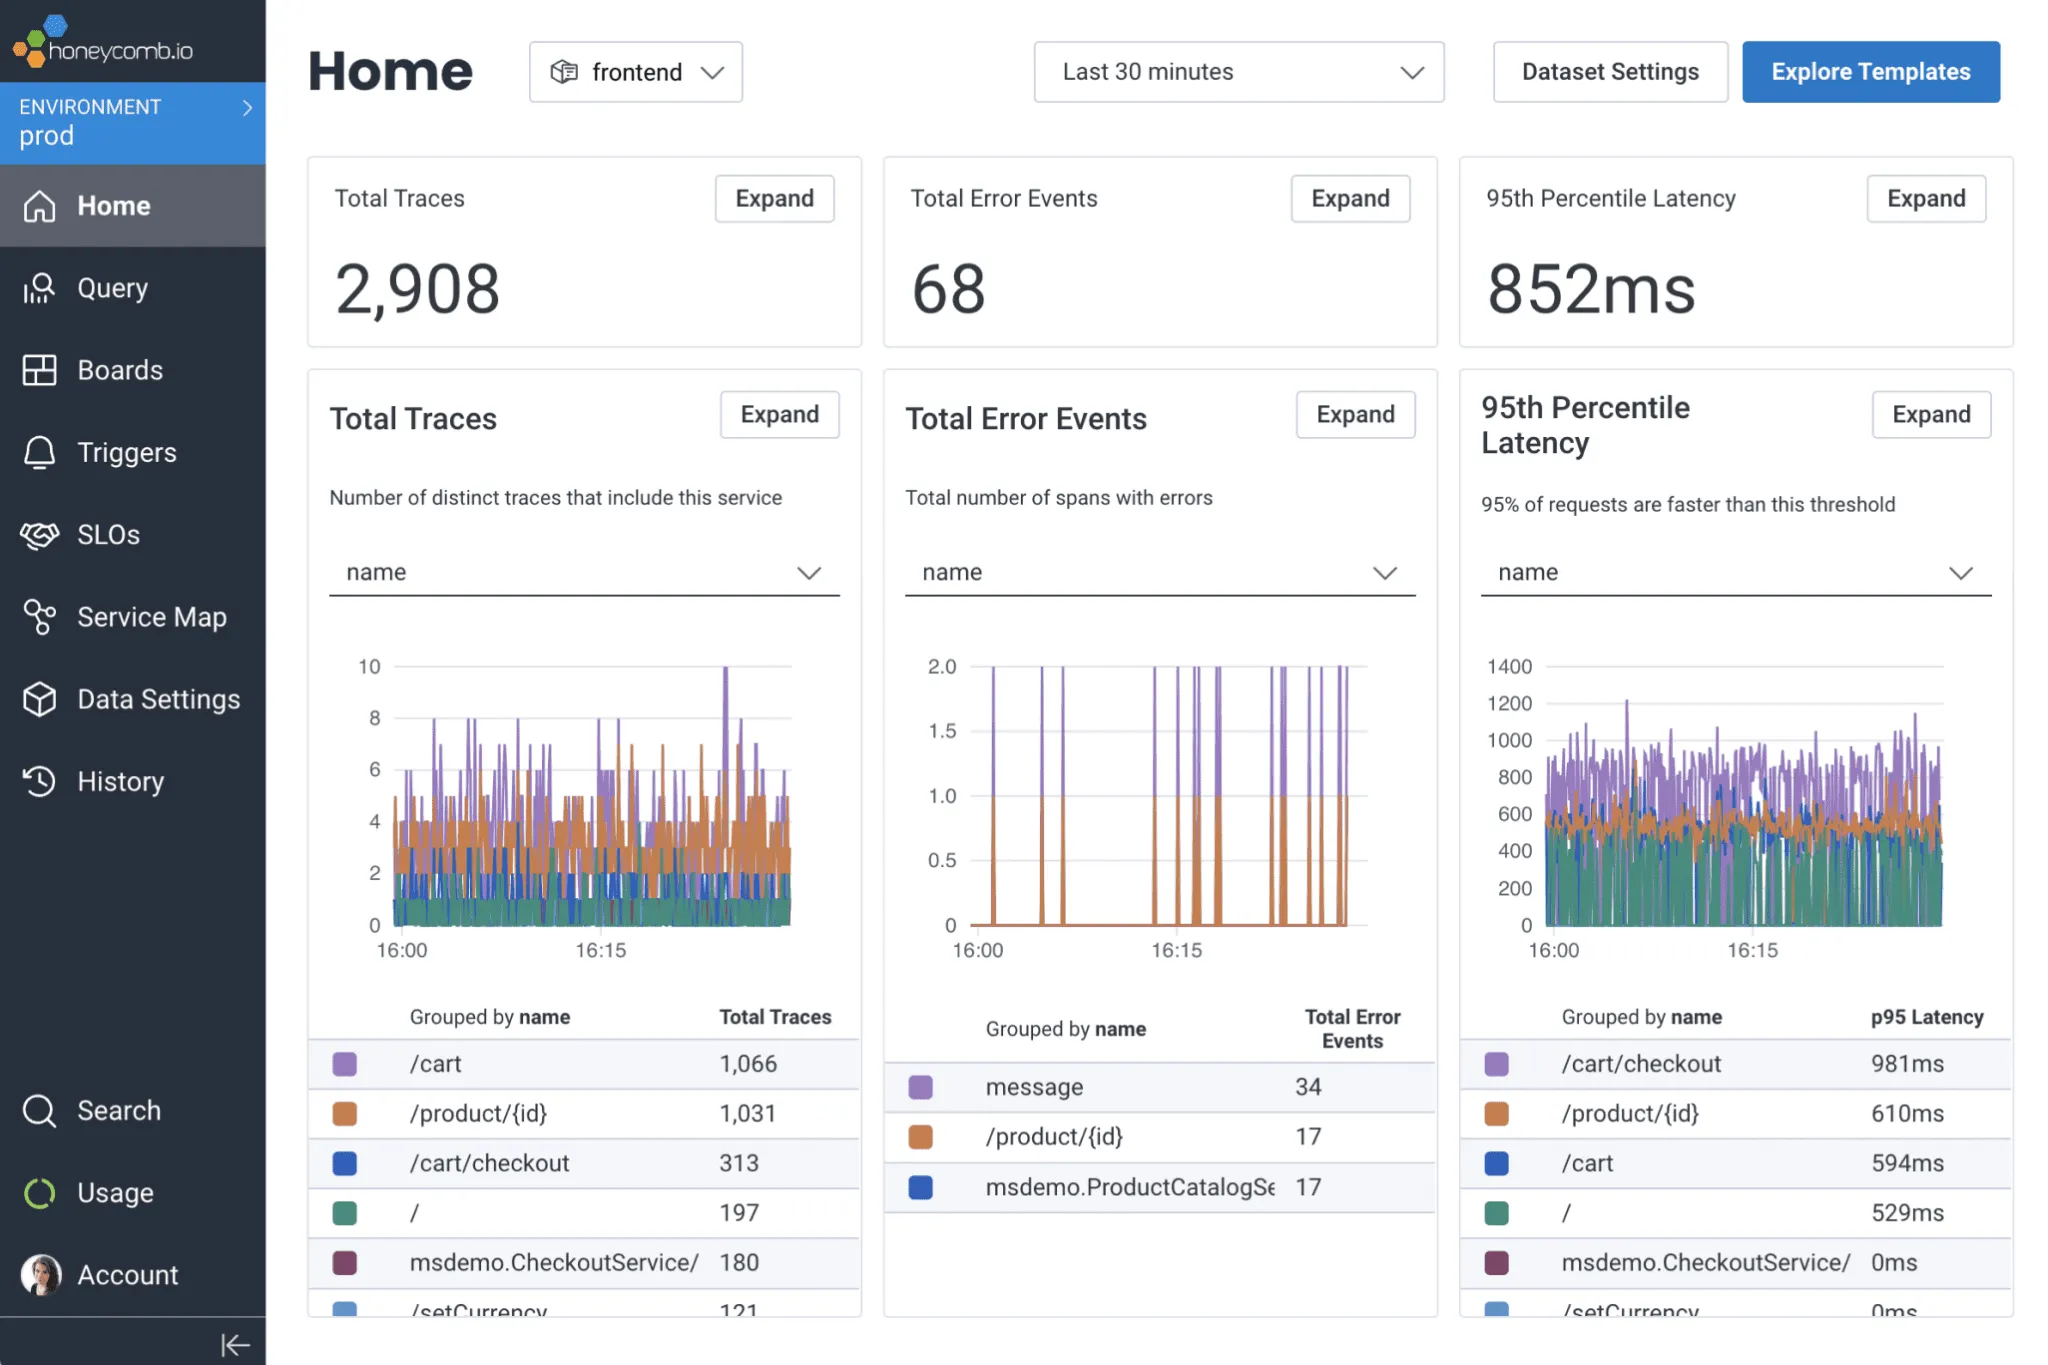
What is Honeycomb?
Honeycomb is an observability tool designed for modern engineering teams with a focus on allowing custom attributes for a better debugging experience. It offers logs, metrics, and traces under a unified view. It consolidates debugging use cases using these three signals in a single workflow.
When compared to New Relic, Honeycomb excels in handling high-dimensional data and complex, distributed systems. New Relic, on the other hand, offers a broader range of monitoring capabilities, including application performance, infrastructure, and real user monitoring.
Who is Honeycomb for?
Honeycomb is designed for modern software engineers, DevOps teams, and SREs (Site Reliability Engineers) who manage complex, distributed systems. It's especially useful for teams that need to quickly diagnose and address performance issues in production environments.
Honeycomb's ability to analyze high-dimensional data makes it well-suited for organizations adopting microservices architectures or those needing detailed insights into how their applications behave under various conditions.
Pricing
Honeycomb offers three pricing tiers:
- Free Plan: $0 per month, includes 20 million events per month, 2 triggers, distributed tracing, OpenTelemetry support, and more.
- Pro Plan: Starting at $130 per month, includes all Free Plan features plus 100 triggers, 2 SLOs, Single-Sign On (SSO), and event volumes of 100M, 450M, or 1.5B per month.
- Enterprise Plan: Custom pricing, includes all Pro Plan features plus 300 triggers, 100 SLOs, Service Map, enhanced support options, and scalable event volume to fit business size.
More details on the Honeycomb pricing page.
Sentry
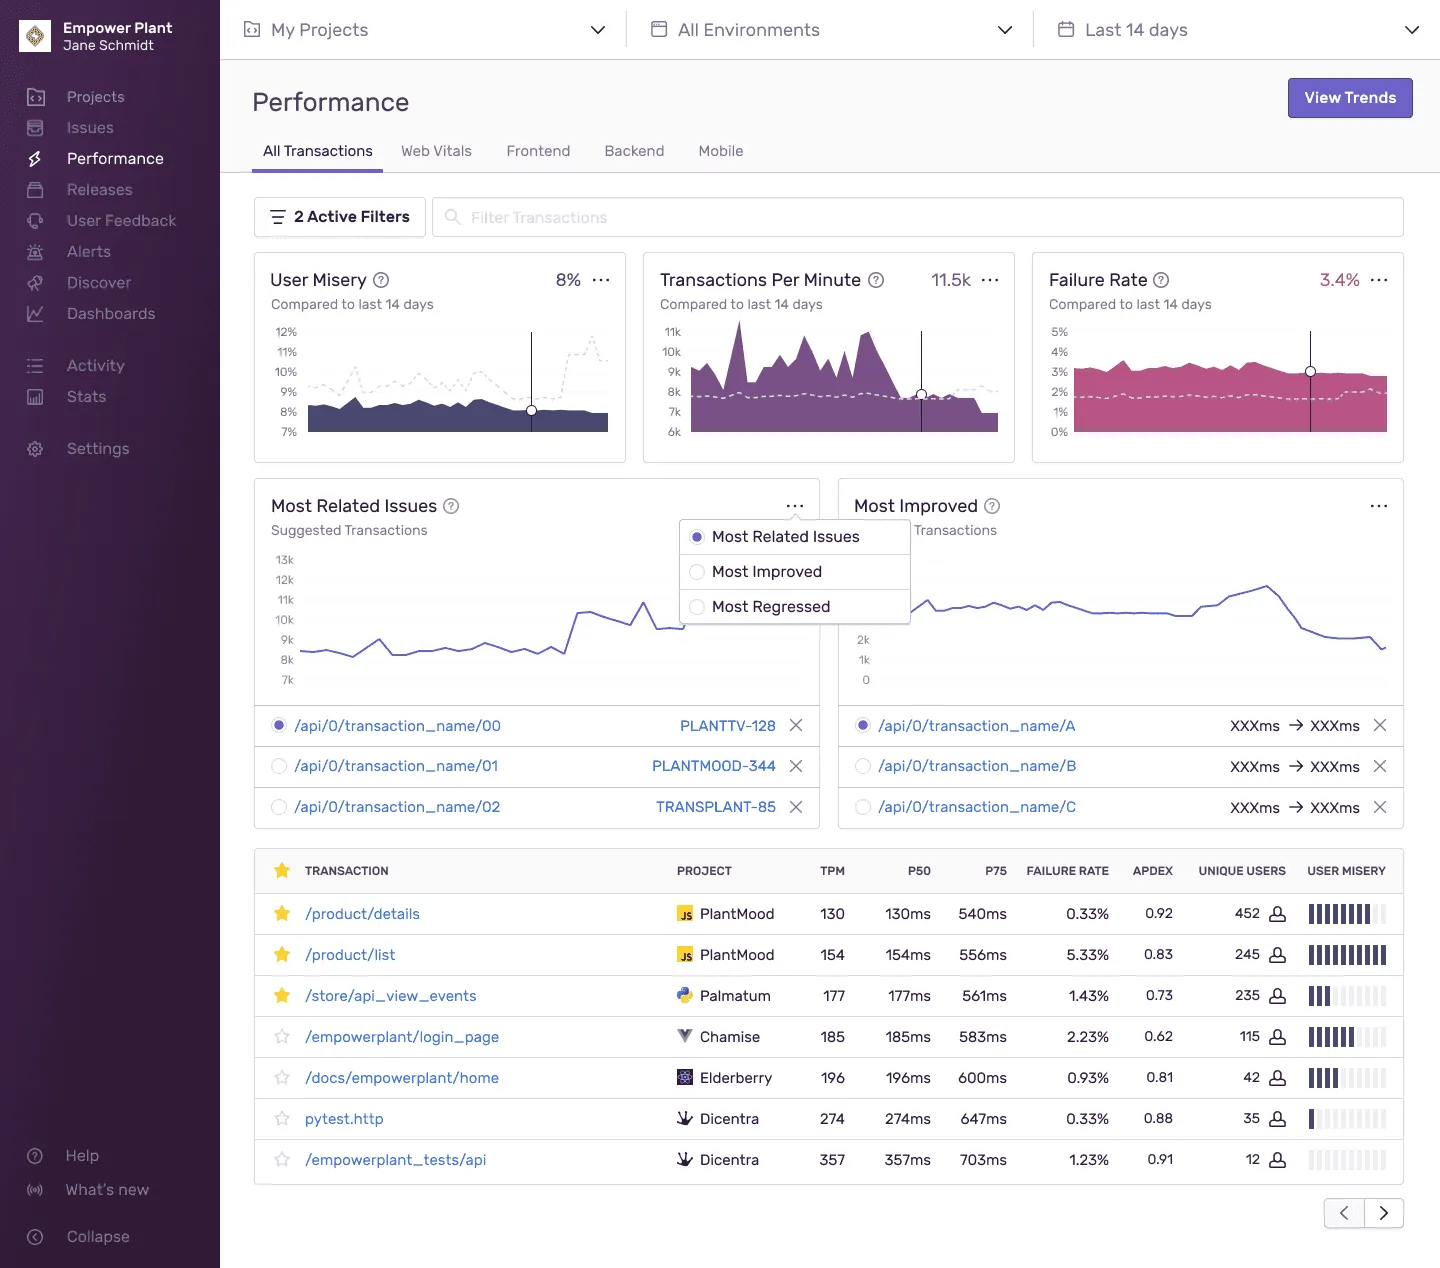
What is Sentry?
Sentry is an open-source error-tracking tool that helps developers monitor and fix crashes in real-time. It streamlines the error resolution process by providing detailed information about bugs and system issues as they occur.
Its primary focus is on improving code health, reducing downtime, and enhancing overall application performance.
Who is Sentry for?
Sentry specializes in error tracking and crash reporting, primarily for application developers. While on the other hand, New Relic offers a broader range of application performance monitoring tools, providing insights into the performance of applications, servers, and infrastructure. While Sentry is more focused on code-level issues, New Relic provides a comprehensive view of an application's health and performance.
Pricing
Sentry's pricing is divided into three plans:
- Team Plan: $26 per month, offering essential features for small teams.
- Business Plan: $80 per month, includes additional features like SSO, code owners, and more.
- Enterprise Plan: Custom pricing, designed for large organizations with advanced needs.
Each plan offers a different level of event volume and features, catering to the varying needs of teams and organizations.
More details on the Sentry pricing page.
How to choose between so many New Relic Alternatives?
Monitoring and observability are essential for applications in a production environment, and selecting the right tool for proactive action is crucial. Despite New Relic's capabilities, its challenges include legacy documentation, complex pricing, and a complicated user interface.
The suggested alternatives to New Relic could effectively meet your monitoring needs. Consider these factors when choosing a replacement:
Cost: Opt for solutions with clear and predictable pricing to avoid surprises like overage penalties.
Support: Valuable customer support and a robust community are key, especially during the transition to a new tool.
Open-Source: While not mandatory, an open-source tool offers transparency and customization opportunities for developers.
OpenTelemetry Support: Tools native to OpenTelemetry, such as SigNoz, align with the evolving standards of cloud-native application instrumentation.
Data Security and Compliance: The tool must comply with data privacy and security standards, particularly for sensitive information.
Trial Period and Transition Ease: A trial period and support for a smooth transition from New Relic are important considerations.
A tool like SigNoz(that's us) can be a great alternative to New Relic with its comprehensive features and transparent pricing policies.
Getting started with SigNoz
SigNoz cloud is the easiest way to run SigNoz. Sign up for a free account and get 30 days of unlimited access to all features.
You can also install and self-host SigNoz yourself since it is open-source. With 16,000+ GitHub stars, open-source SigNoz is loved by developers. Find the instructions to self-host SigNoz.
Related Posts


