Top 11 MYSQL monitoring tools in 2024 [open-source included]
Database monitoring is a critical component in your application performance monitoring. Apart from application code issues, database issues are one of the most common reasons for a bad user experience. MySQL is one of the most popular open-source DBMS that businesses have widely adopted.
MySQL monitoring tools can help you identify potential issues with your database, keep a continuous check on your database instances, improve performance and detect and alert you about real-time issues.
But choosing the right MySQL monitoring tool can be daunting. How do you know which one is right for your application stack? Here is a list of the top 11 MySQL monitoring tools that can help you keep your MySQL database instances in fine health:
- SigNoz
- Prometheus
- MySQL Enterprise Monitor
- Paessler PRTG Network Monitor
- Sematext
- SolarWinds
- Dynatrace
- DataDog
- New Relic
- ManageEngine Applications Manager
- Appdynamics
Top 11 MySQL monitoring tools
Here are the top 11 MySQL monitoring tools:
SigNoz MySQL monitoring (open-source)
SigNoz is an open-source APM tool that can help you monitor your MySQL database. With SigNoz, you can monitor your entire software system. You can track application metrics as well as infrastructure metrics. SigNoz is especially suited to monitor modern cloud-native applications based on microservices and serverless architecture.
Most modern applications are complex distributed systems, with multiple database instances serving queries from different services. As an APM tool that monitors all your services, SigNoz can monitor the performance of database calls from every service.
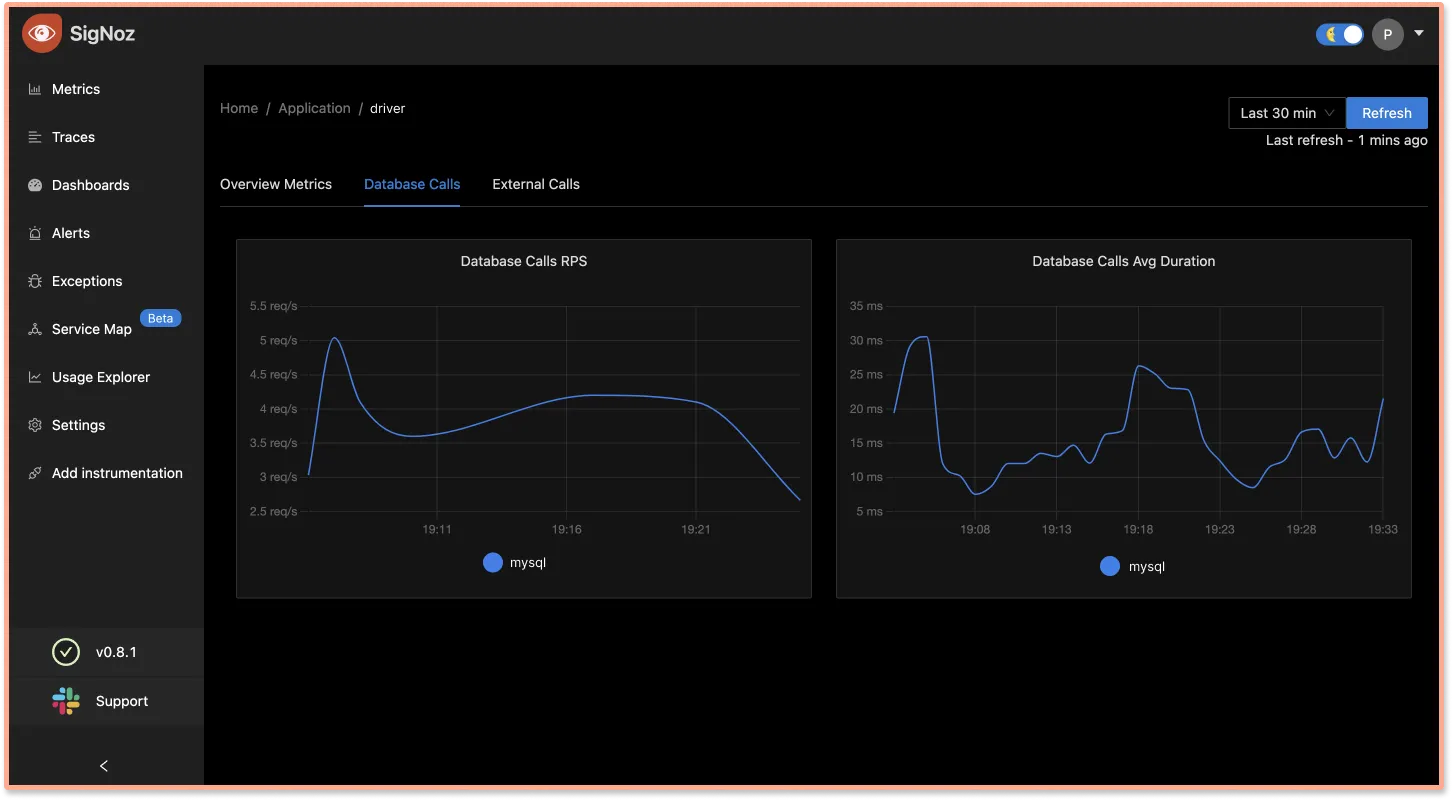
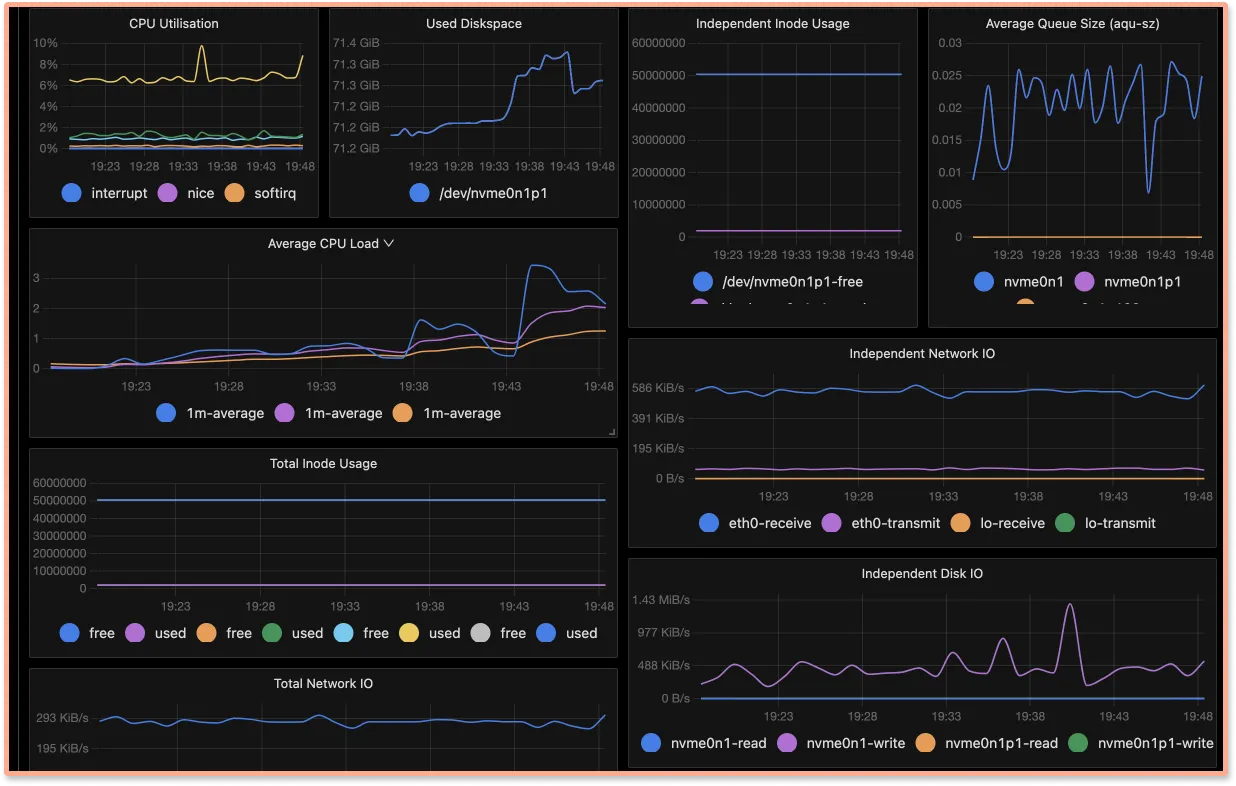
SigNoz also provides a metrics builder using which you can create customized dashboards to monitor your MySQL databases. You can also monitor the health and performance of the host machines where your MySQL database is hosted.
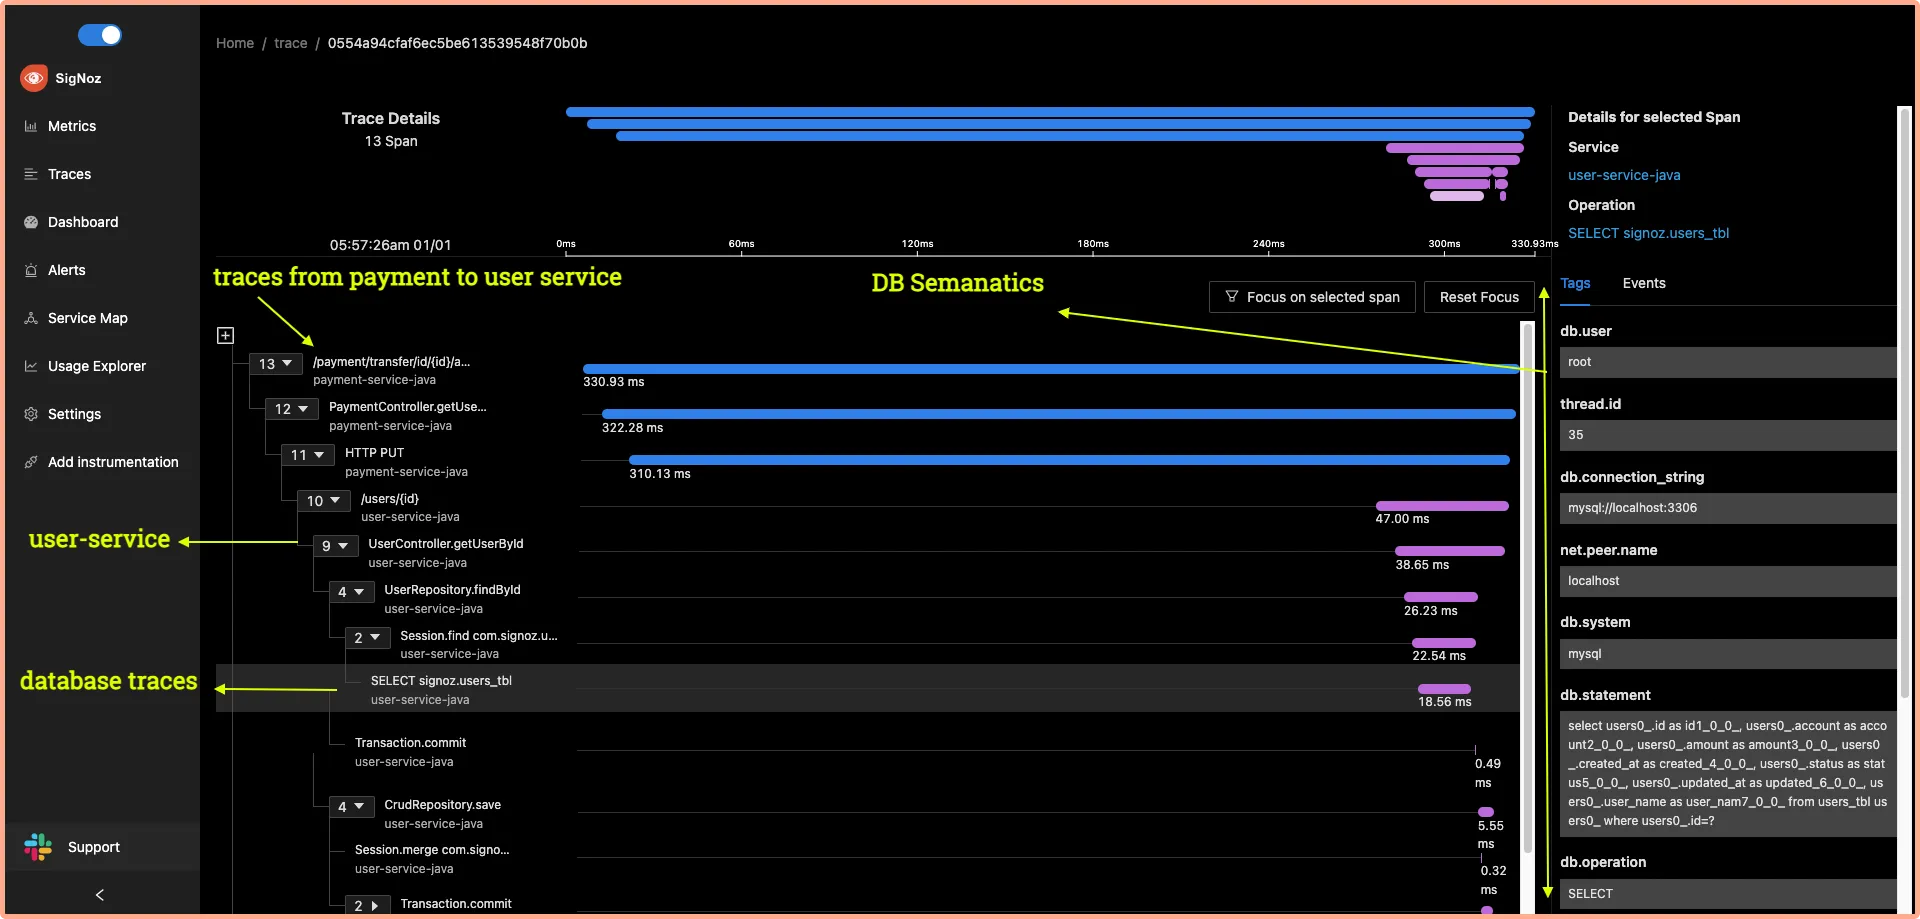
SigNoz also provides distributed tracing, using which you can visualize completely how a user request performs in its entirety. You can trace calls from your frontend web application to any database interactions made during the call. You can pinpoint specific MySQL queries which are causing performance bottlenecks.
It's very easy to get started with SigNoz. SigNoz cloud is the easiest way to run SigNoz. You can sign up for a free account and get 30 days of unlimited access to all features.
You can also install and self-host SigNoz yourself. It can be installed on macOS or Linux computers in just three steps by using a simple install script.
The install script automatically installs Docker Engine on Linux. However, on macOS, you must manually install Docker Engine before running the install script.
git clone -b main https://github.com/SigNoz/signoz.git
cd signoz/deploy/
./install.sh
Prometheus (open-source)
Prometheus enables you to capture time-series data as metrics. You can capture metrics about MySQL query performance and stats about your MySQL deployments using Prometheus.You will need to install a MySQL exporter that will collect metrics from your MySQL deployments and relay them to a Prometheus server.
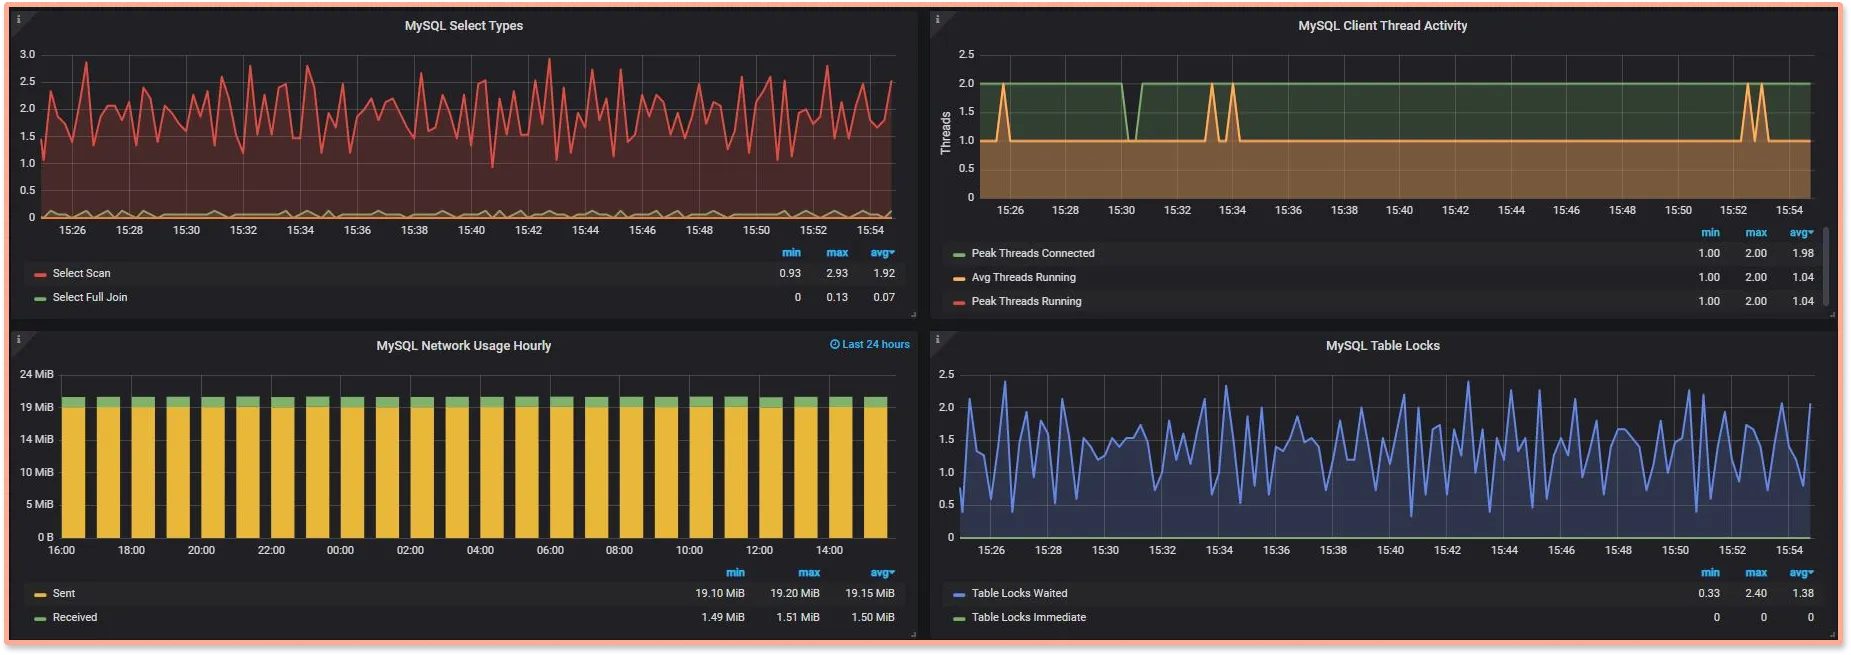
Prometheus comes with a very basic visualization layer. So it is generally used with Grafana, a visualization tool to create charts and metrics.
Prometheus does not provide distributed tracing; hence it will not provide you with contextual information for your MySQL database queries. But it can give you good insights into how your single MySQL instances are performing.
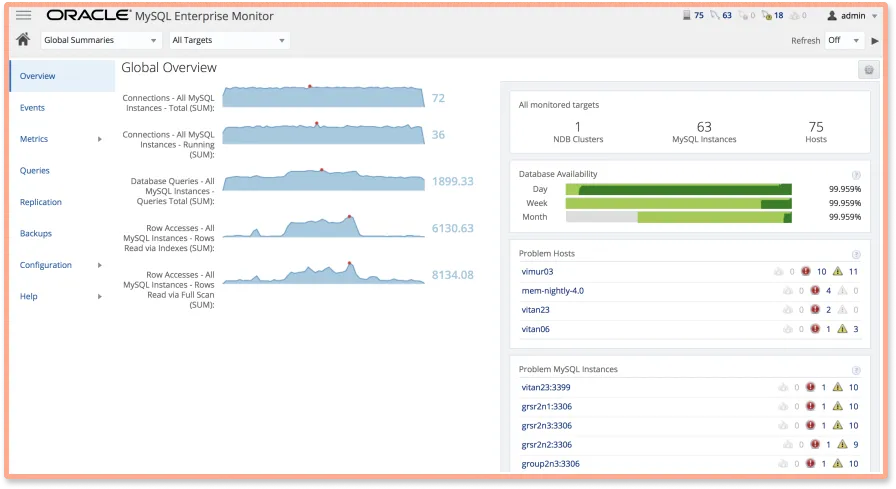
MySQL Enterprise Monitor
MySQL enterprise edition comes with MySQL Enterprise Monitor. You can use MySQL enterprise monitor to improve the performance and availability of your MySQL instances.
It is a monitoring tool designed to keep track of MySQL real-time instances and hosts, alert users about possible issues, and help them to resolve them.
Some key features of MySQL enterprise monitor include:
- Cloud-based remote monitoring
- Visual Query Analysis
- MySQL Cluster Monitoring
- Real-time Health & Availability Monitoring
- Easy to set up and configure
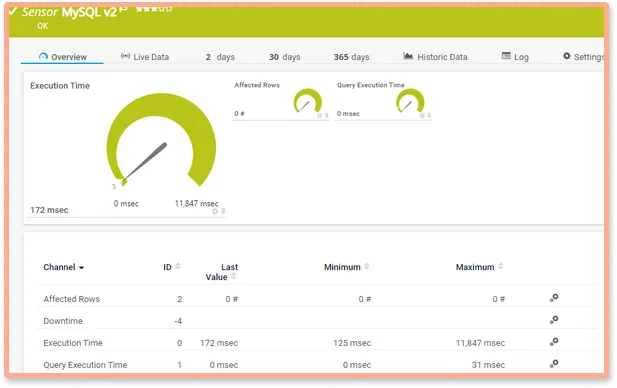
Paessler PRTG Network Monitor
Paessler PRTG Network monitor is a monitoring tool meant to monitor your IT infrastructure. It provides MySQL monitoring as part of its offering. Using PRTG MySQL monitoring, you can keep an eye on the availability of your MySQL database.PRTG provides a pre-defined sensor for MySQL monitoring. You can start using the sensor immediately to monitor some MySQL database metrics like availability and execution time.
Some of the key features of the PRTG network monitor for MySQL monitoring include:
- Monitor the availability of your MySQL database
- Keeps a check on performance by creating automated requests to check the total request time
- Lets you monitor specific datasets from your MySQL database
- Provides an alarm feature to keep you notified of any issues in the database
Sematext
Sematext is an enterprise monitoring tool that provides a range of solutions for IT systems and infrastructure monitoring. It provides detailed dashboards for MySQL monitoring. Some of the key MySQL performance metrics that you can track with Sematext are availability, replication, connections, query rate, etc.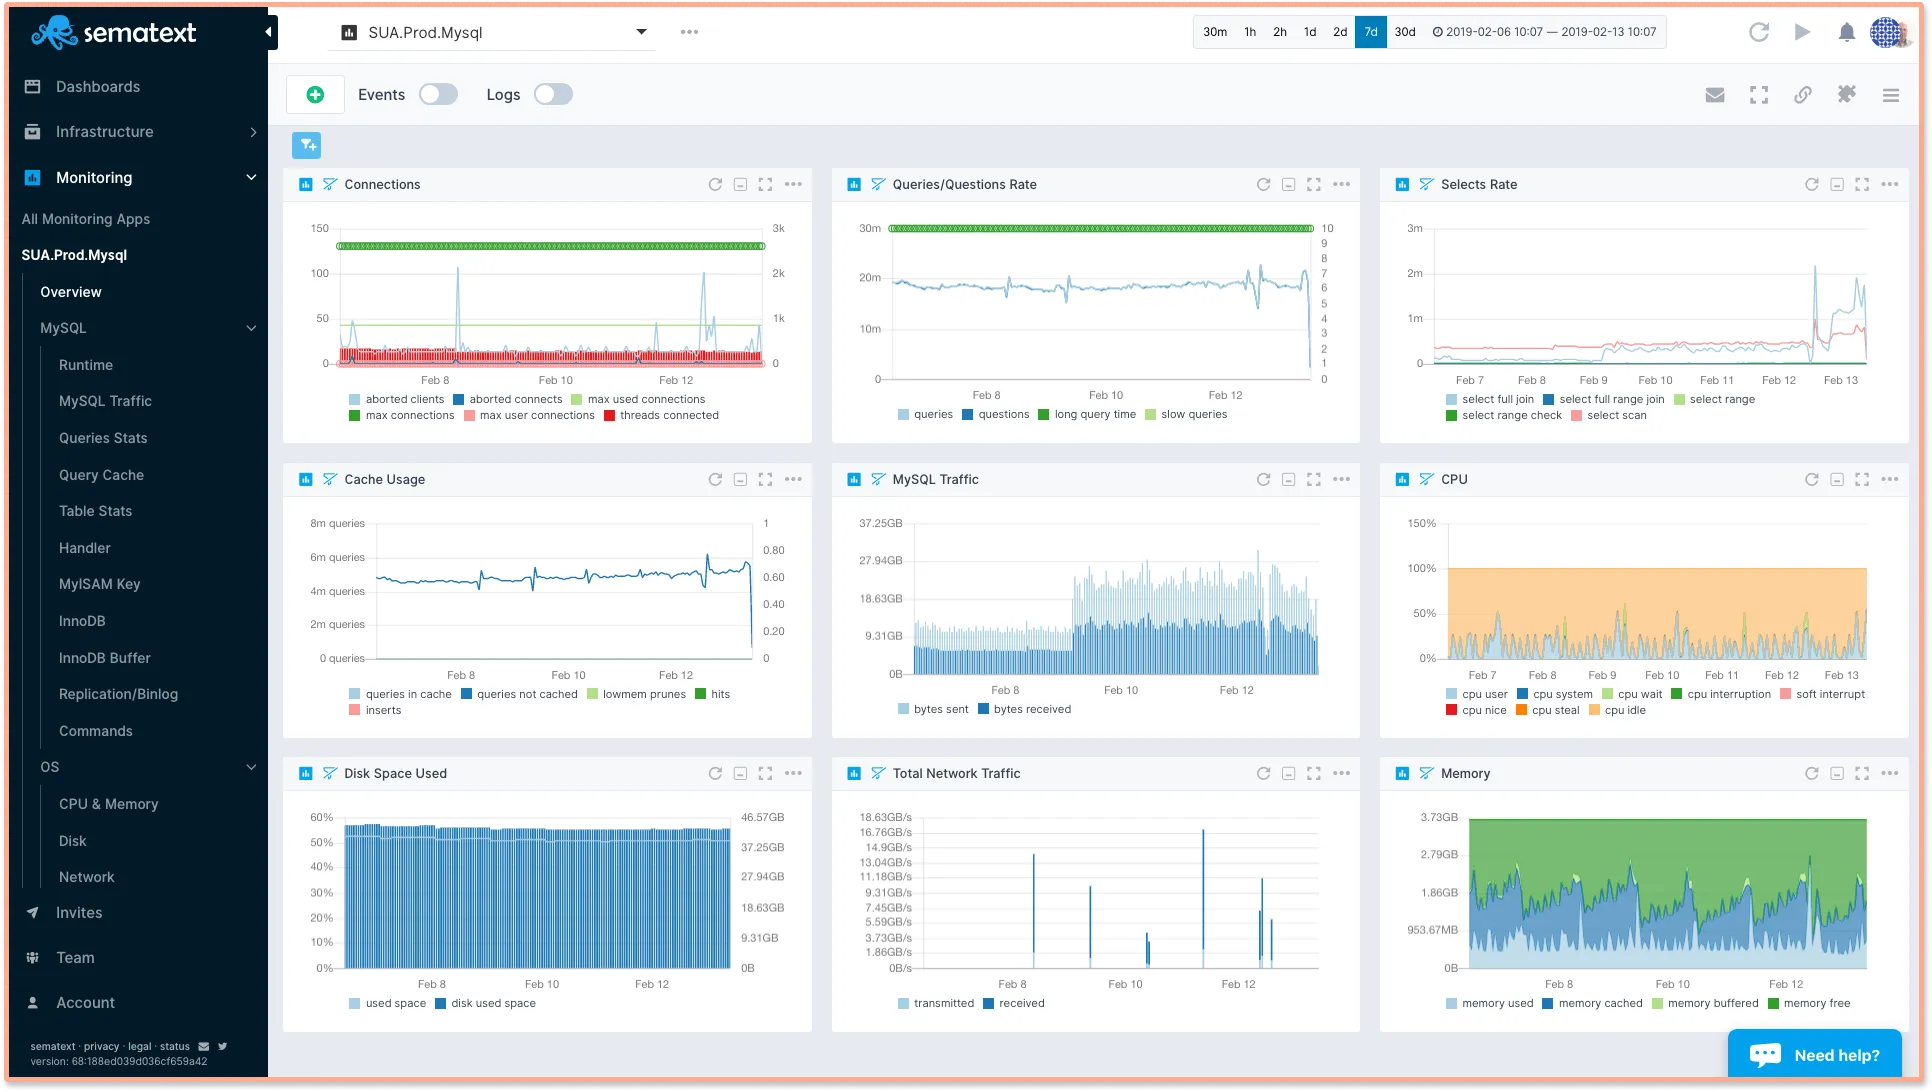
Solarwinds
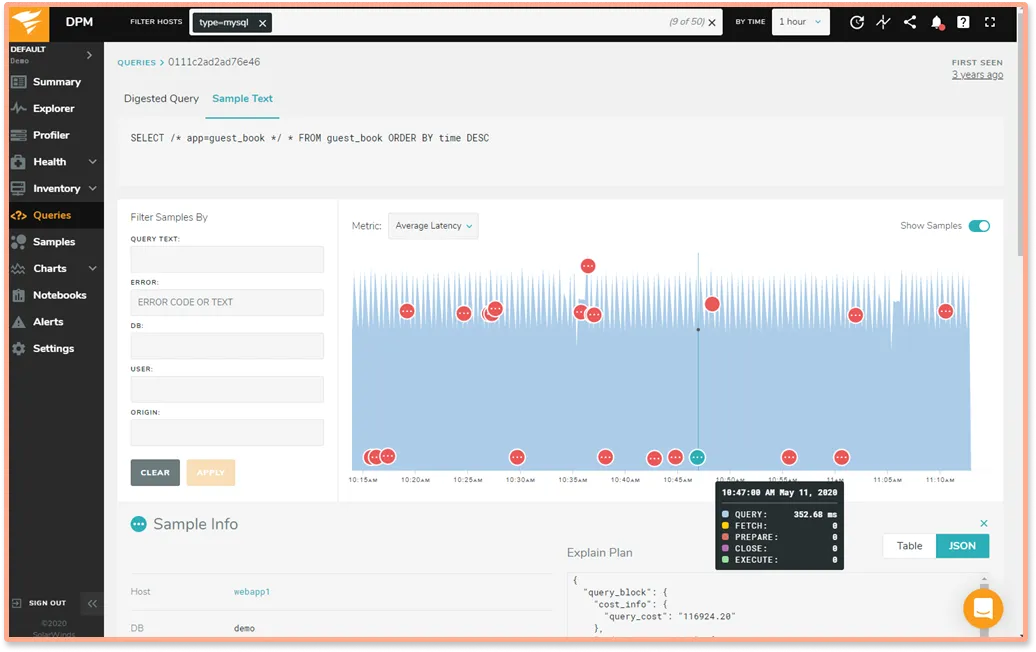
Solarwinds is an IT management and observability platform that provides a solution for MySQL monitoring. Solarwinds provides Database Performance Monitoring(DPM) to monitor and pinpoint MySQL issues. For getting started, Solarwinds’ DPM provides agents that auto-discover your systems and get installed.Using DPM, you can monitor a broad set of metrics from system components like databases, processes, CPUs, and more.
Dynatrace
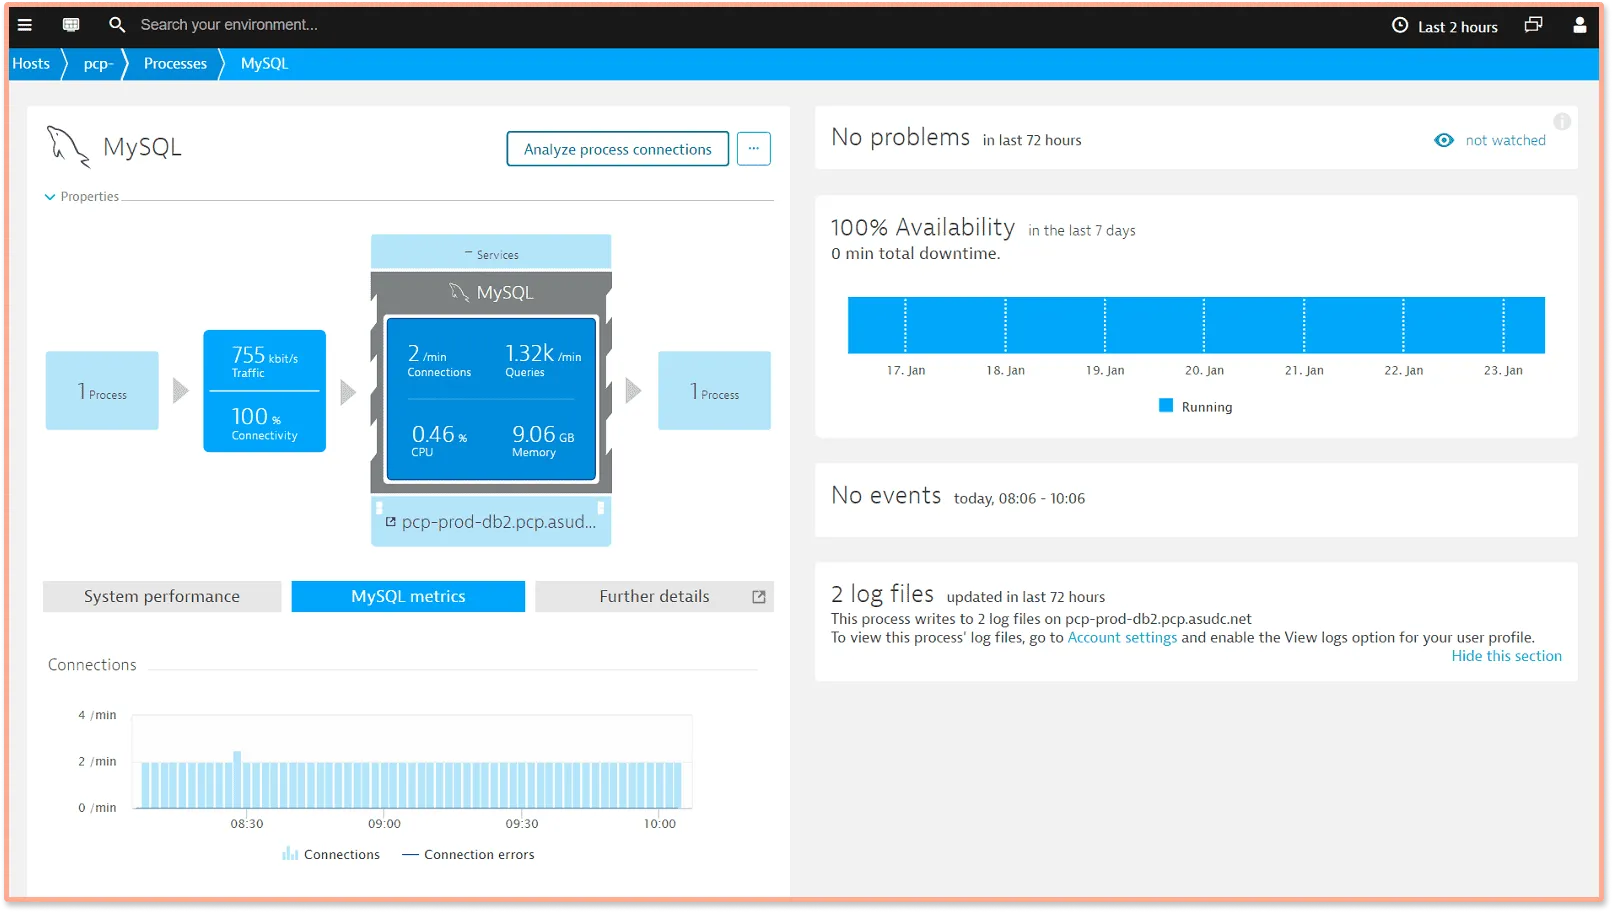
Dynatrace is a cloud-based monitoring solution that provides MySQL monitoring capabilities. Its agents can auto-detect your MySQL databases to start monitoring.Dynatrace compares current MySQL performance with historical metrics and creates a baseline for performance. It also categorizes all activities that occur on your MySQL database instances to drive insights into MySQL performance. The best thing about Dynatrace MySQL monitoring is that it monitors MySQL from application’s perspective. For example, it will automatically detect queries that read a lot of data.
Datadog
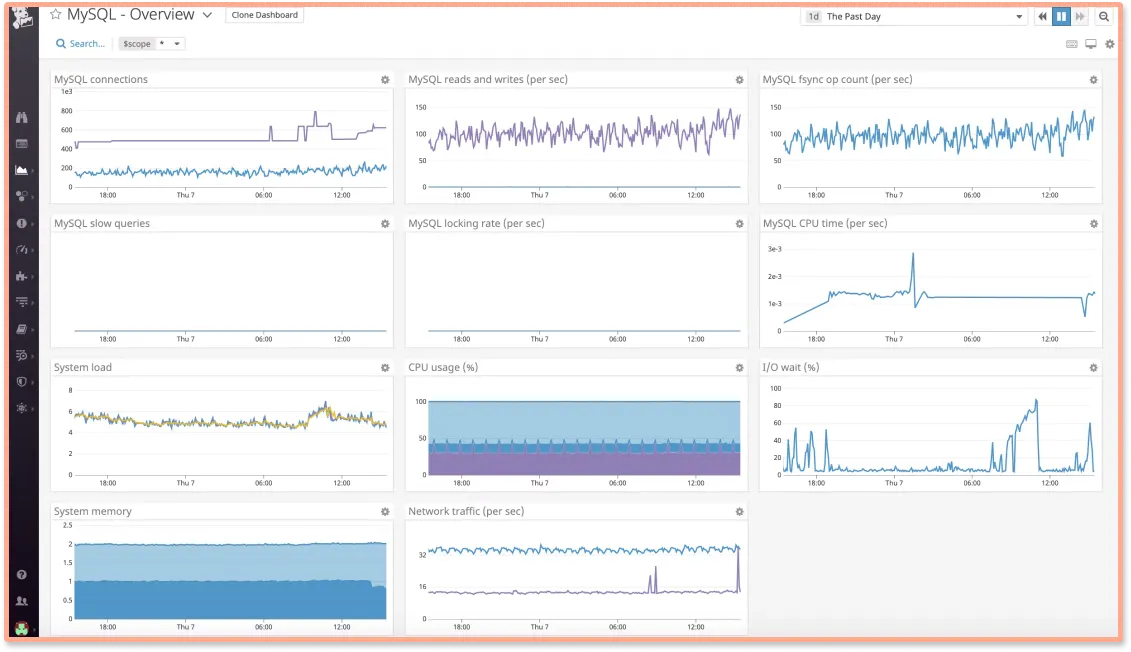
Datadog is an enterprise monitoring tool that provides a host of solutions like APM, infrastructure monitoring, real-user monitoring, etc. Datadog provides MySQL monitoring that continually collects MySQL statistics and metrics.To start monitoring your database servers, you need to install Datadog agents on your database servers. You can also use Datadog dashboard monitoring to monitor the historical performance of your MySQL databases.
New Relic
New Relic is an application monitoring enterprise tool that provides a range of solutions from application monitoring and infrastructure monitoring to log management.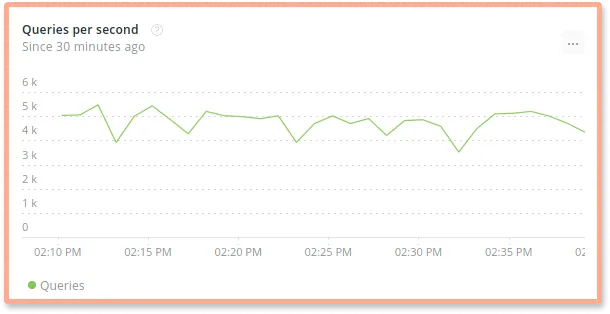
Using New Relic’s dashboard, you can monitor key MySQL performance metrics like uptime, the number of simultaneous connections, memory usage, storage speed, query speed, etc. New Relic provides a MySQL integration that collects and sends data from the MySQL database to New Relic’s platform.
ManageEngine Applications Manager
ManageEngine Application manager can be used to monitor MySQL databases. You can monitor key MySQL monitoring metrics and also trigger notifications in case of downtimes. Some of the key metrics that the Application Manager can track for MySQL are connection time, request statistics, connection statistics, table lock statistics, query hit ratio, etc.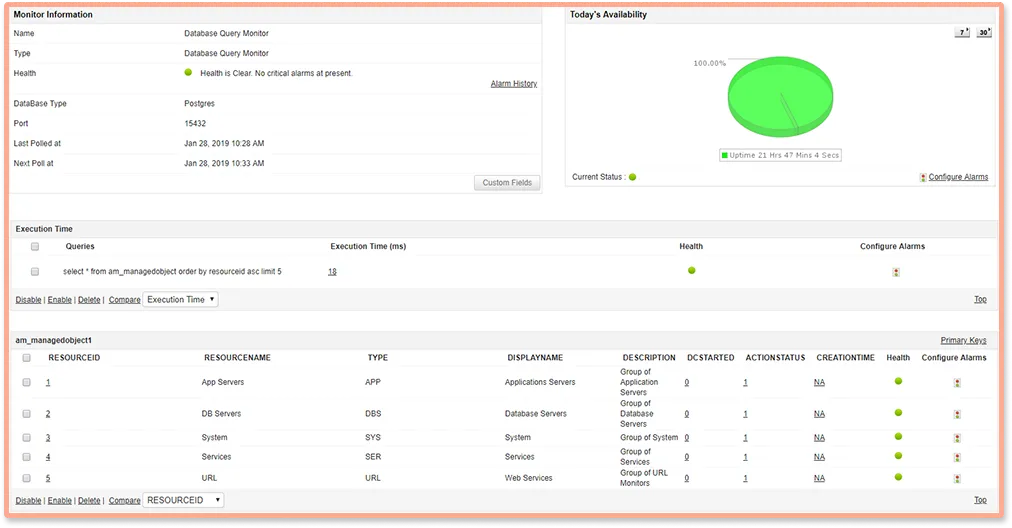
Appdynamics
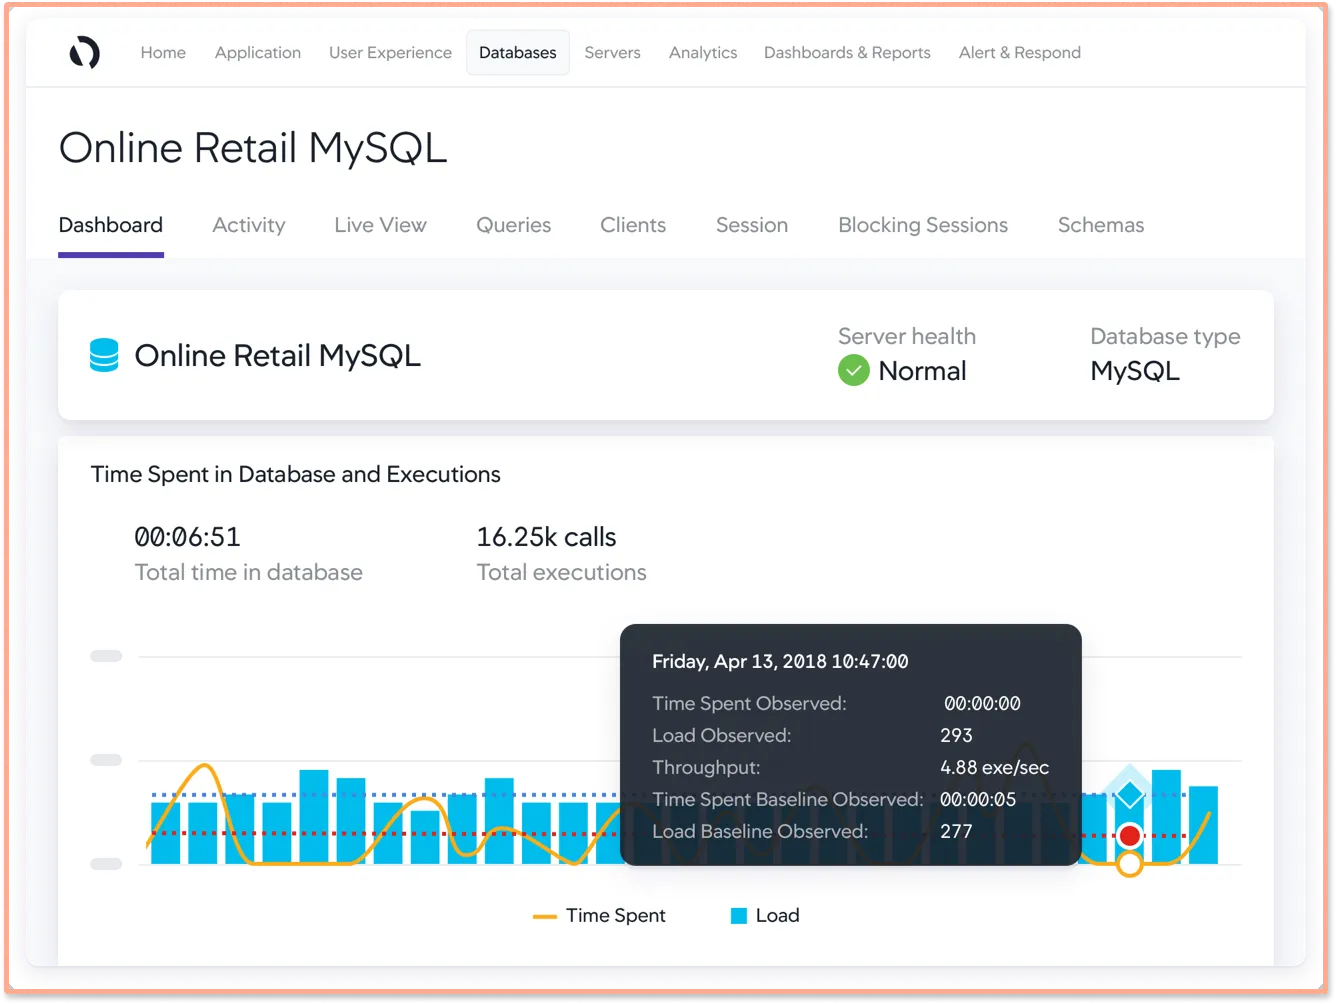
Appdynamics provides an APM solution that can be used to monitor MySQL databases. It provides a database monitoring product module that can monitor any version of MySQL database running on any platform.Using Appdynamics database monitoring, you can perform root cause analysis with access to detailed graphs of the MySQL servers your application is using. It also provides historical trend analysis using which you can create a baseline for your MySQL performance.
Choosing the right tool to monitor your MySQL databases
MySQL database servers process huge amounts of transaction, and these transactions are critical to users using your application. Database performance issues, if not resolved timely, can lead to huge losses in business opportunities. As such, having a robust monitoring tool for your MySQL servers is critical.
One of the biggest concerns you should address while choosing a monitoring tool for MySQL should be how easily the tool lets you correlate your database queries with user interactions. Having complete visibility on the entire request involving MySQL queries can help engineering teams debug performance issues faster.
You can monitor your MySQL servers in isolation, but it would be much more effective if the monitoring tool helps you monitor MySQL servers with contextual information like which service made the call along with resource metrics from your infrastructure. For this to happen, the tool must have capabilities like distributed tracing. SigNoz, the open-source APM, provides distributed tracing as one of its major features.
Using SigNoz, you can trace your MySQL queries and see the entire request in its entirety. SigNoz uses OpenTelemetry as the agent to instrument your application and database calls. OpenTelemetry is quietly becoming the standard way of instrumenting cloud-native applications. By choosing SigNoz, you can future-proof your monitoring stack with effective monitoring of MySQL database servers.
SigNoz is open-source, you can check out the repo on GitHub:
Getting started with SigNoz
SigNoz can be installed on macOS or Linux computers in just three steps by using a simple install script.
The install script automatically installs Docker Engine on Linux. However, on macOS, you must manually install Docker Engine before running the install script.
git clone -b main https://github.com/SigNoz/signoz.git
cd signoz/deploy/
./install.sh
You can visit our documentation for instructions on how to install SigNoz using Docker Swarm and Helm Charts.


