How to set up Golang application performance monitoring with open source monitoring tool - SigNoz
In this article, learn how to setup application monitoring for Golang apps using an open-source solution, SigNoz.
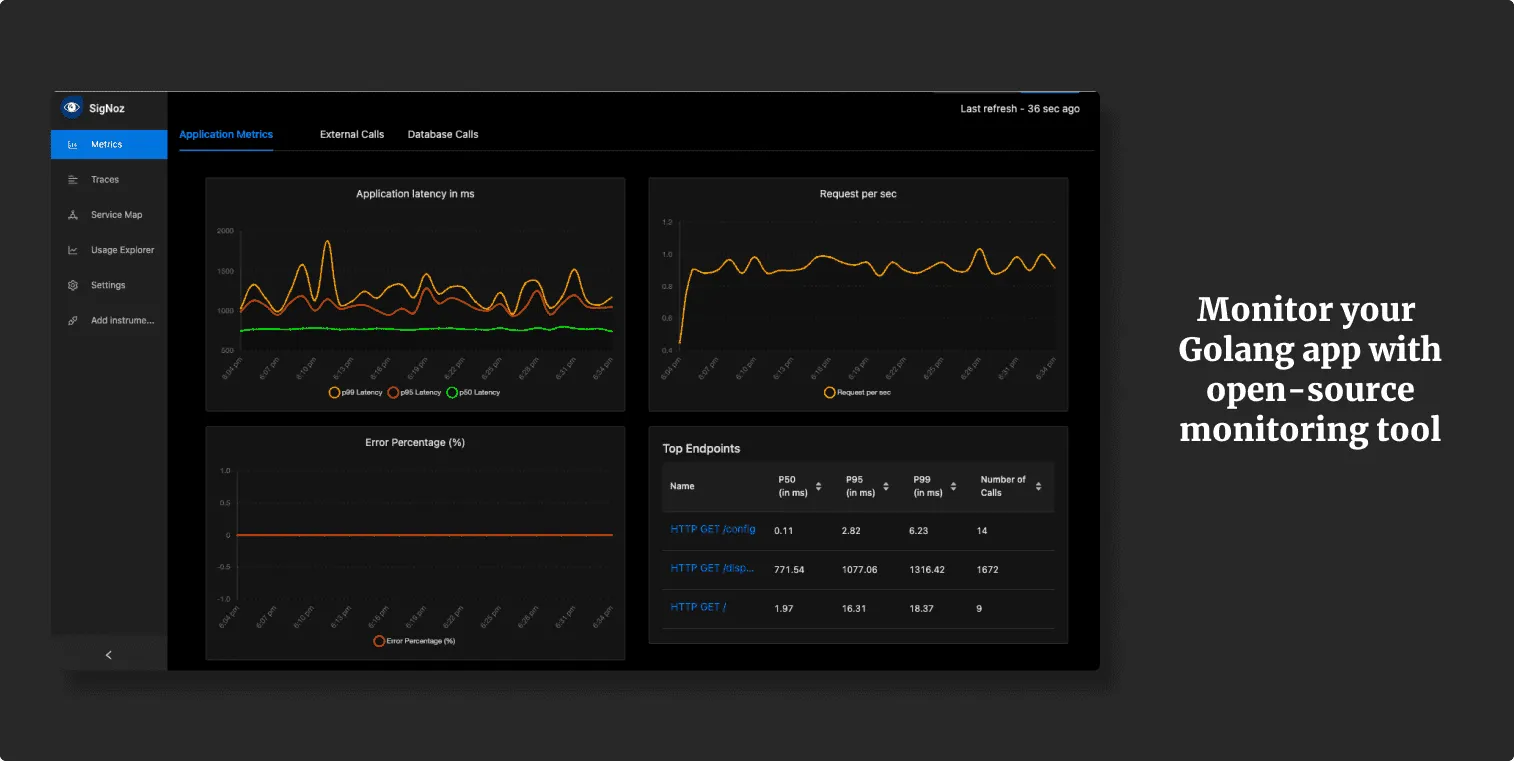
If you want to check our Github repo before diving in 👇
Scalability, Reliability, Maintainability...
The list goes on for the benefits of microservices architecture in today's world. But along with these benefits also comes the challenges of complexity. How do you ensure your distributed infrastructure, which spans across servers, datastores, cloud vendors, and third-party APIs, is in fine health to meet customer requirements all the time?
A single user request may get routed through three, five, eighteen, or hundred different layers of services.
And it quickly becomes unrealistic for teams to identify which service was responsible for slowing a request down. Engineering teams need a system that brings context to this complexity. A system which enables quick identification of potential issues so that it can be resolved as quickly. And that's where there is a need for a robust monitoring framework.
Table of contents
- Introducing SigNoz
- Installing SigNoz
- Instrumenting a sample Golang app
- Monitor your Go application with SigNoz dashboards
Introducing SigNoz
SigNoz is a full-stack open-source application monitoring and observability platform which can be installed within your infra. It provides metrics monitoring, distributed tracing, exceptions monitoring,and custom dashboards - everything under a single pane of glass. You can also set alerts on your critical metrics to keep yourself notified.
You can track metrics like p99 latency, error rates for your services, external API calls, and individual endpoints. With service maps, you can quickly assess the health of your services.
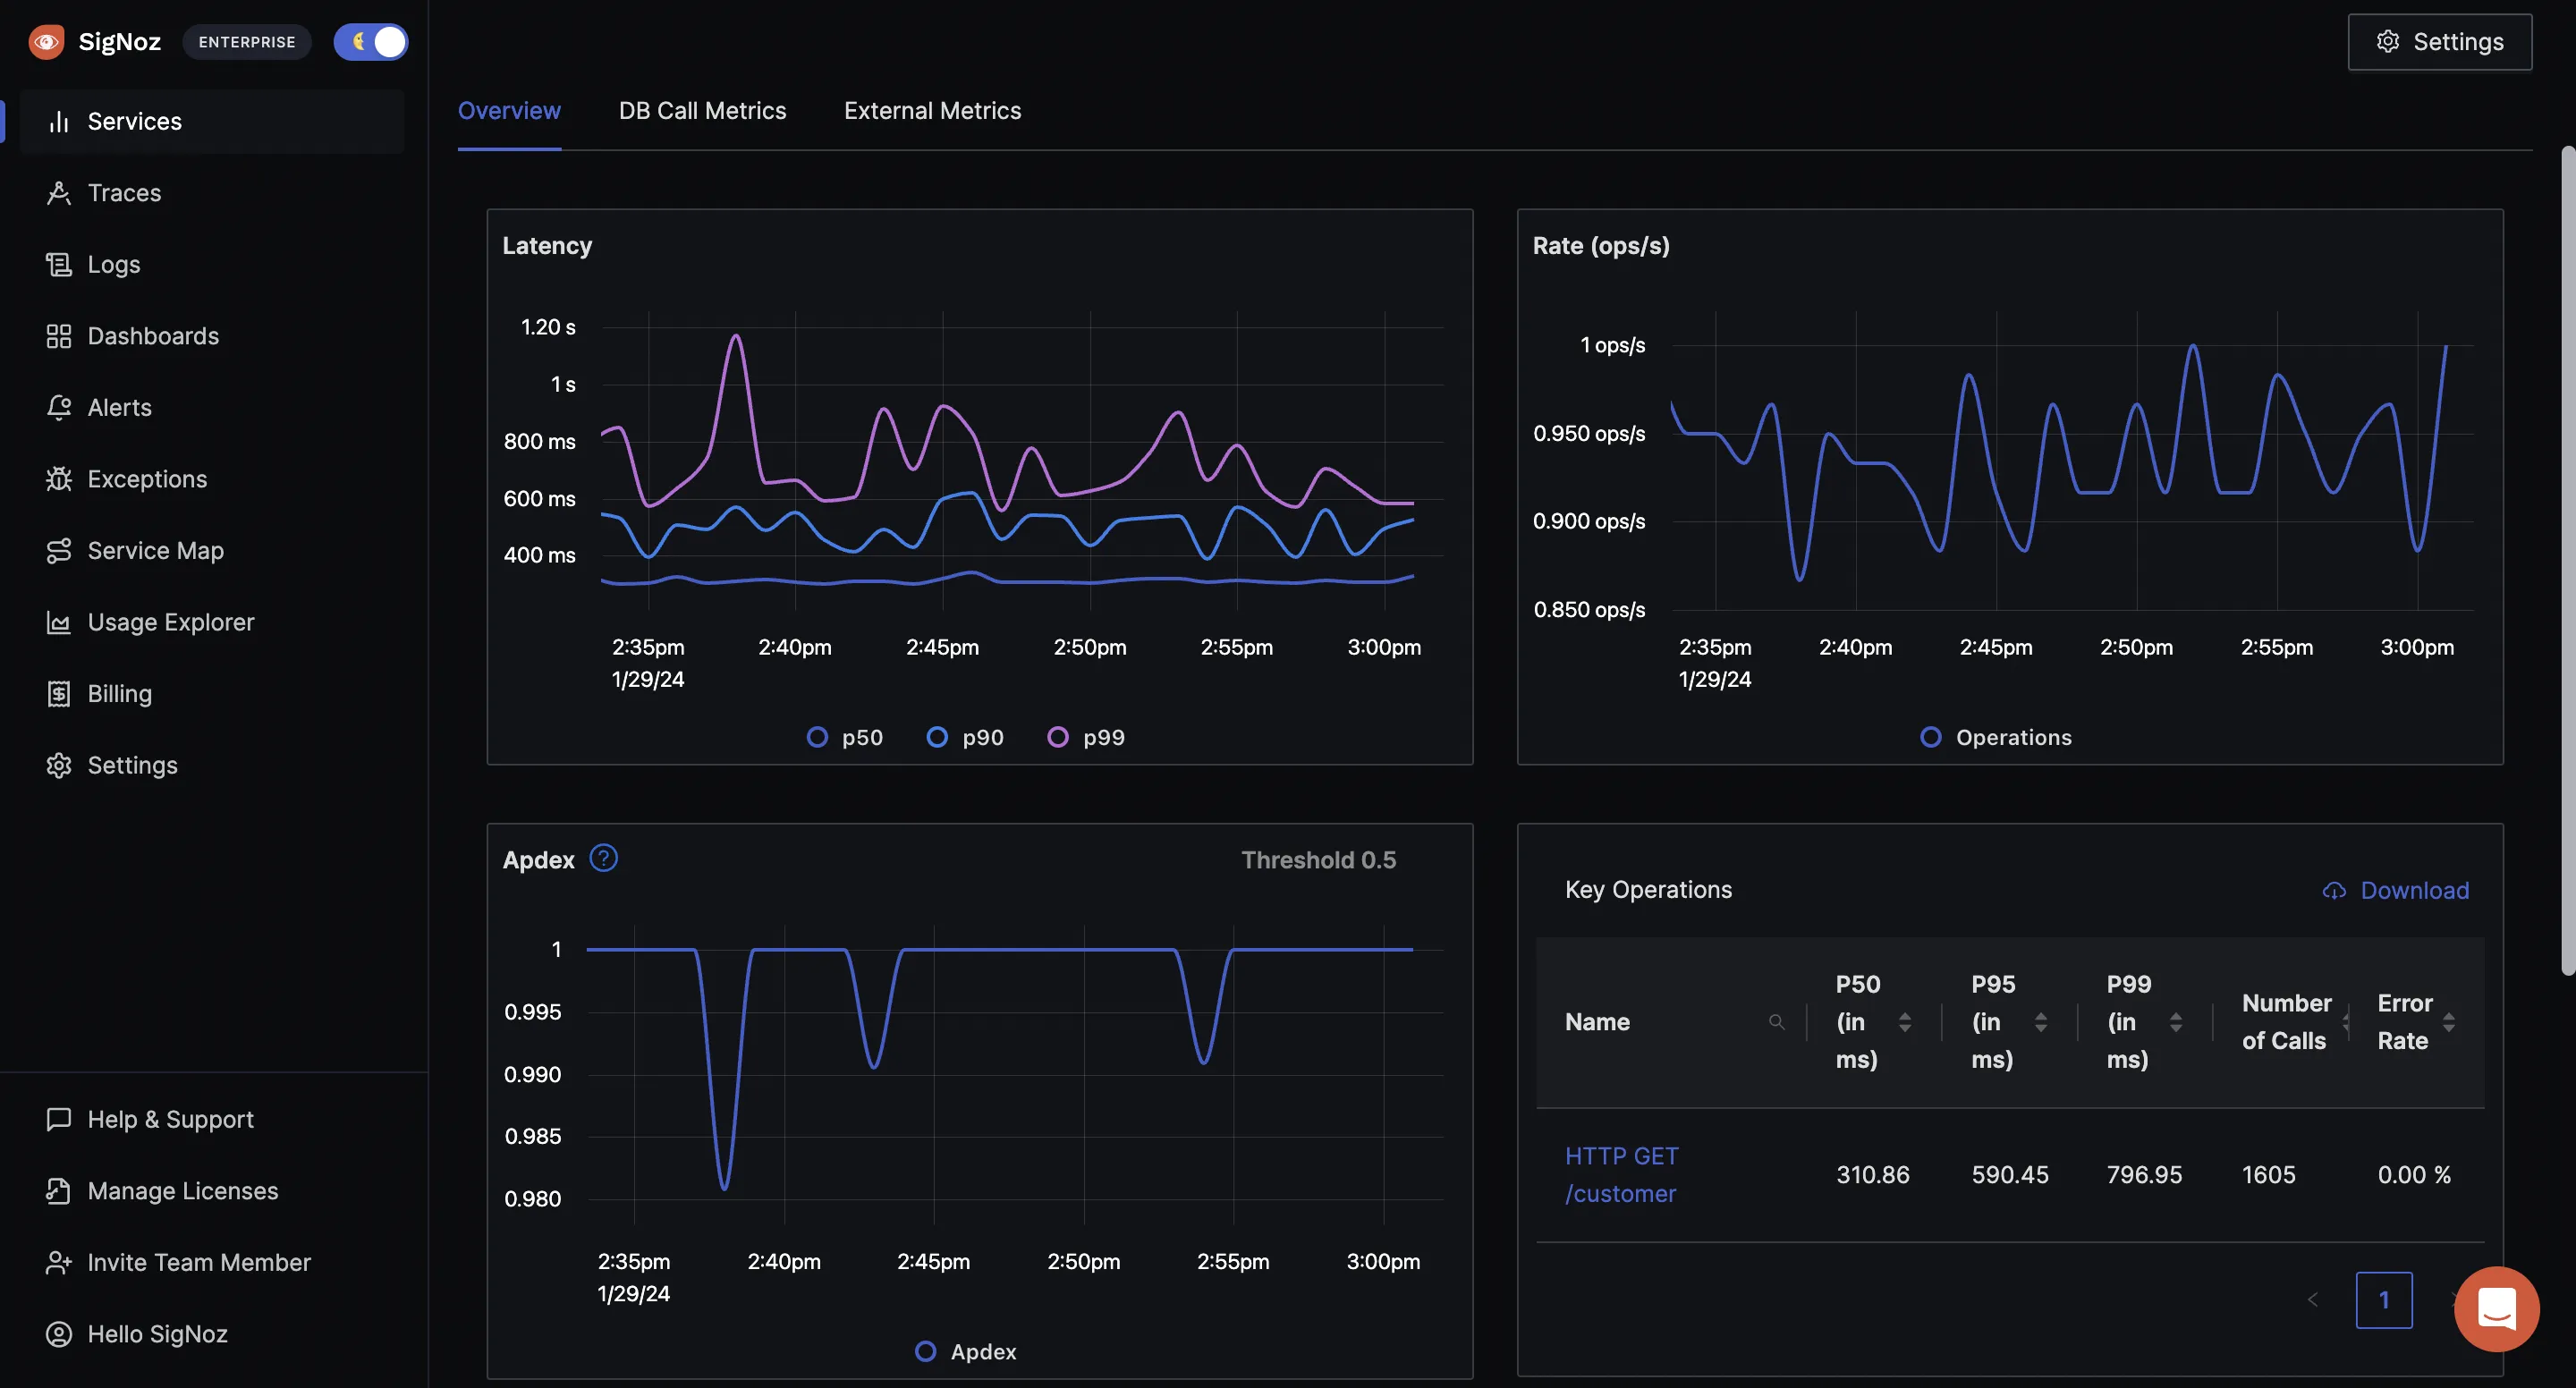
And once you know the affected service, trace data can help you identify the exact code causing the issue. Using SigNoz dashboard, you can visualize your traces easily with flamegraphs.

Now let's get down to some action and see everything for yourself.
We will divide the tutorial into two parts:
- Installing SigNoz
- Instrumenting a sample Golang application to start monitoring
Installing SigNoz
First, you need to install SigNoz so that OpenTelemetry can send the data to it.
SigNoz can be installed on macOS or Linux machines in just three steps by using a simple install script.
The install script automatically installs Docker Engine on Linux. However, on macOS, you must manually install Docker Engine before running the install script.
git clone -b main https://github.com/SigNoz/signoz.git
cd signoz/deploy/
./install.sh
You can visit our documentation for instructions on how to install SigNoz using Docker Swarm and Helm Charts.
When you are done installing SigNoz, you can access the UI at http://localhost:3301
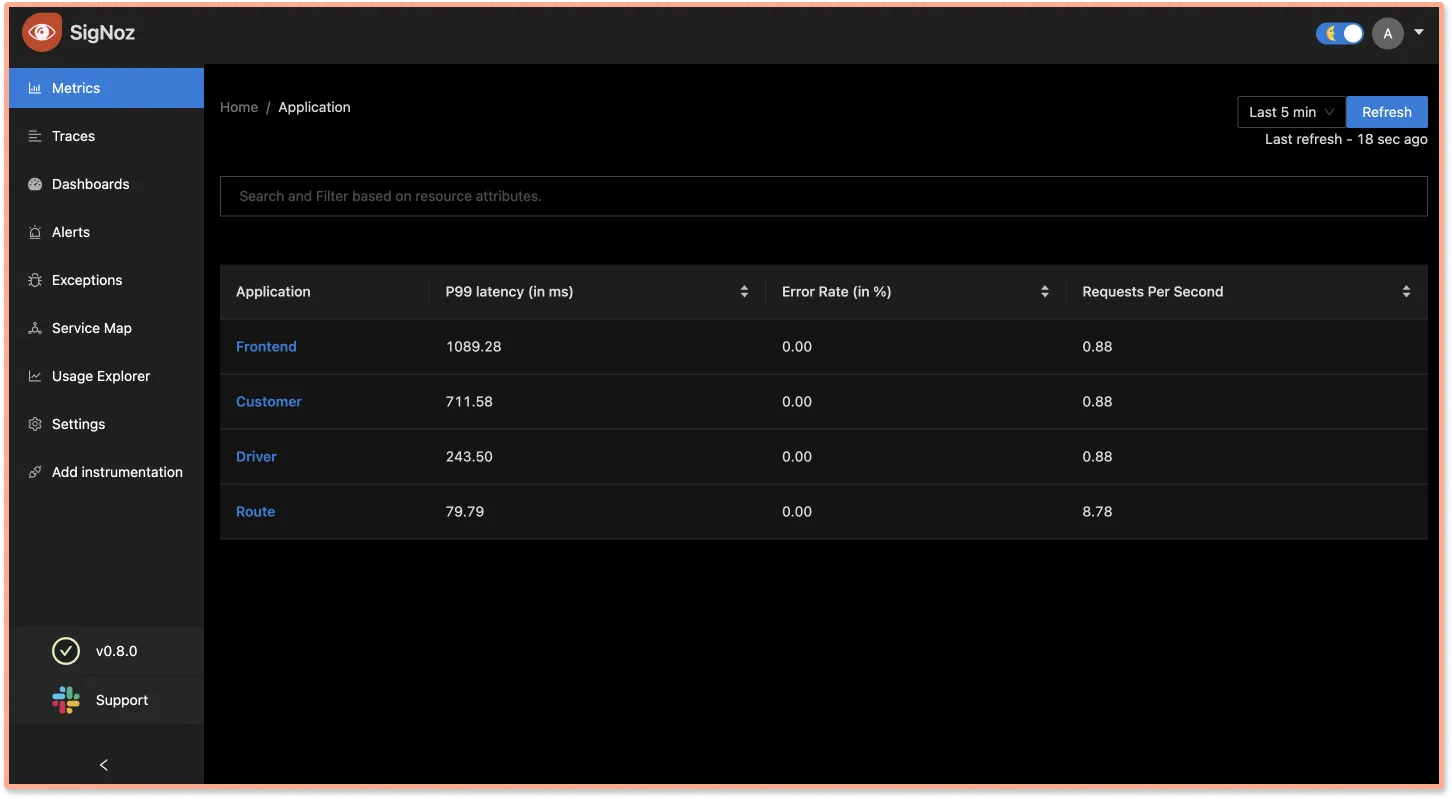
The application list shown in the dashboard is from a sample app called HOT R.O.D that comes bundled with the SigNoz installation package.
Now that you have SigNoz up and running, let's see how instrumentation works. Instrumentation is the process of implementing code instructions to monitor your application's performance. Instrumentation is key to see how your application handles the real world. It helps you generate trace data which you can then use to understand what's happening inside your systems.
SigNoz supports OpenTelemetry as the primary way for users to instrument their application. OpenTelemetry is a single, vendor-agnostic instrumentation library with support for both automatic and manual instrumentation. More details on OpenTelemetry Golang SDKs and APIs here.
Instrumenting a sample Golang app
To see how SigNoz can start reporting data of a Golang app, let's see how it works with a sample bookstore app (GitHub repo).
It is a simple bookstore app with a REST API that provides book data and performs CRUD operations. The app uses Gin framework to build a RESTful API. Gin is a high-performance HTTP web framework written in Golang containing a set of commonly used functionalities like routing, middleware support and rendering.
OpenTelemetry has specific instrumentation packages to support popular Golang packages and use cases. For example, this app uses the Gin framework for request routing. OpenTelemetry provides instrumentation package named otelgin to instrument the Gin framework which you need to import in your app. You can find the complete list of supported Golang packages here.
Prerequisites
Verify if you have Golang installed on your machine by running $ go version on your terminal. If you don't have Golang installed, you can download it here.
Step 1: Get sample Go app from GitHub
The sample Go app repo contains the boilerplate code that we will instrument.
If you want to follow along with the tutorial, then you should follow the without-instrumentation branch.
Step 2: Install dependencies
Dependencies related to OpenTelemetry exporter and SDK have to be installed first. Run the below commands after navigating to the application source folder:
go get go.opentelemetry.io/otel \
  go.opentelemetry.io/otel/trace \
  go.opentelemetry.io/otel/sdk \
  go.opentelemetry.io/contrib/instrumentation/github.com/gin-gonic/gin/otelgin \
  go.opentelemetry.io/otel/exporters/otlp/otlptrace \
  go.opentelemetry.io/otel/exporters/otlp/otlptrace/otlptracegrpc \
Step 3: Declare environment variables for configuring OpenTelemetry
Declare the following variables in main.go which we will use to configure OpenTelemetry:
var (
    serviceName  = os.Getenv("SERVICE_NAME")
    collectorURL = os.Getenv("OTEL_EXPORTER_OTLP_ENDPOINT")
    insecure     = os.Getenv("INSECURE_MODE")
)
Step 4: Instrument your Go application with OpenTelemetry
To configure your application to send data we will need a function to initialize OpenTelemetry. Add the following snippet of code in your main.go file.
import (
    .....

    "google.golang.org/grpc/credentials"
    "github.com/gin-gonic/gin"
    "go.opentelemetry.io/otel"
    "go.opentelemetry.io/otel/attribute"
    "go.opentelemetry.io/otel/exporters/otlp/otlptrace"
    "go.opentelemetry.io/otel/exporters/otlp/otlptrace/otlptracegrpc"

    "go.opentelemetry.io/otel/sdk/resource"
    sdktrace "go.opentelemetry.io/otel/sdk/trace"
)

func initTracer() func(context.Context) error {

    var secureOption otlptracegrpc.Option

    if strings.ToLower(insecure) == "false" || insecure == "0" || strings.ToLower(insecure) == "f" {
        secureOption = otlptracegrpc.WithTLSCredentials(credentials.NewClientTLSFromCert(nil, ""))
    } else {
        secureOption = otlptracegrpc.WithInsecure()
    }

    exporter, err := otlptrace.New(
        context.Background(),
        otlptracegrpc.NewClient(
            secureOption,
            otlptracegrpc.WithEndpoint(collectorURL),
        ),
    )

    if err != nil {
        log.Fatalf("Failed to create exporter: %v", err)
    }
    resources, err := resource.New(
        context.Background(),
        resource.WithAttributes(
            attribute.String("service.name", serviceName),
            attribute.String("library.language", "go"),
        ),
    )
    if err != nil {
        log.Fatalf("Could not set resources: %v", err)
    }

    otel.SetTracerProvider(
        sdktrace.NewTracerProvider(
            sdktrace.WithSampler(sdktrace.AlwaysSample()),
            sdktrace.WithBatcher(exporter),
            sdktrace.WithResource(resources),
        ),
    )
    return exporter.Shutdown
}
Step 5: Initialize the tracer in main.go
Modify the main function to initialise the tracer in main.go
func main() {
    cleanup := initTracer()
    defer cleanup(context.Background())

    ......
}
Step 6: Add the OpenTelemetry Gin middleware
Configure Gin to use the middleware by adding the following lines in main.go.
import (
    ....
  "go.opentelemetry.io/contrib/instrumentation/github.com/gin-gonic/gin/otelgin"
)

func main() {
    ......
    r := gin.Default()
    r.Use(otelgin.Middleware(serviceName))
    ......
}
Step 7: Set environment variables and run your Go Gin application
Now that you have instrumented your Go Gin application with OpenTelemetry, you need to set some environment variables to send data to SigNoz backend:
SERVICE_NAME: goGinApp (you can name it whatever you want)
OTEL_EXPORTER_OTLP_ENDPOINT: localhost:4317
Since, we have installed SigNoz on our local machine, we use the above IP. If you install SigNoz on a different machine, you can update it with the relevant IP.
Hence, the final run command looks like this:
SERVICE_NAME=goGinApp INSECURE_MODE=true OTEL_EXPORTER_OTLP_ENDPOINT=localhost:4317 go run main.go
Do not use http or https in the IP address. For example, if the IP is http://test.com then the OTEL_EXPORTER_OTLP_ENDPOINT will be test.com:4317
And, congratulations! You have instrumented your sample Golang app.
Hit the /books endpoint of the bookstore app at http://localhost:8090/books. Refresh it a bunch of times in order to generate load, and wait for 1-2 mins for data to appear on SigNoz dashboard.
You can now access the SigNoz dashboard at http://localhost:3301 to monitor your app for performance metrics.
Monitor your Go application with SigNoz dashboards
With the above steps, you have instrumented your Go application with OpenTelemetry. OpenTelemetry sends the collected data to SigNoz which can be used to store it and visualize it. Let’s see how SigNoz can help you monitor your Go application.
You need to interact with your sample application a bit to generate some monitoring data. As mentioned earlier, hit the /books endpoint of the bookstore app at http://localhost:8090/books and refresh it a bunch of times in order to generate load.
You can then navigate to http://localhost:3301/application (needs signup) to see your Go app being monitored.
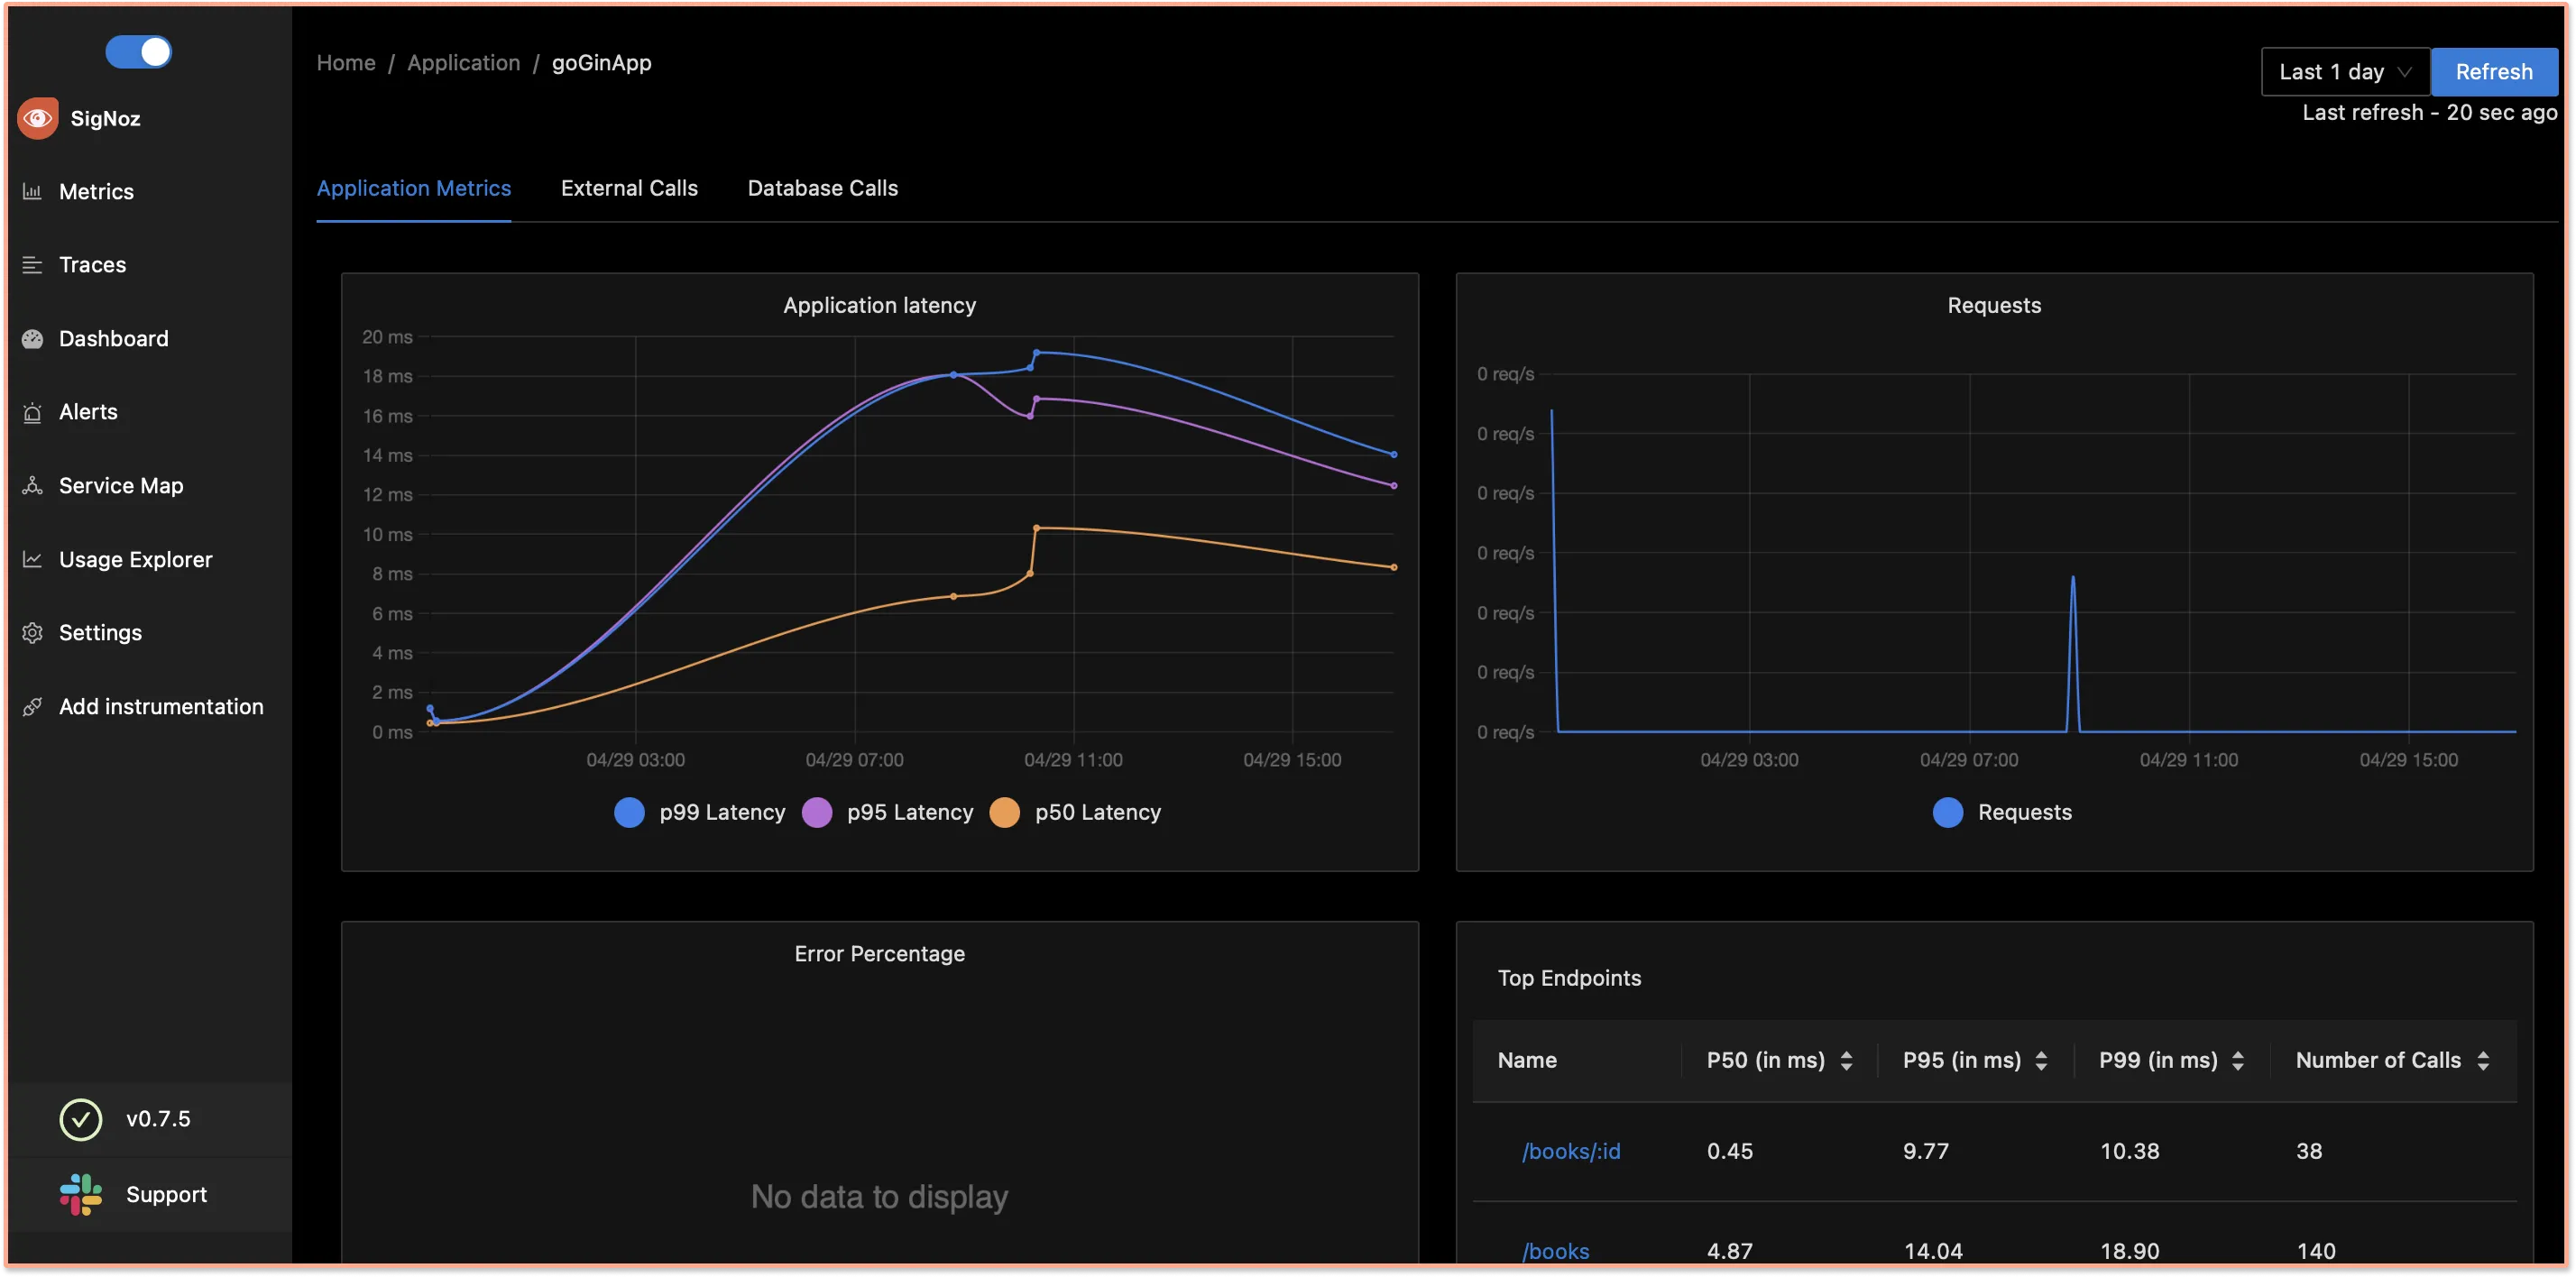
Go to Metrics→ goGinApp→ you will be able to see the dashboard.
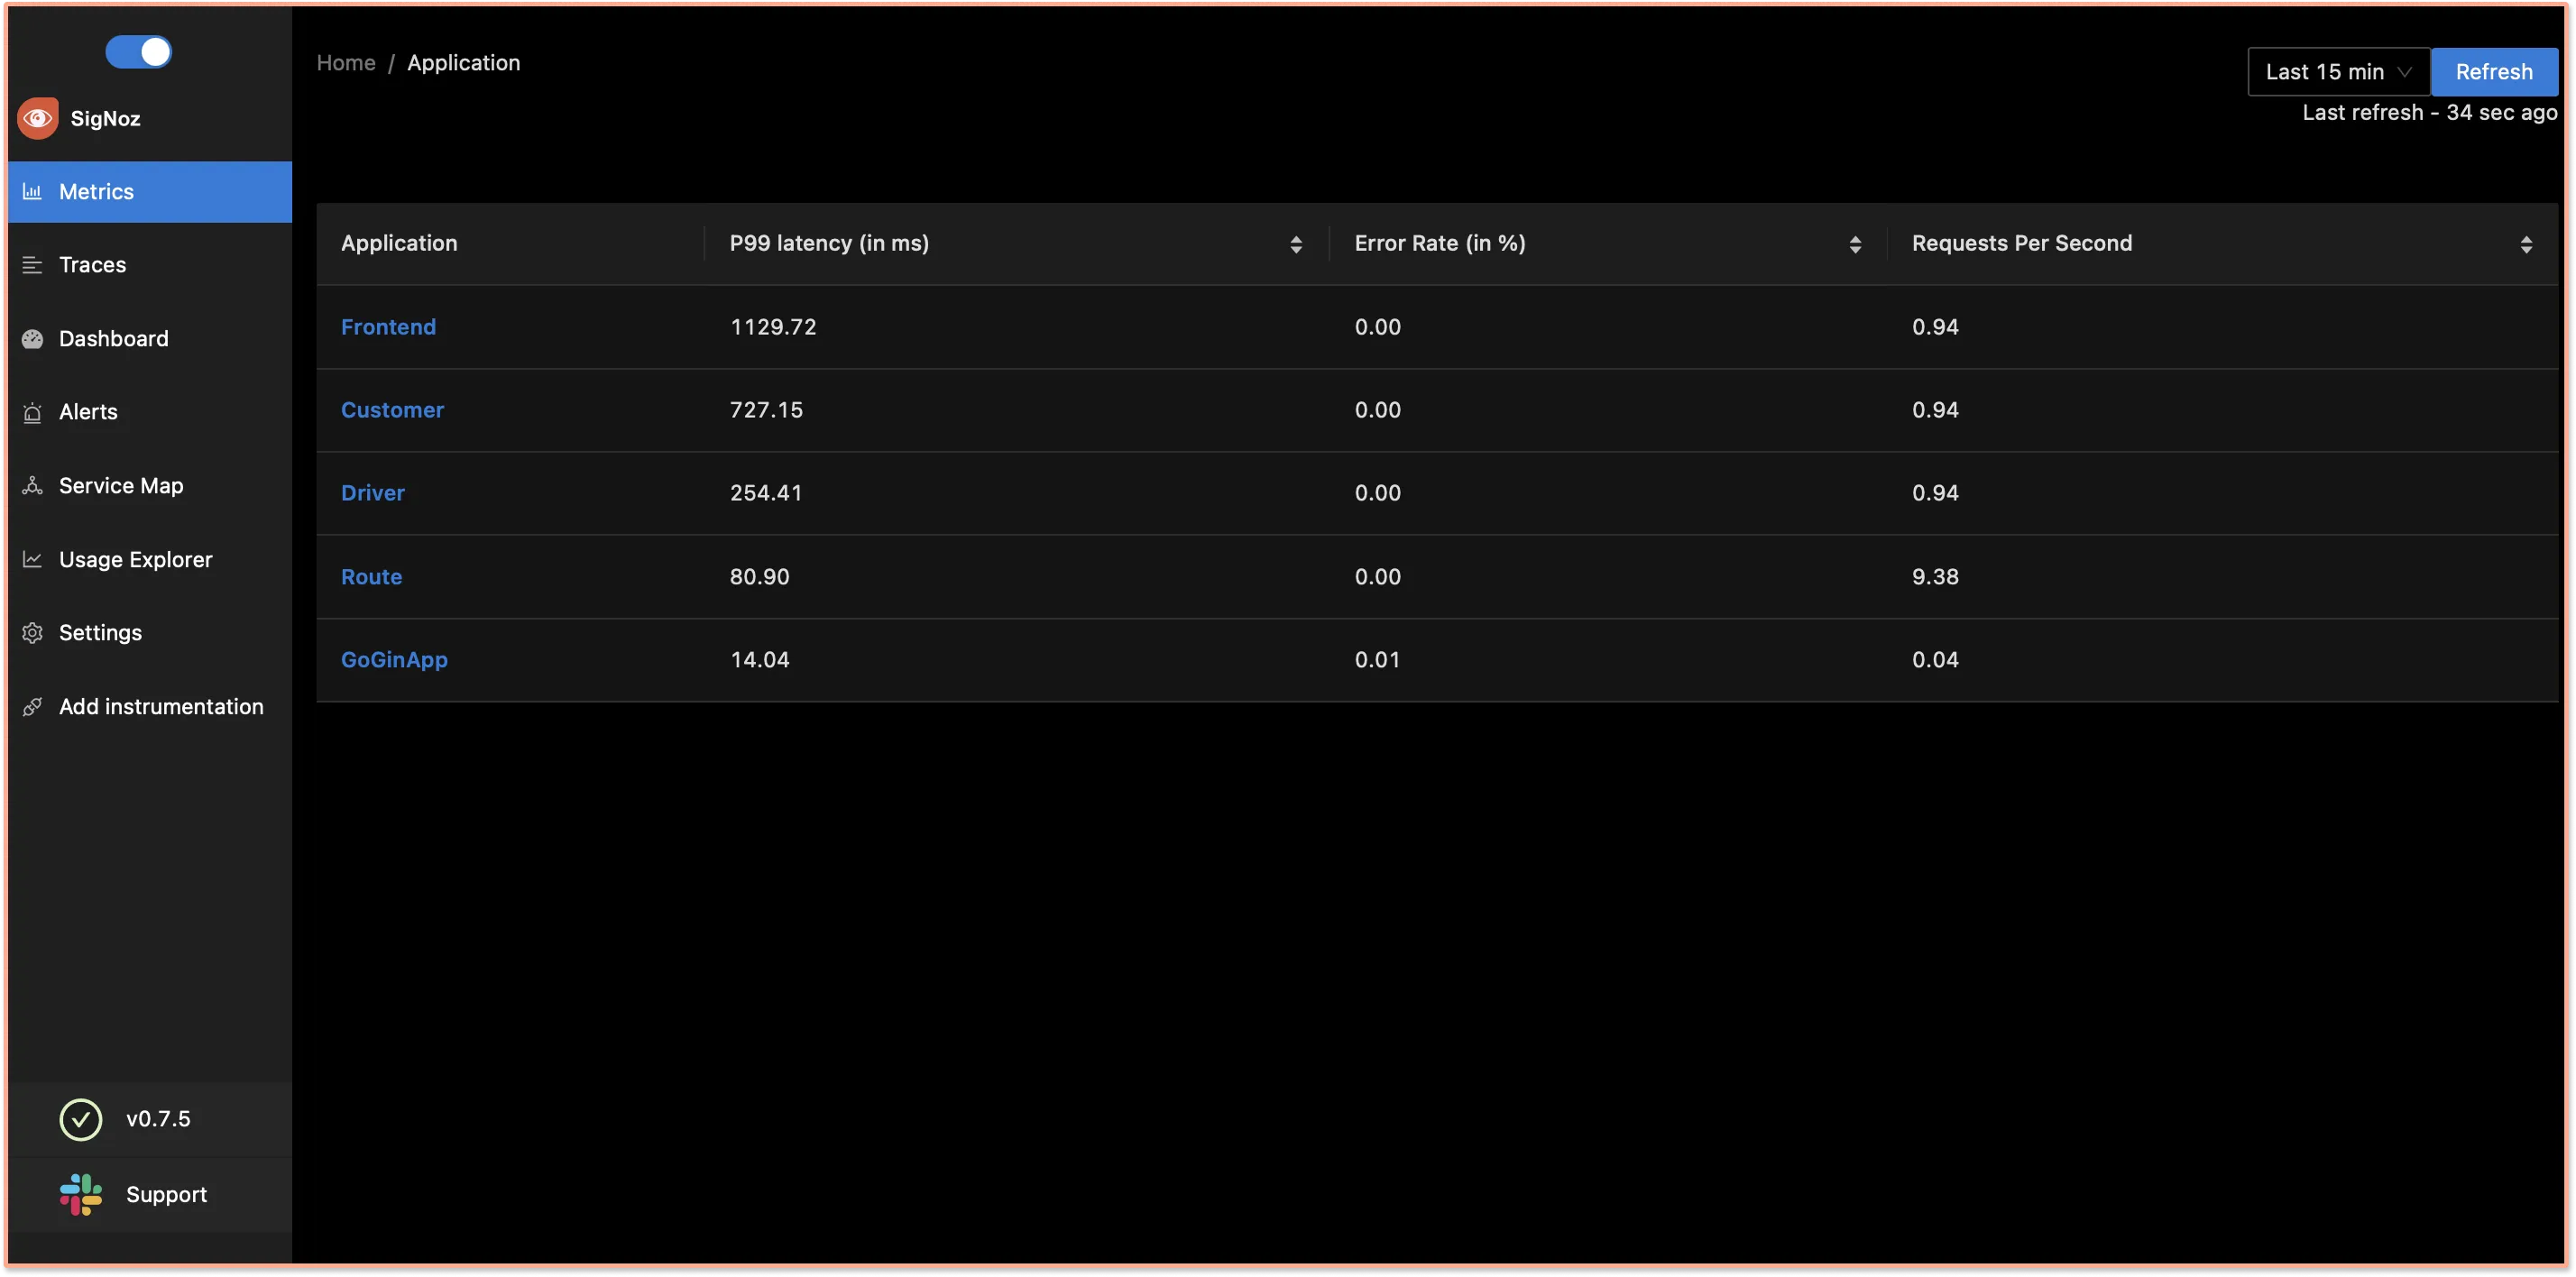
You can monitor application metrics like application latency, requests per second, error percentage, etc. with the Metrics tab of SigNoz.
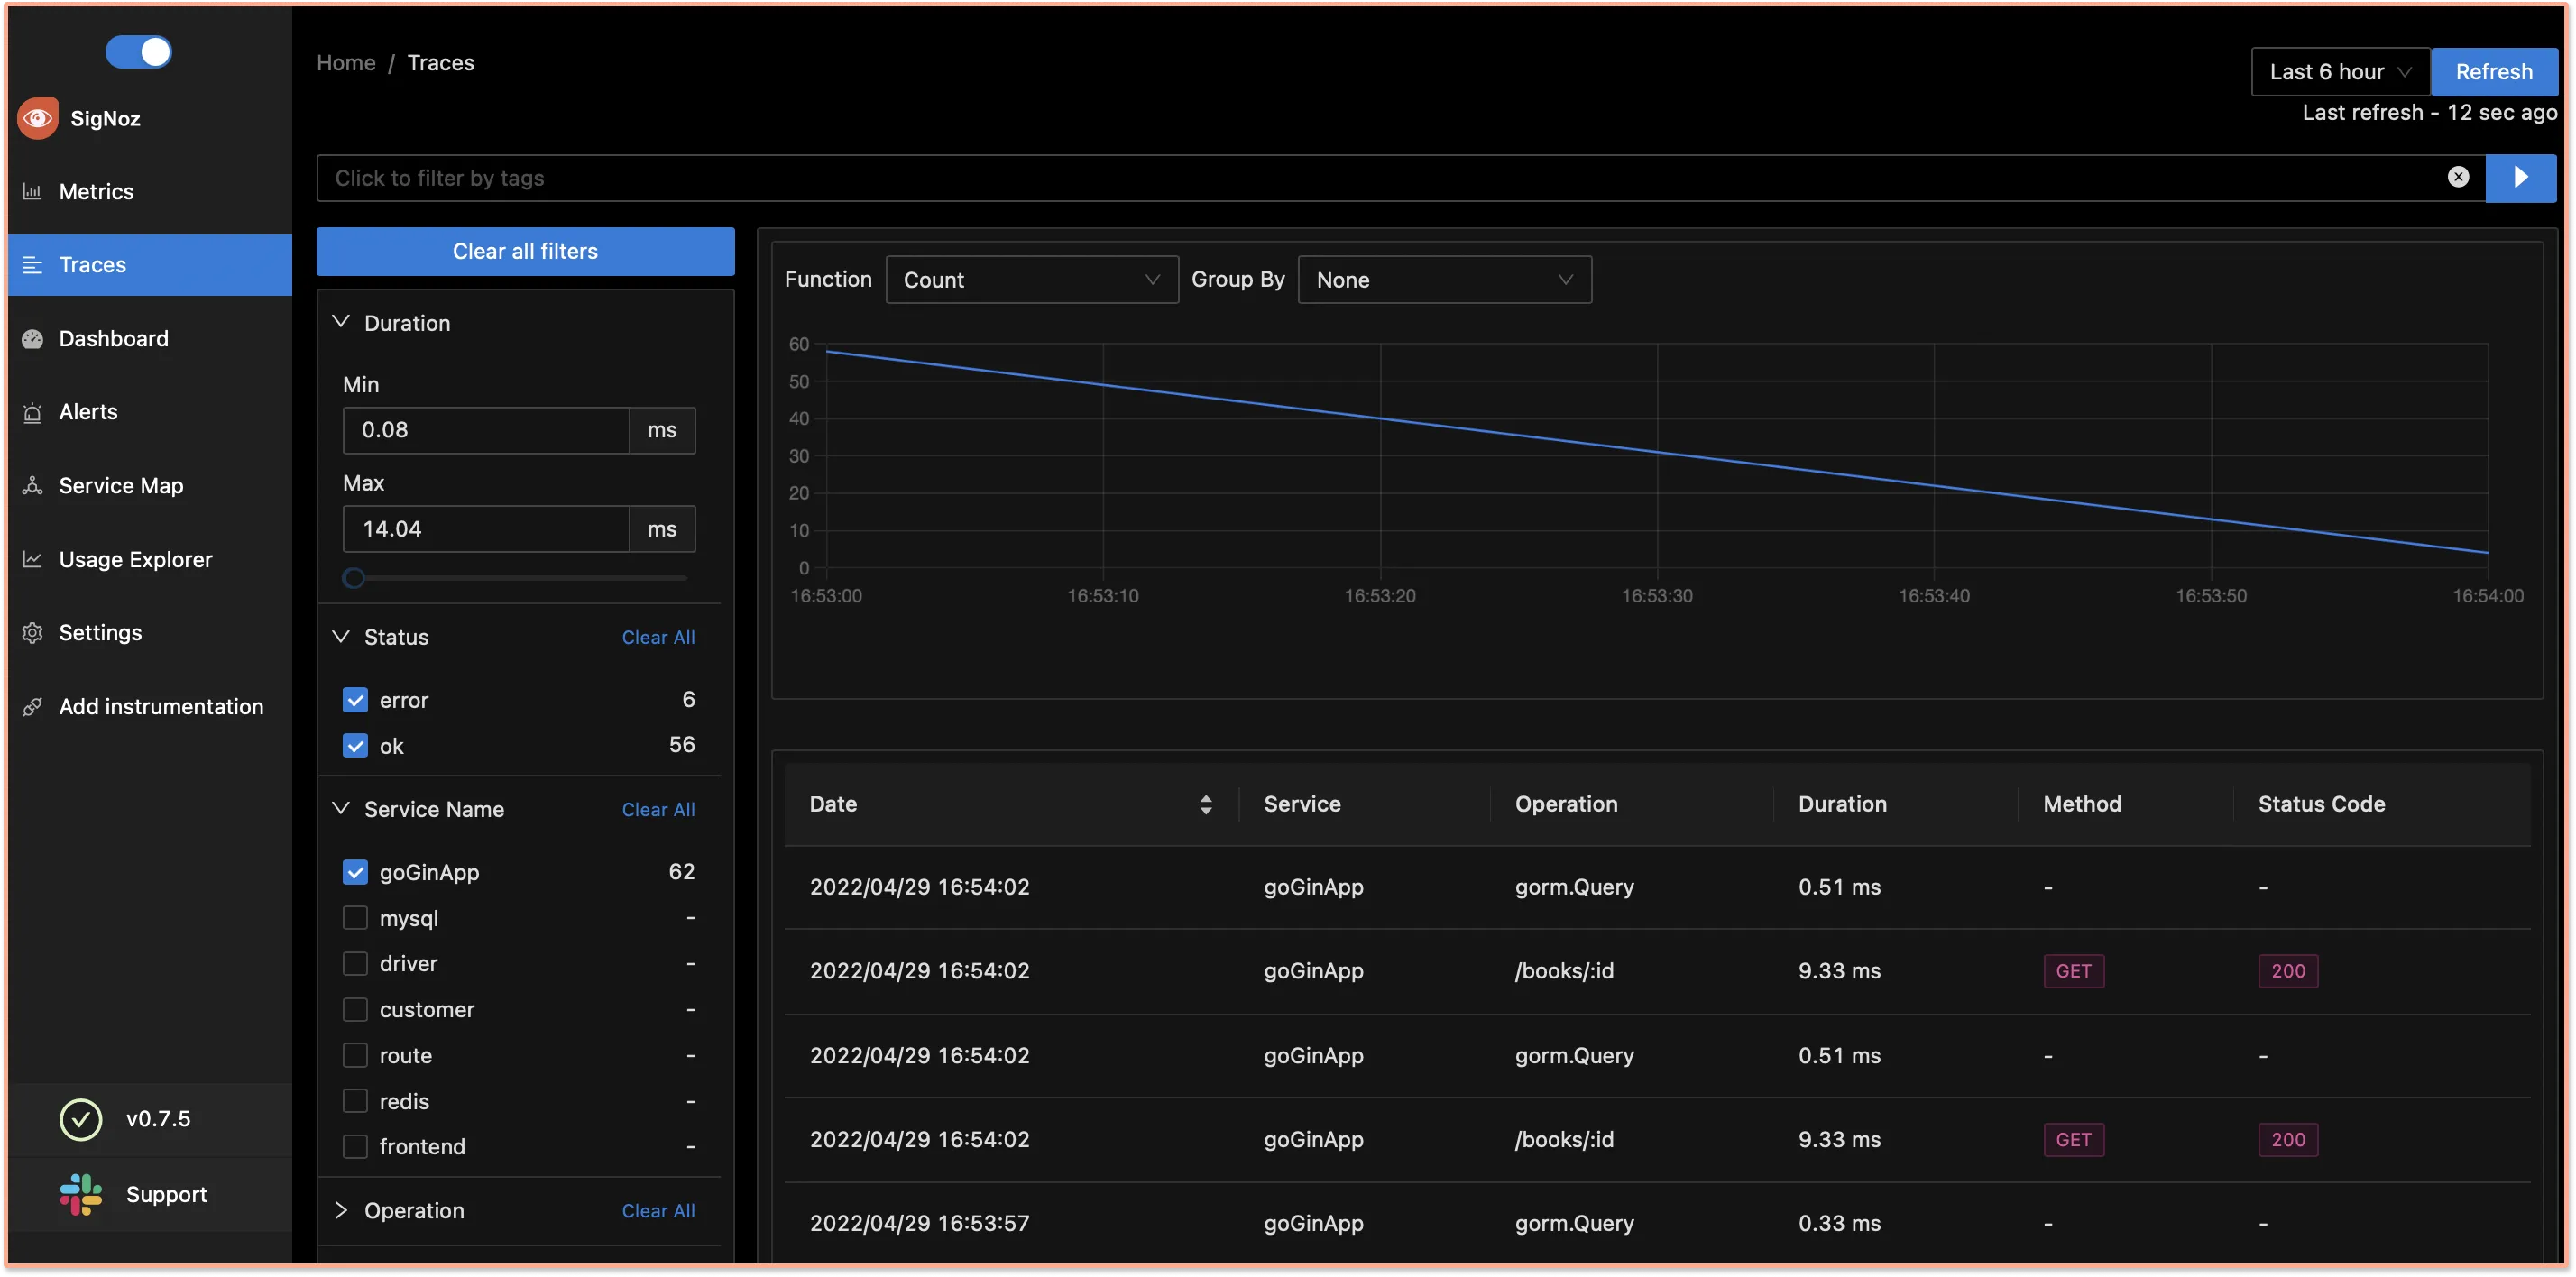
OpenTelemetry captures tracing data from your Gin application as well. Tracing data can help you visualize how user requests perform across services in a multi-service application.
In the Traces tab of SigNoz, you can analyze the tracing data using filters based on tags, status codes, service names, operations, etc.
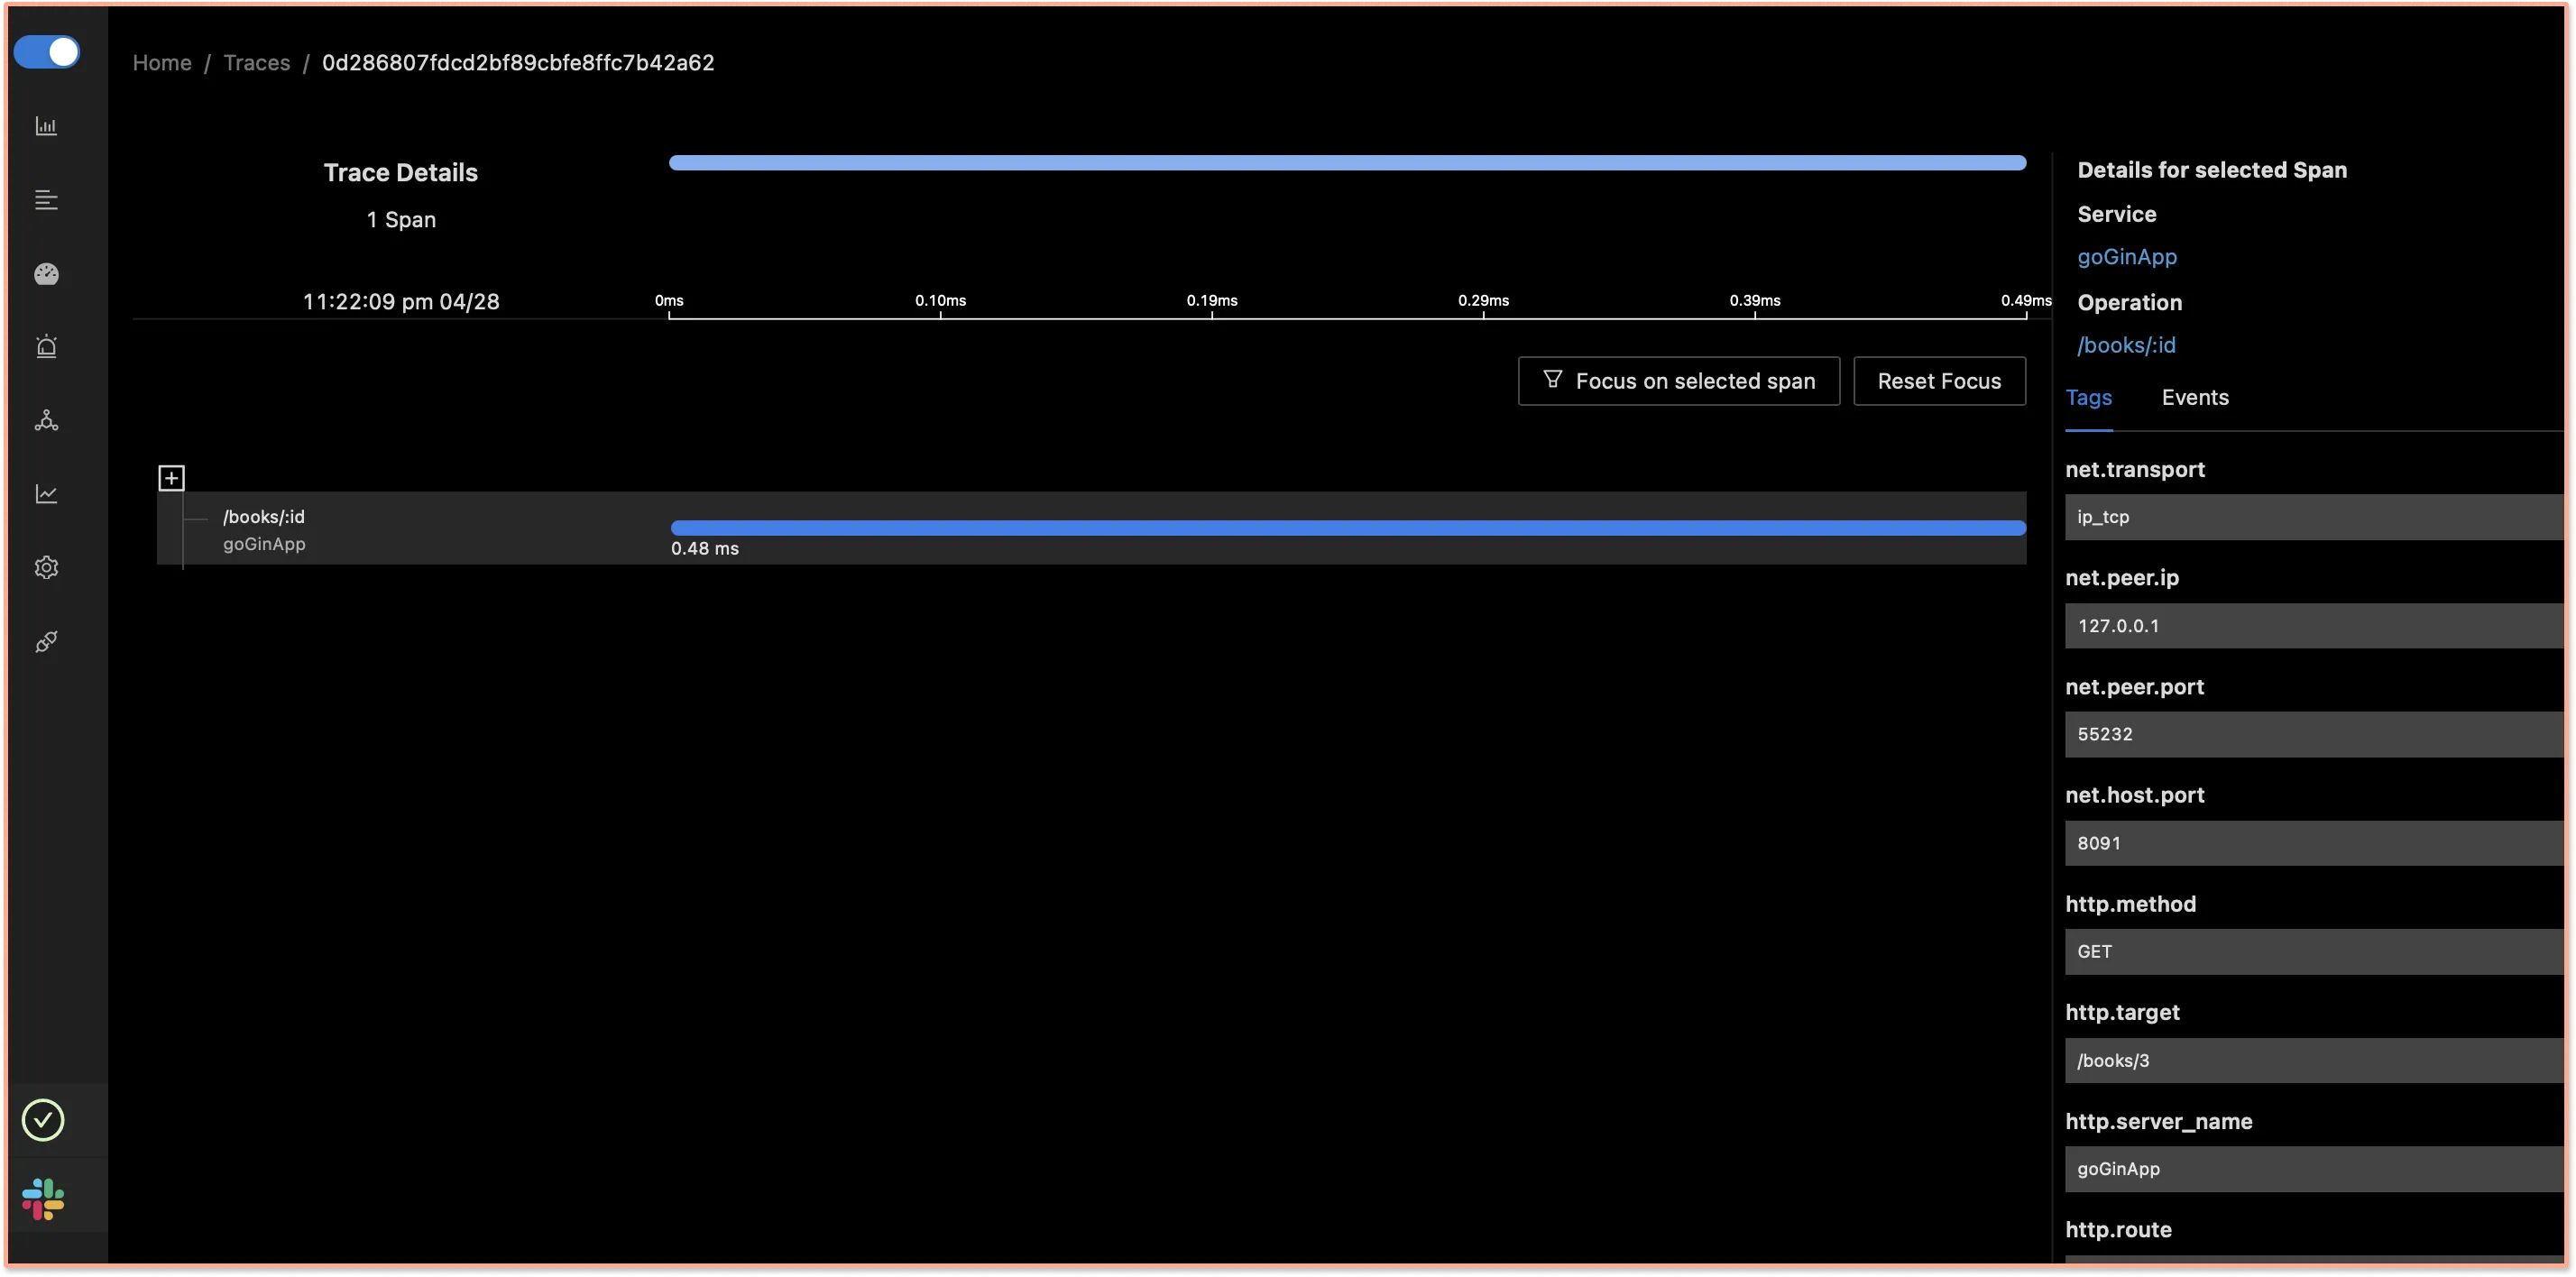
You can also visualize your tracing data with the help of flamegraphs and Gantt charts.
Conclusion
Using OpenTelemetry and SigNoz, you can set up a robust monitoring framework for your Golang application. OpenTelemetry is the future for setting up observability for cloud-native apps. It is backed by a huge community and covers a wide variety of technology and frameworks. Using OpenTelemetry, engineering teams can instrument polyglot and distributed applications with peace of mind.
You can then use SigNoz to store and visualize your telemetry data. SigNoz is an open-source observability tool that comes with a SaaS-like experience. You can try out SigNoz by visiting its GitHub repo 👇
If you are someone who understands more from video, then you can watch the our video tutorial on how to implement OpenTelemetry Golang libraries and monitor the application with SigNoz.

If you have any questions or need any help in setting things up, join our slack community and ping us in #support channel.


