Logging as a service | Log Management with Open Source Tool
Logging as a service (LAAS) is a type of cloud computing service that allows organizations to store and manage their log data in a central location. This type of service typically includes features such as centralized storage, real-time analytics, and search capabilities, as well as tools for visualizing and analyzing log data.

Logs help you debug and troubleshoot your applications. They are also useful for other purposes like auditing and compliance, performance monitoring, and security. Logs play a critical role in a developer’s workflow as well as an organization to understand and manage their systems.
What is Logging as a service?
Logging as a service enables organizations to offload the management and maintenance of their log data infrastructure to a third-party provider. This can save organizations time and resources that would otherwise be spent on building and maintaining their own log data infrastructure.
Additionally, logging as a service providers often offer additional features and tools for analyzing and visualizing log data, which can help organizations to more easily understand and make use of their log data.
Why should you use logging as a service?
There are a number of reasons why organizations may choose to use logging as a service:
Offload management and maintenance: Logging as a service allows organizations to offload the management and maintenance of their log data infrastructure to a third-party provider. This can save organizations time and resources that would otherwise be spent on building and maintaining their own log data infrastructure.
Centralized storage and management: Logging as a service providers offer centralized storage and management of log data, which can make it easier for organizations to access and analyze their log data.
Real-time analytics and search: Many logging as a service providers offer real-time analytics and search capabilities, which can be useful for identifying and addressing issues in real-time.
Visualization and analysis tools: Logging as a service providers often offer additional tools for visualizing and analyzing log data, which can help organizations to more easily understand and make use of their log data.
Scalability: Logging as a service providers can scale to meet the needs of organizations of different sizes and with different volumes of log data.
Overall, logging as a service can be a useful option for organizations that want to offload the management and maintenance of their log data infrastructure, and that want access to additional tools and features for analyzing and visualizing log data.
Things to consider before choosing a LAAS tool
There are many things to consider before you choose a tool that provides logging as a service.
Compatibility with your systems
It's important to choose a tool that is compatible with the systems and technologies you use. This might include compatibility with specific operating systems, programming languages, or application frameworks.Scalability
Consider the size and complexity of your organization's log data, as well as any anticipated growth. Choose a tool that is able to handle the volume of log data you expect to generate, and that can scale as your needs change.Ease of use
Look for a tool that is intuitive and easy to use, especially if you have a team of people who will be using it. This can help to ensure that the tool is adopted and used effectively.Integration with other tools
If you use other tools for monitoring, alerting, or visualization, it can be useful to choose a log management tool that integrates with those tools. This can help to streamline your workflows and make it easier to access and analyze your log data.Cost
Consider the cost of the tool, as well as any additional costs for features or support. Make sure that the tool fits within your budget and meets your needs.Support
Look for a tool that offers good documentation and support in case you run into any issues or have questions.
Overall, it's important to choose a log management tool that is a good fit for your organization's needs and budget.
SigNoz - an open source APM that provides Log Management
SigNoz is full-stack open source Application Performance Monitoring tool that you can use for monitoring logs, metrics, and traces. Having all the important telemetry signals under a single dashboard leads to less operational overhead. Users can also access telemetry data with richer context by correlating these signals.
Let us look at some of the key features of SigNoz as a log analytics tool.
Uses resource-efficient columnar database
SigNoz uses a columnar database - ClickHouse, for storing logs efficiently. Big companies like Uber and Cloudflare have shifted from Elasticsearch to ClickHouse for storing their log data.
An OpenTelemetry native APM
SigNoz is built to support OpenTelemetry natively. OpenTelemetry is quietly becoming the world standard for instrumenting cloud-native applications. OpenTelemetry provides a vendor-agnostic instrumentation layer for all important telemetry signals, including logs, metrics, and traces.
OpenTelemetry logs support legacy logging libraries while aiming to integrate logs more strongly with other telemetry signals.
Out-of-box intuitive UI for Logs management
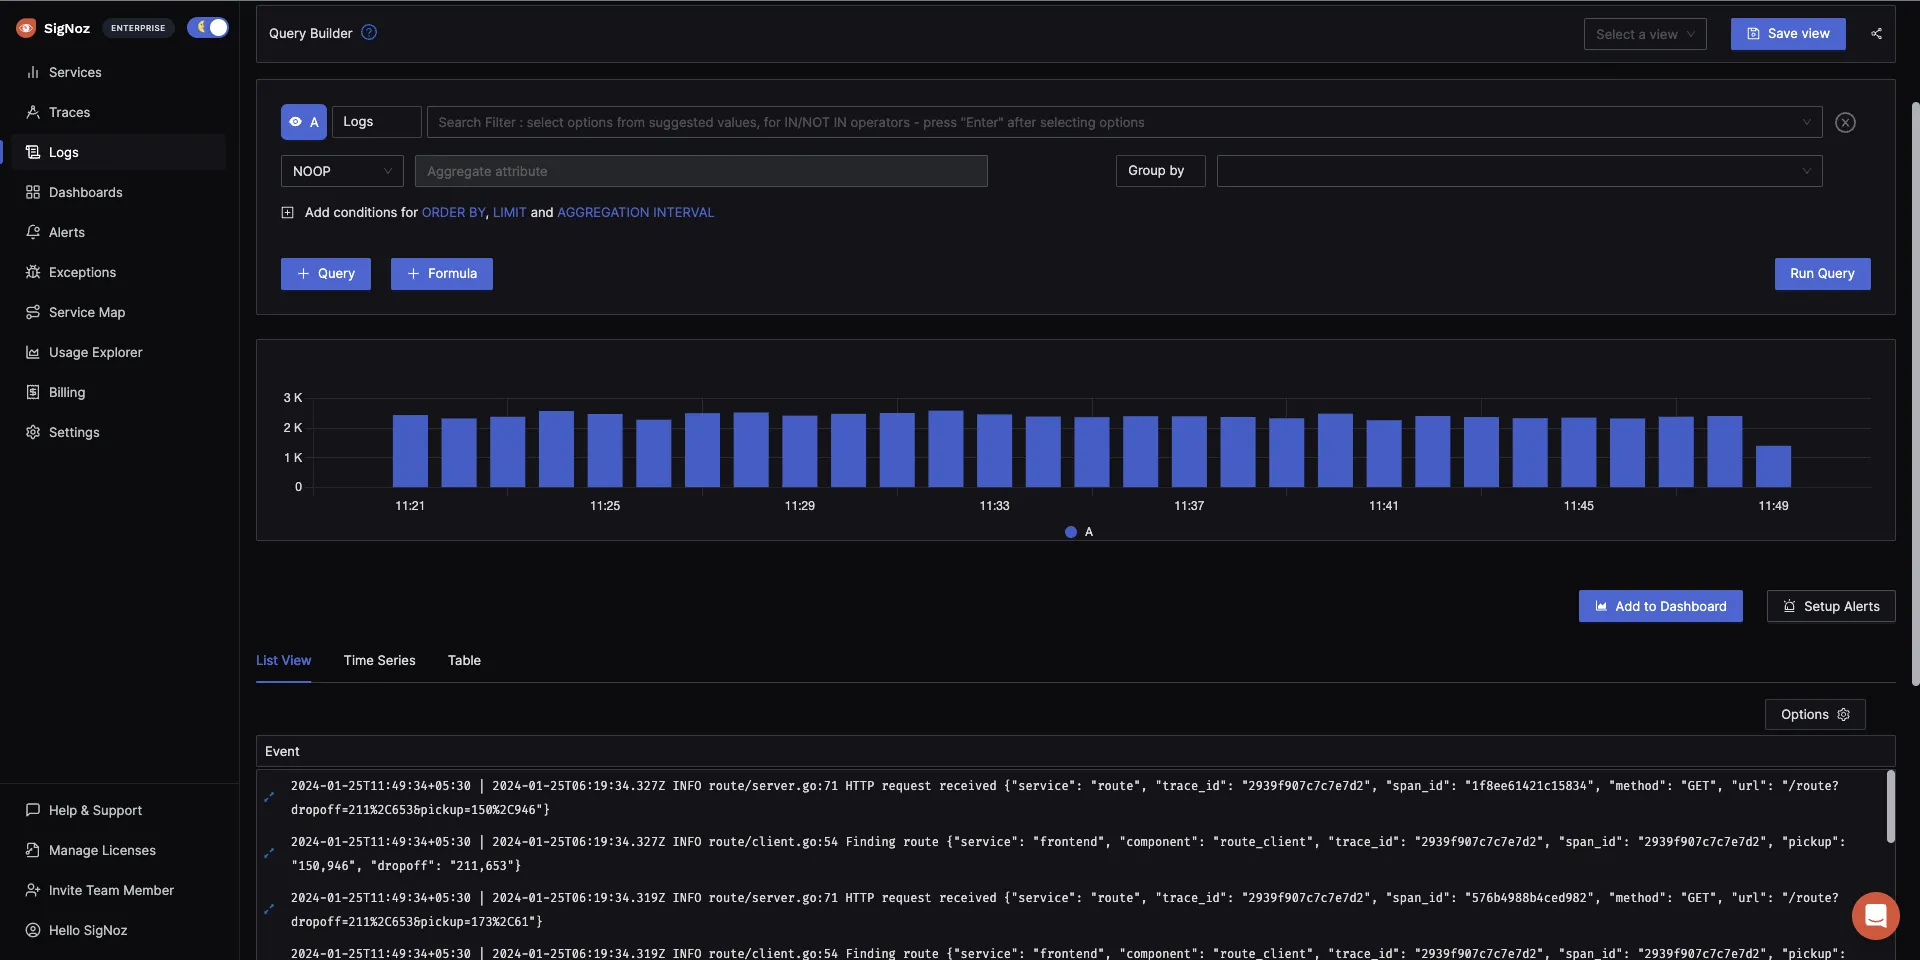
SigNoz provides an intuitive UI to see your logs data with the ability to see logs volume, logs data, and important fields at a glance.

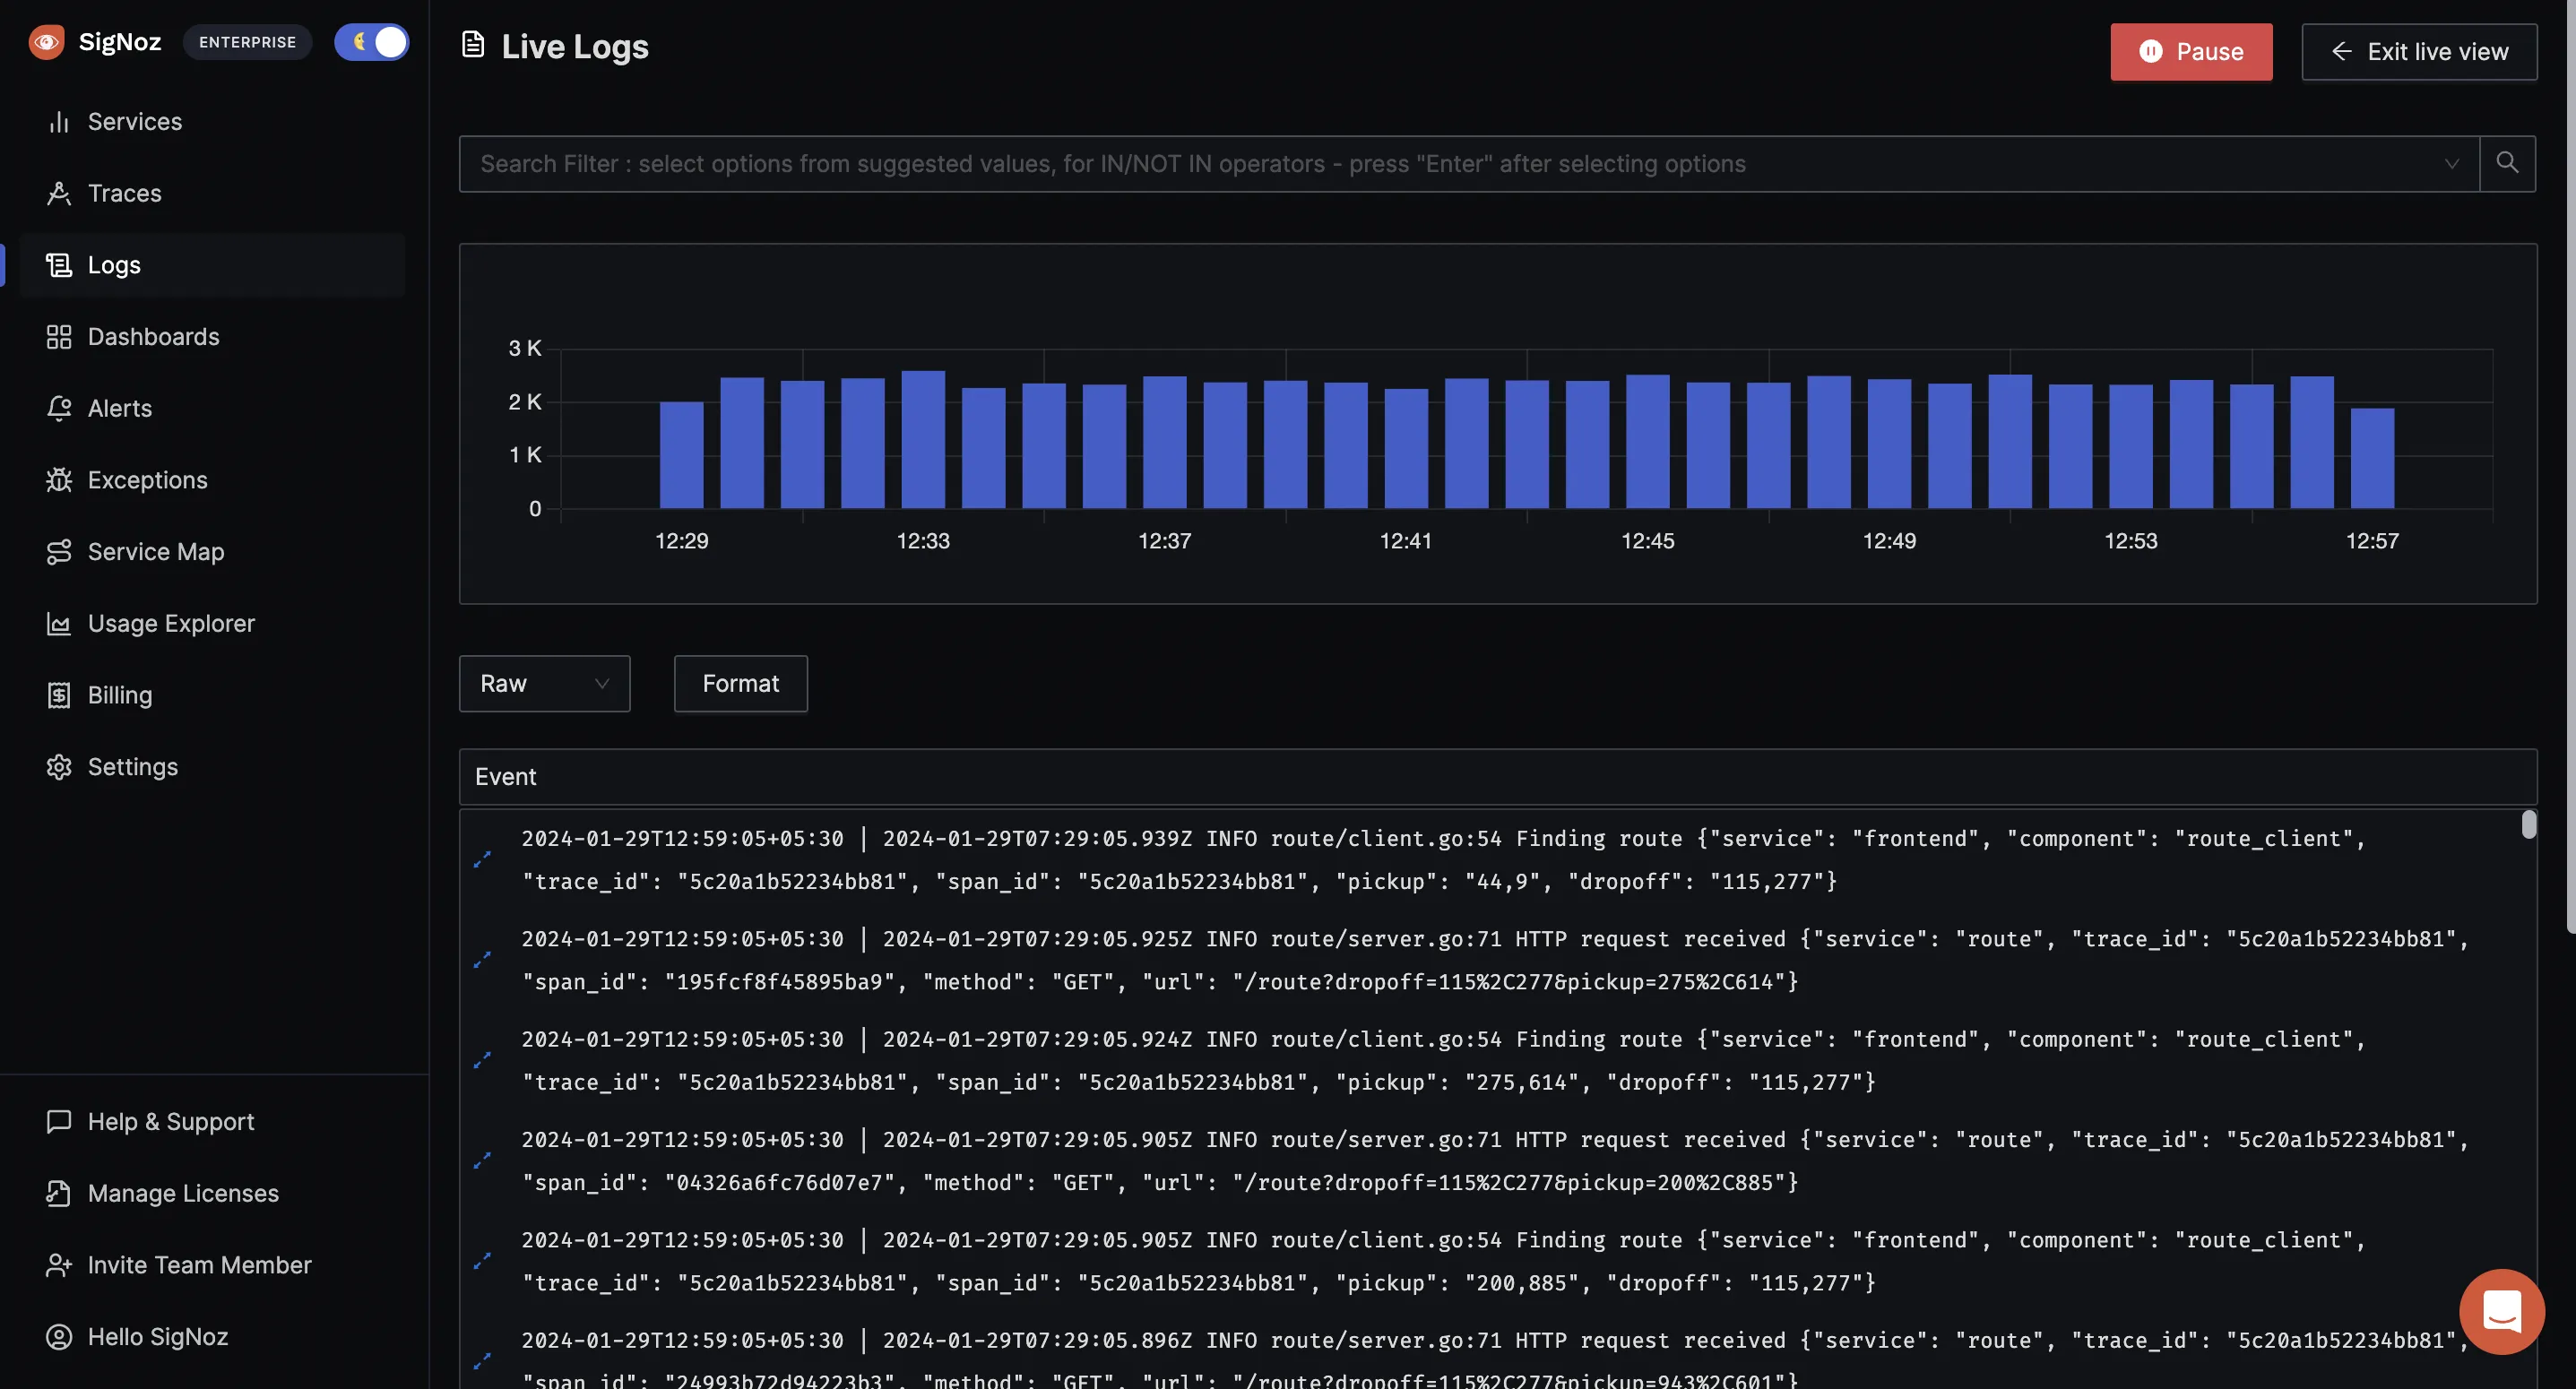
Live Tail Logging
You can also view logs in real-time with live tail logging.

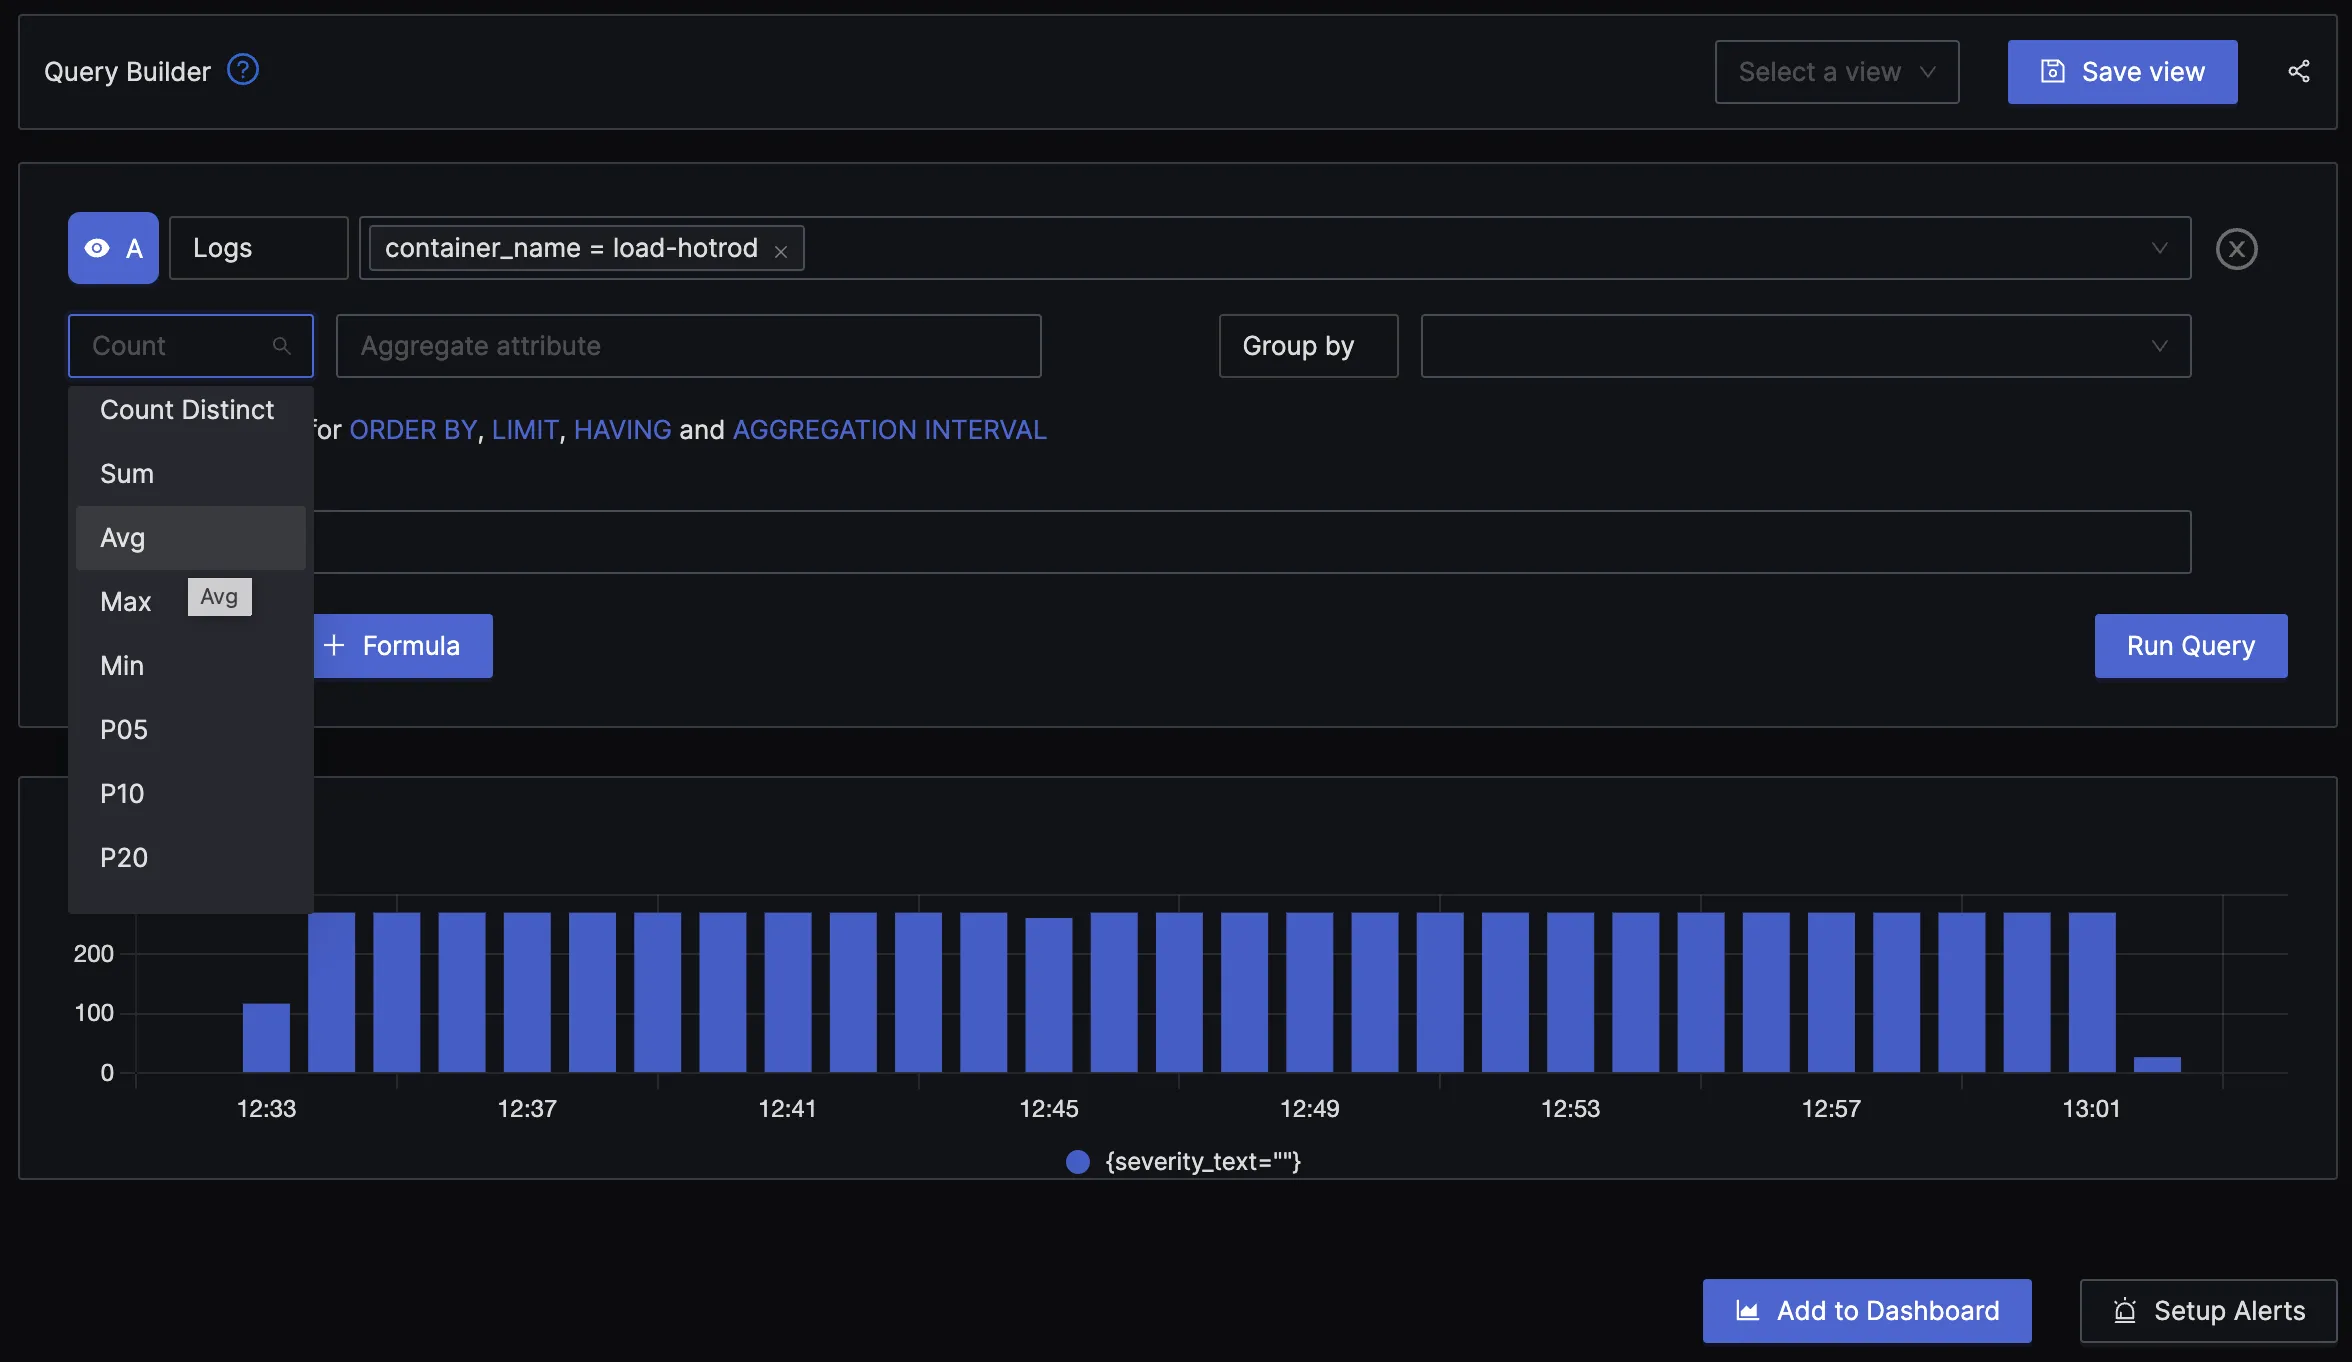
Advanced Logs Query Builder
Log data is often vast, and developers need to check and see the logs they are interested in quickly. With an advanced Log Query Builder, you can filter out logs quickly with a mix-and-match of fields.

Correlating Logs with other Observability signals
As SigNoz uses OpenTelemetry to collect and parse logs, you can use it to correlate logs with other observability signals like traces and metrics. Correlating logs with other observability signals can enrich your logs data and help debug applications faster.
Seamless transition from your existing logging pipelines
Shifting your logs pipeline to SigNoz is easy and simple. If you are using FluentBit, FluentD, or Logstash to collect logs, you can easily shift your logs pipeline to SigNoz. Check out the instructions here.
Getting started with SigNoz
You can get started with SigNoz using just three commands at your terminal.
git clone -b main https://github.com/SigNoz/signoz.git
cd signoz/deploy/
./install.sh
For detailed instructions, you can visit our documentation.
If you liked what you read, then check out our GitHub repo 👇
Our slack community is a great place to get your queries solved instantly and get community support for SigNoz. Link to join 👇
SigNoz slack community
Related Content
OpenTelemetry Logs - A Complete Introduction & Implementation
An Open Source OpenTelemetry APM


