What is a log shipper - Top 7 Log Shippers that you can use
Centralizing logs (arranging all records in one place) is often challenging as we need to decide whether to use a log shipper or directly log from the application.
If you are not familiar with a log shipper, logging directly from the library might be a suitable option for development (it is easy to configure). However, in production, you'll likely want to use one of the available log shippers, mainly due to buffers, since blocking the application or dropping data (immediately) may not be an option.

In this article, you will see what log shippers are, why you should use them, and a list of top log shippers that you can use.
What is a Log Shipper?
Log shippers are tools used for collecting and sending logs to a final destination. They send logs (or log files) easily and reliably from a file-based data source to a supported output destination.
You will either write your logs to a file or a socket. Log shippers are responsible for transporting raw logs to log management tools.
Why do we need a Log Shipper?
There are some reasons to use log shippers.
- Reliability: A log shipper is more robust to network problems or slowdowns since most of them have buffers of some kind. Log shippers usually matter whether it retains data in memory or tracks a file and remembers where it left off.
- Flexibility: You can always switch to a log shipper that better fits your use case.
- Enriching: The log shipper can process additional data, such as pulling hostnames or tagging IPs with the location.
- Performance: A log shipper can process data and send it to log management tools in bulk.
- Fanout: Log shippers make it easy to send logs to multiple destinations.
Top 7 Log Shippers that you can consider
Below is the list of the top log shippers:
- Fluentd
- Filebeat
- Rsyslog
- Syslog (UDP)
- Logstash
- Elastic Beats
- OpenTelemetry Collector
Let’s discuss them one by one.
Fluentd
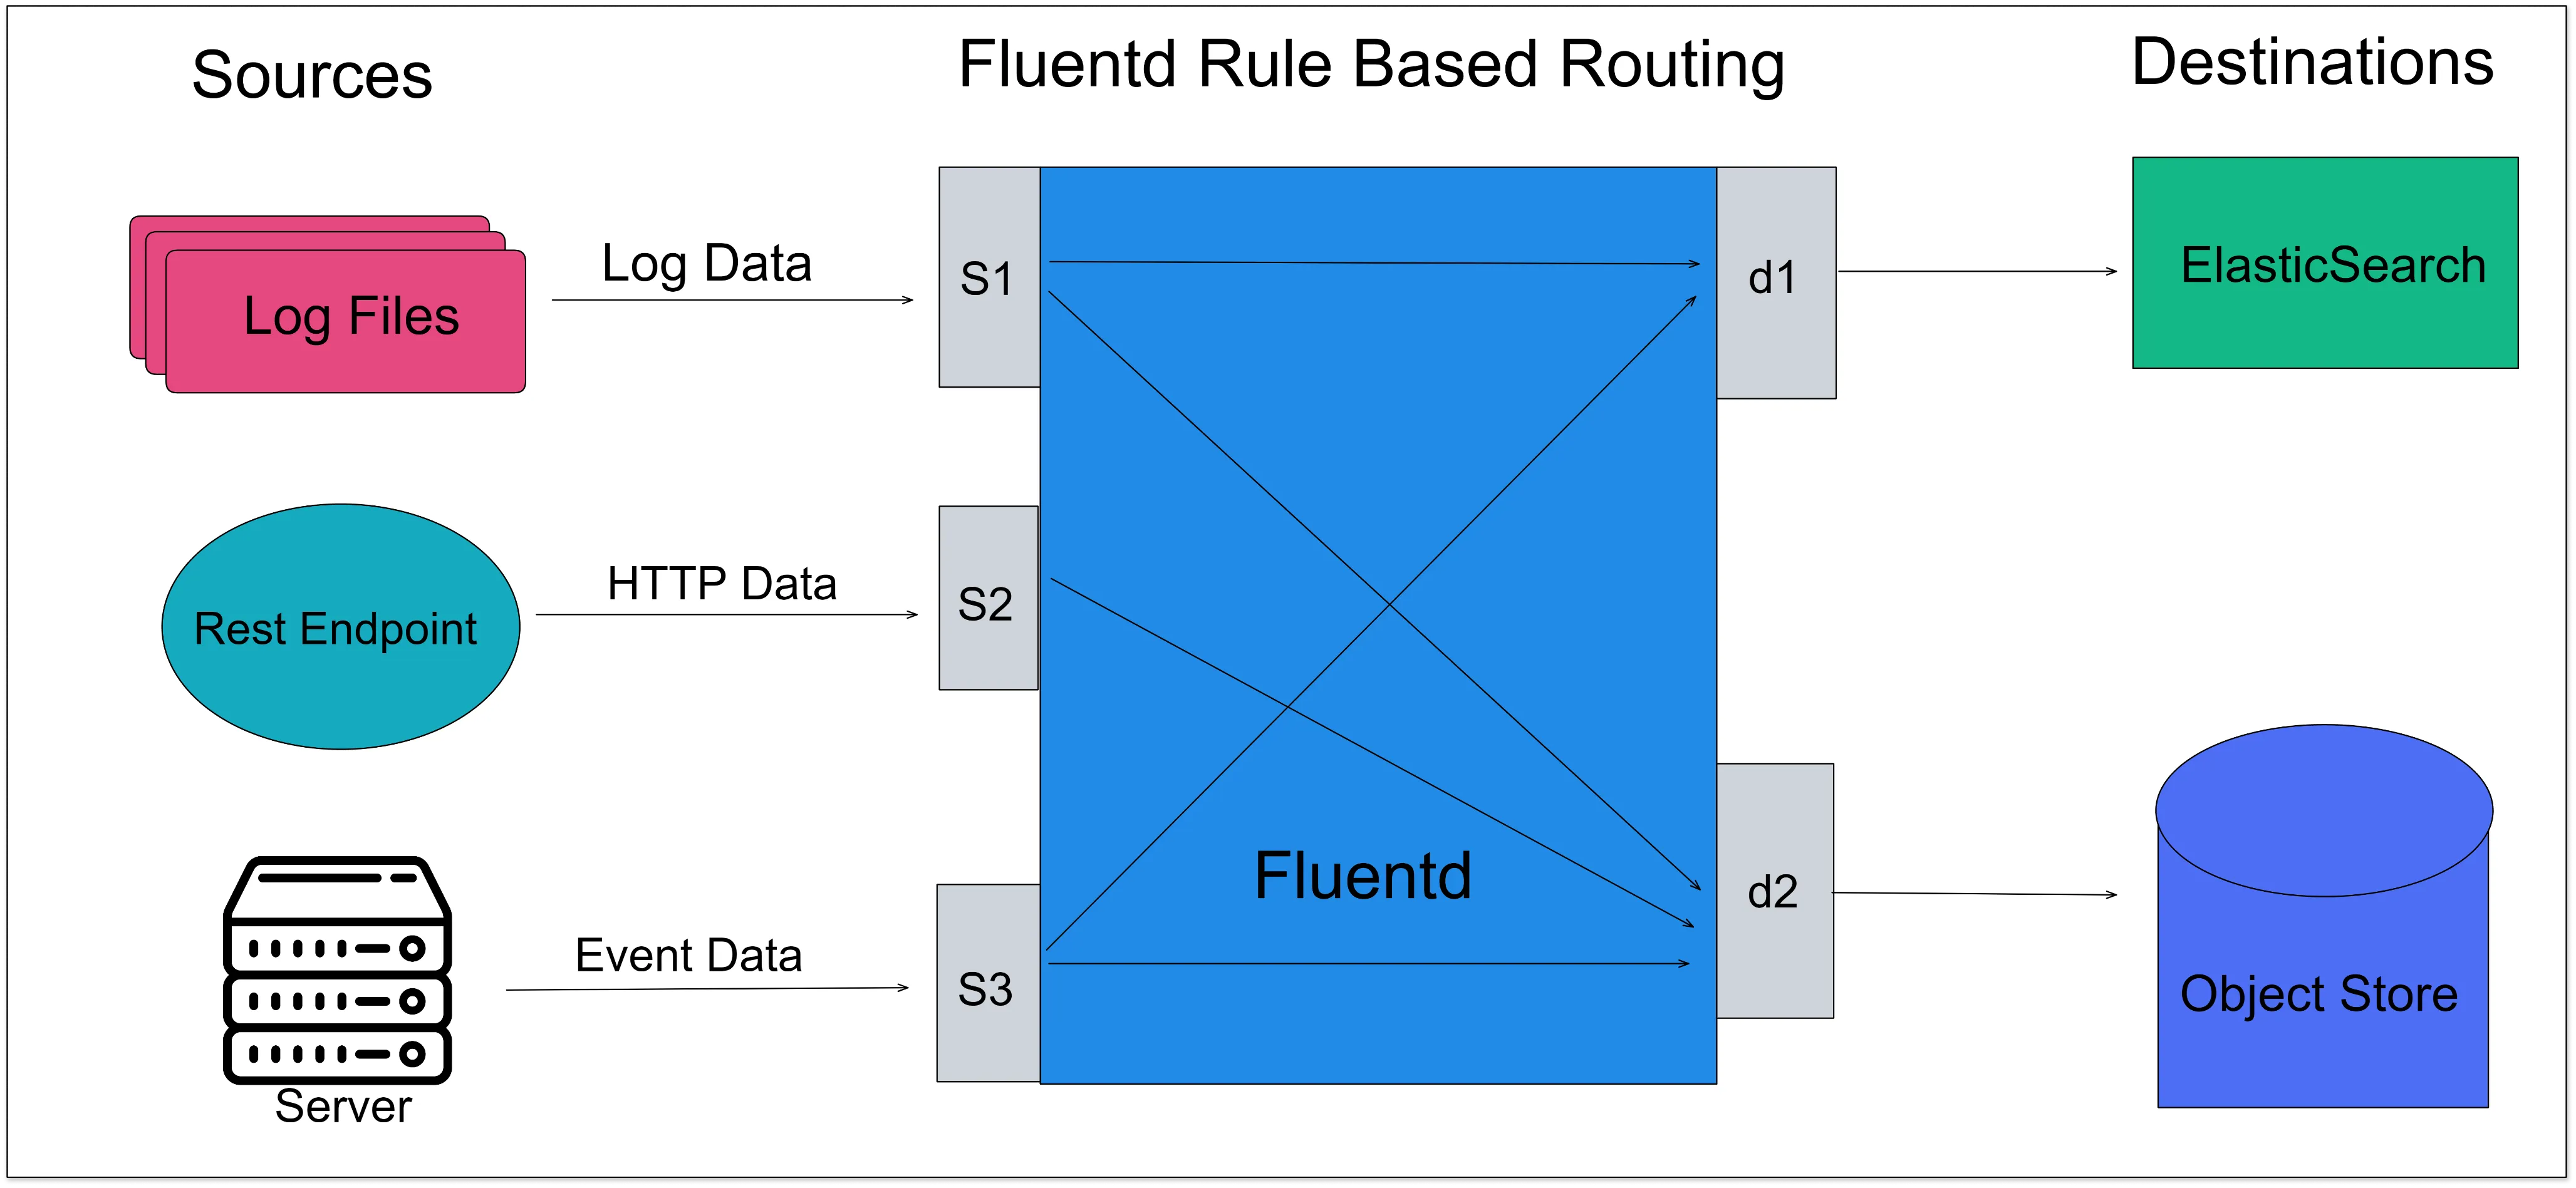
Fluentd is an open-source unified log collector which means it collects logs from various sources like system logs, app logs, etc., and unifies them into one `logging layer`. It allows you to ship log data to various systems such as SigNoz, Elasticsearch, Hadoop, AWS, etc.With Fluentd, you can collect all the data, regardless of where it came from. It transforms them into a unified format all in one place so that you can use the data again for compliance or debugging, etc. Fluentd does this reliably, which means if there is a network outage or data spikes, this shouldn’t mess up data collection.
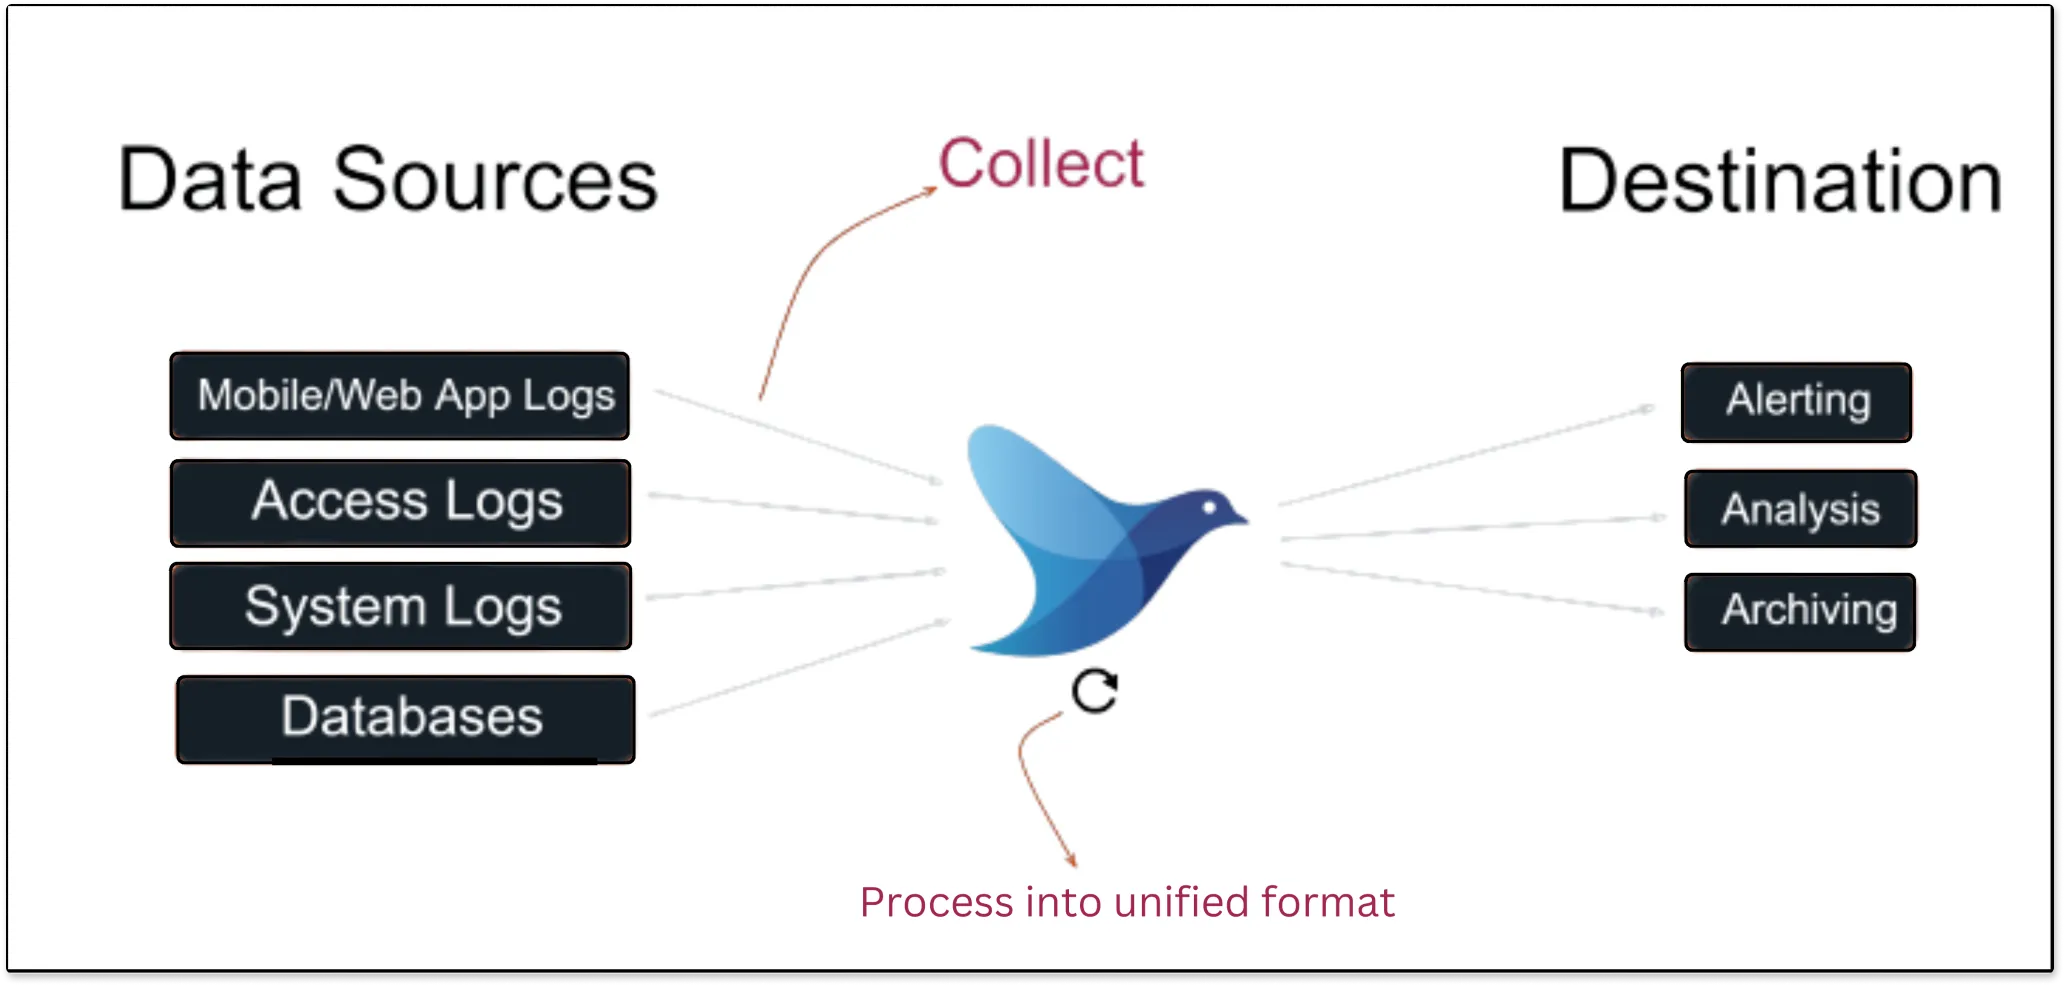
Fluentd scrapes all logs from a given source, converts them to a structured data format, and then forwards them to services, such as SigNoz, Elasticsearch, etc.
Filebeat
Filebeat is a lightweight tool that is designed for forwarding and storing log data. It is part of the ELK stack and belongs to a group of lightweight log shippers used in the ELK stack for collecting logs.Once the logs are collected, it can ship them directly to Elasticsearch or Logstash if it needs more processing.
Filebeat runs as a binary because it is written in the Go language, so no runtime library is needed, and it is easy to deploy across many architectures.
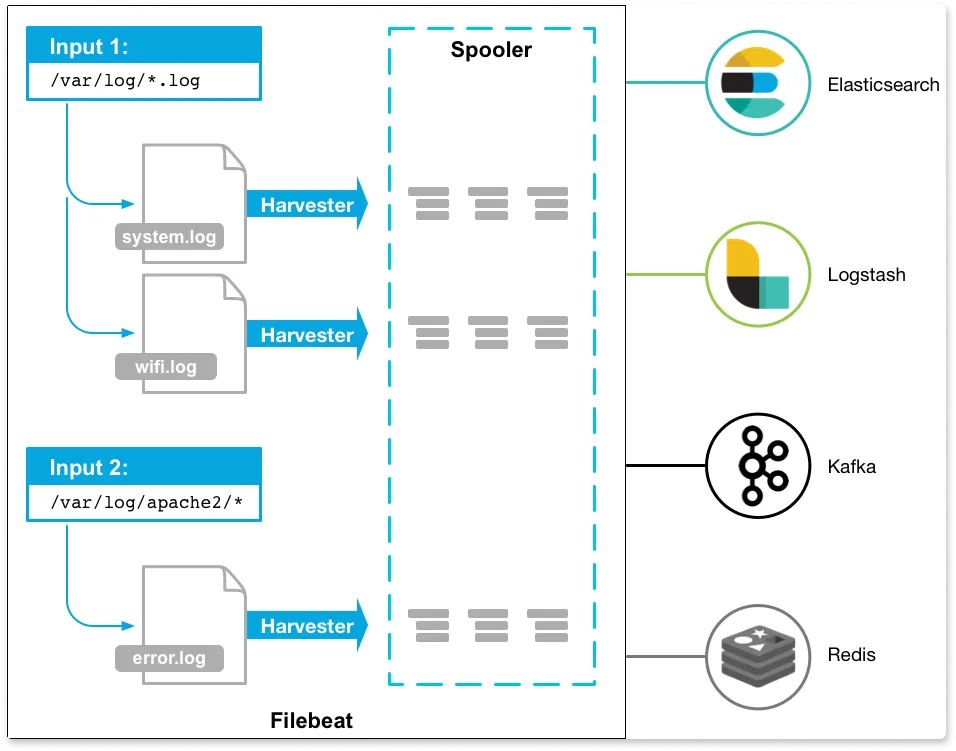
Filebeat has two components:
- Harvester: It is responsible for reading the content (line-by-line) of a file. Each file needs a harvester for its content to be read.
- Input: Inputs are responsible for finding all data sources to read from and operating the harvester.
The below diagram is the architecture of Filebeat.
Rsyslog
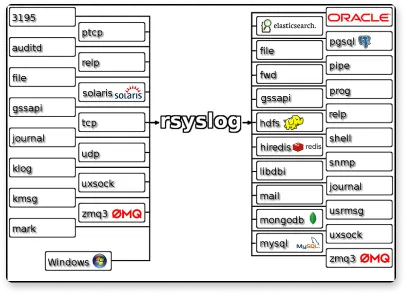
RSYSLOG is a rocket-fast system for log processing. It’s an open-source software that forwards log messages over IP networks. It takes input from many sources and outputs it to many destinations.RSYSLOG has a modular design, offers excellent security, and provides high performance. It is capable of sending over one million messages per second to a local destination when limited processing is used.
Syslog
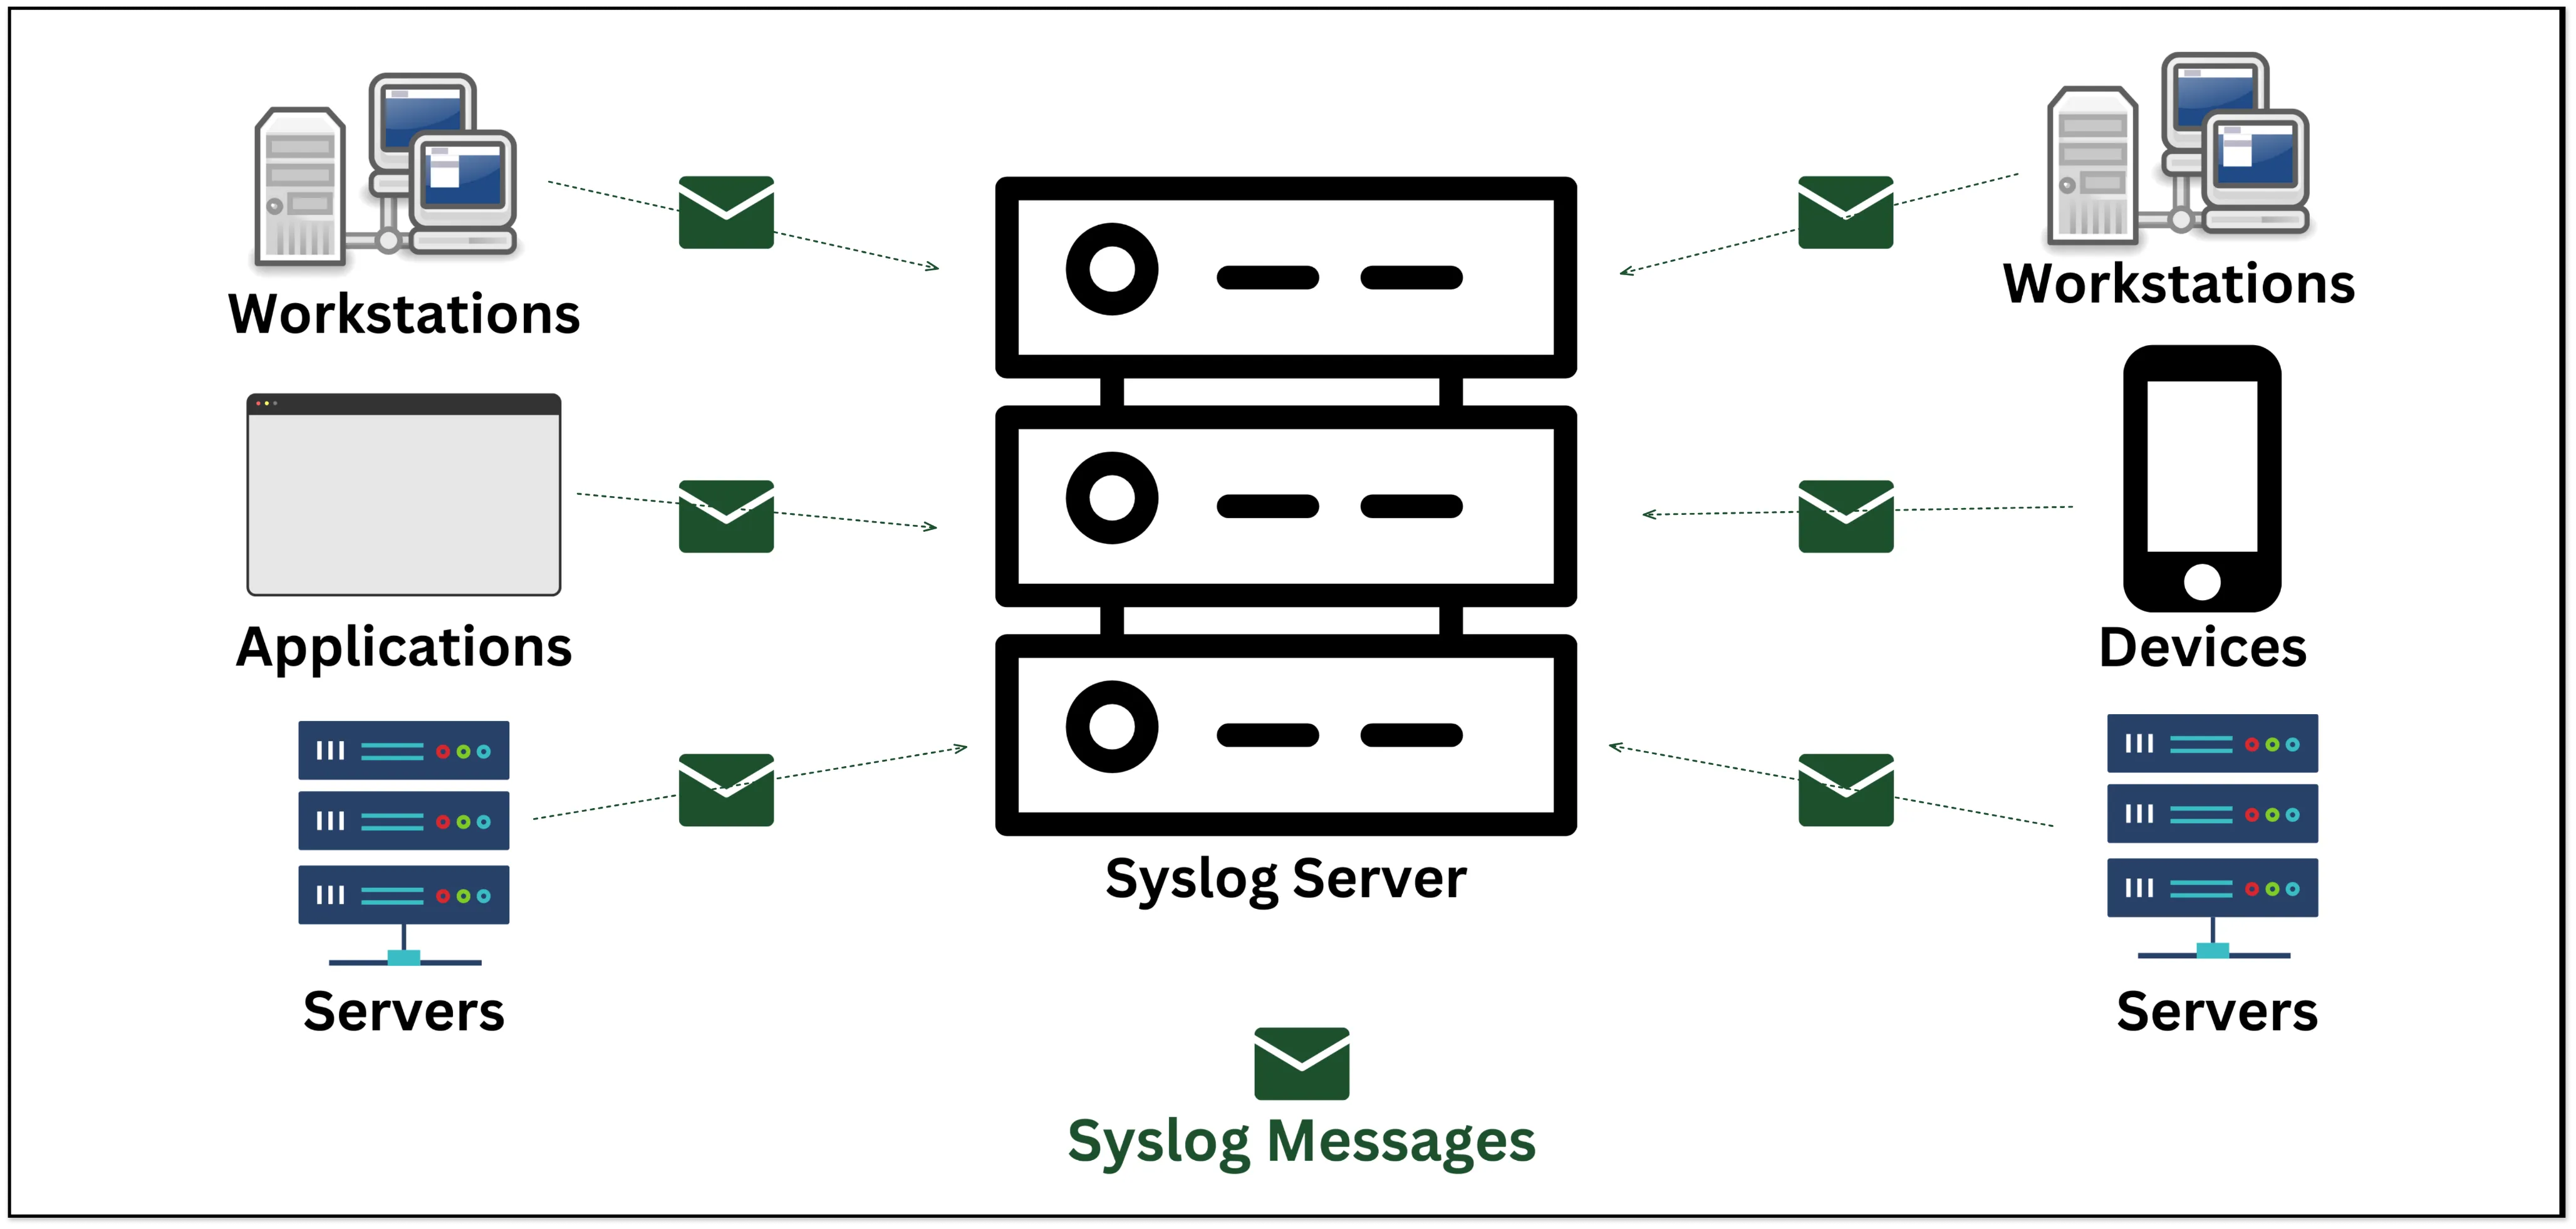
SYSLOG (System Logging Protocol) allows Linux/Unix/Windows systems and devices (such as routers, switches, etc.) to deliver log and event information to a central log/event message collector, which is called a Syslog server.
The Syslog server allows all of its network devices to send their log information to one centralized place. The log message will be sent on UDP port 514 to the Syslog server. Syslog servers are also known as collectors or receivers.
Syslog is capable of generating a large number of messages, and it forwards these messages as quickly as they are generated. A Syslog server is capable of filtering and responding to Syslog messages.
One of the disadvantages of the Syslog protocol is that it does not provide any form of security mechanism, and there is no built-in mechanism for identifying incoming messages.
Logstash
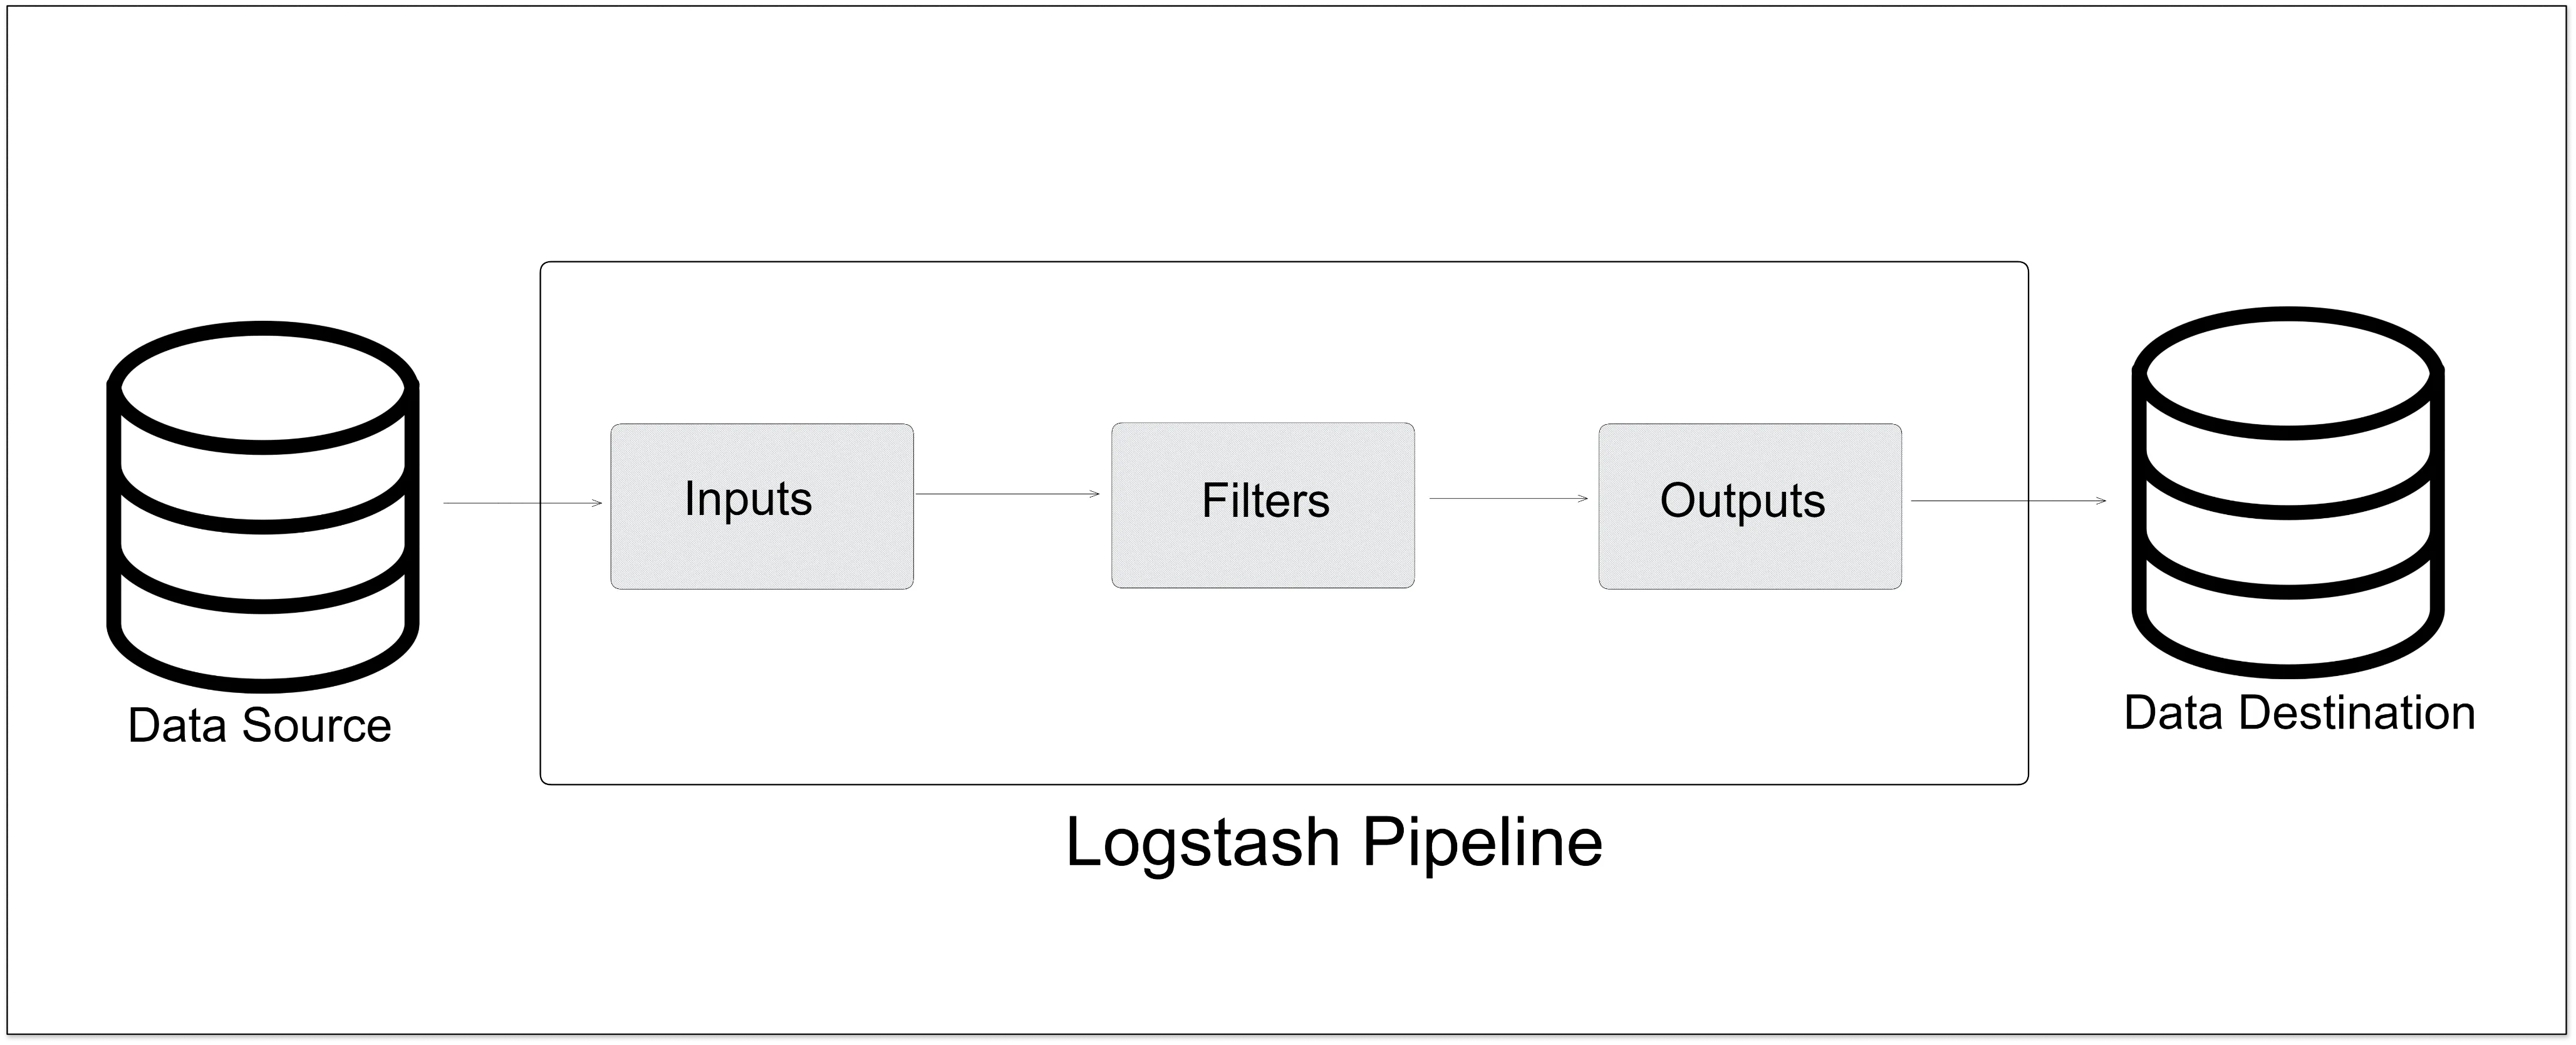
Logstash is an open-source tool that collects, parses, and stores log information. This tool is part of the `ELK stack` (Elasticsearch, Logstash, Kibana). It allows the centralization and standardization of log data, making it easier to search and analyze large amounts of information.Logstash includes more than 200 plugins, and you can also write your own very easily. As Logstash requires a Java Virtual Machine (JVM) to run, this ultimately led to significant memory consumption.
How does Logstash work?
- It collects data from a variety of sources, such as log files, databases, and streaming data.
- It processes and transforms the data, using filters to parse and structure the data as needed.
- The data is then output to a storage destination, such as Elasticsearch or a file.
Elasticbeat
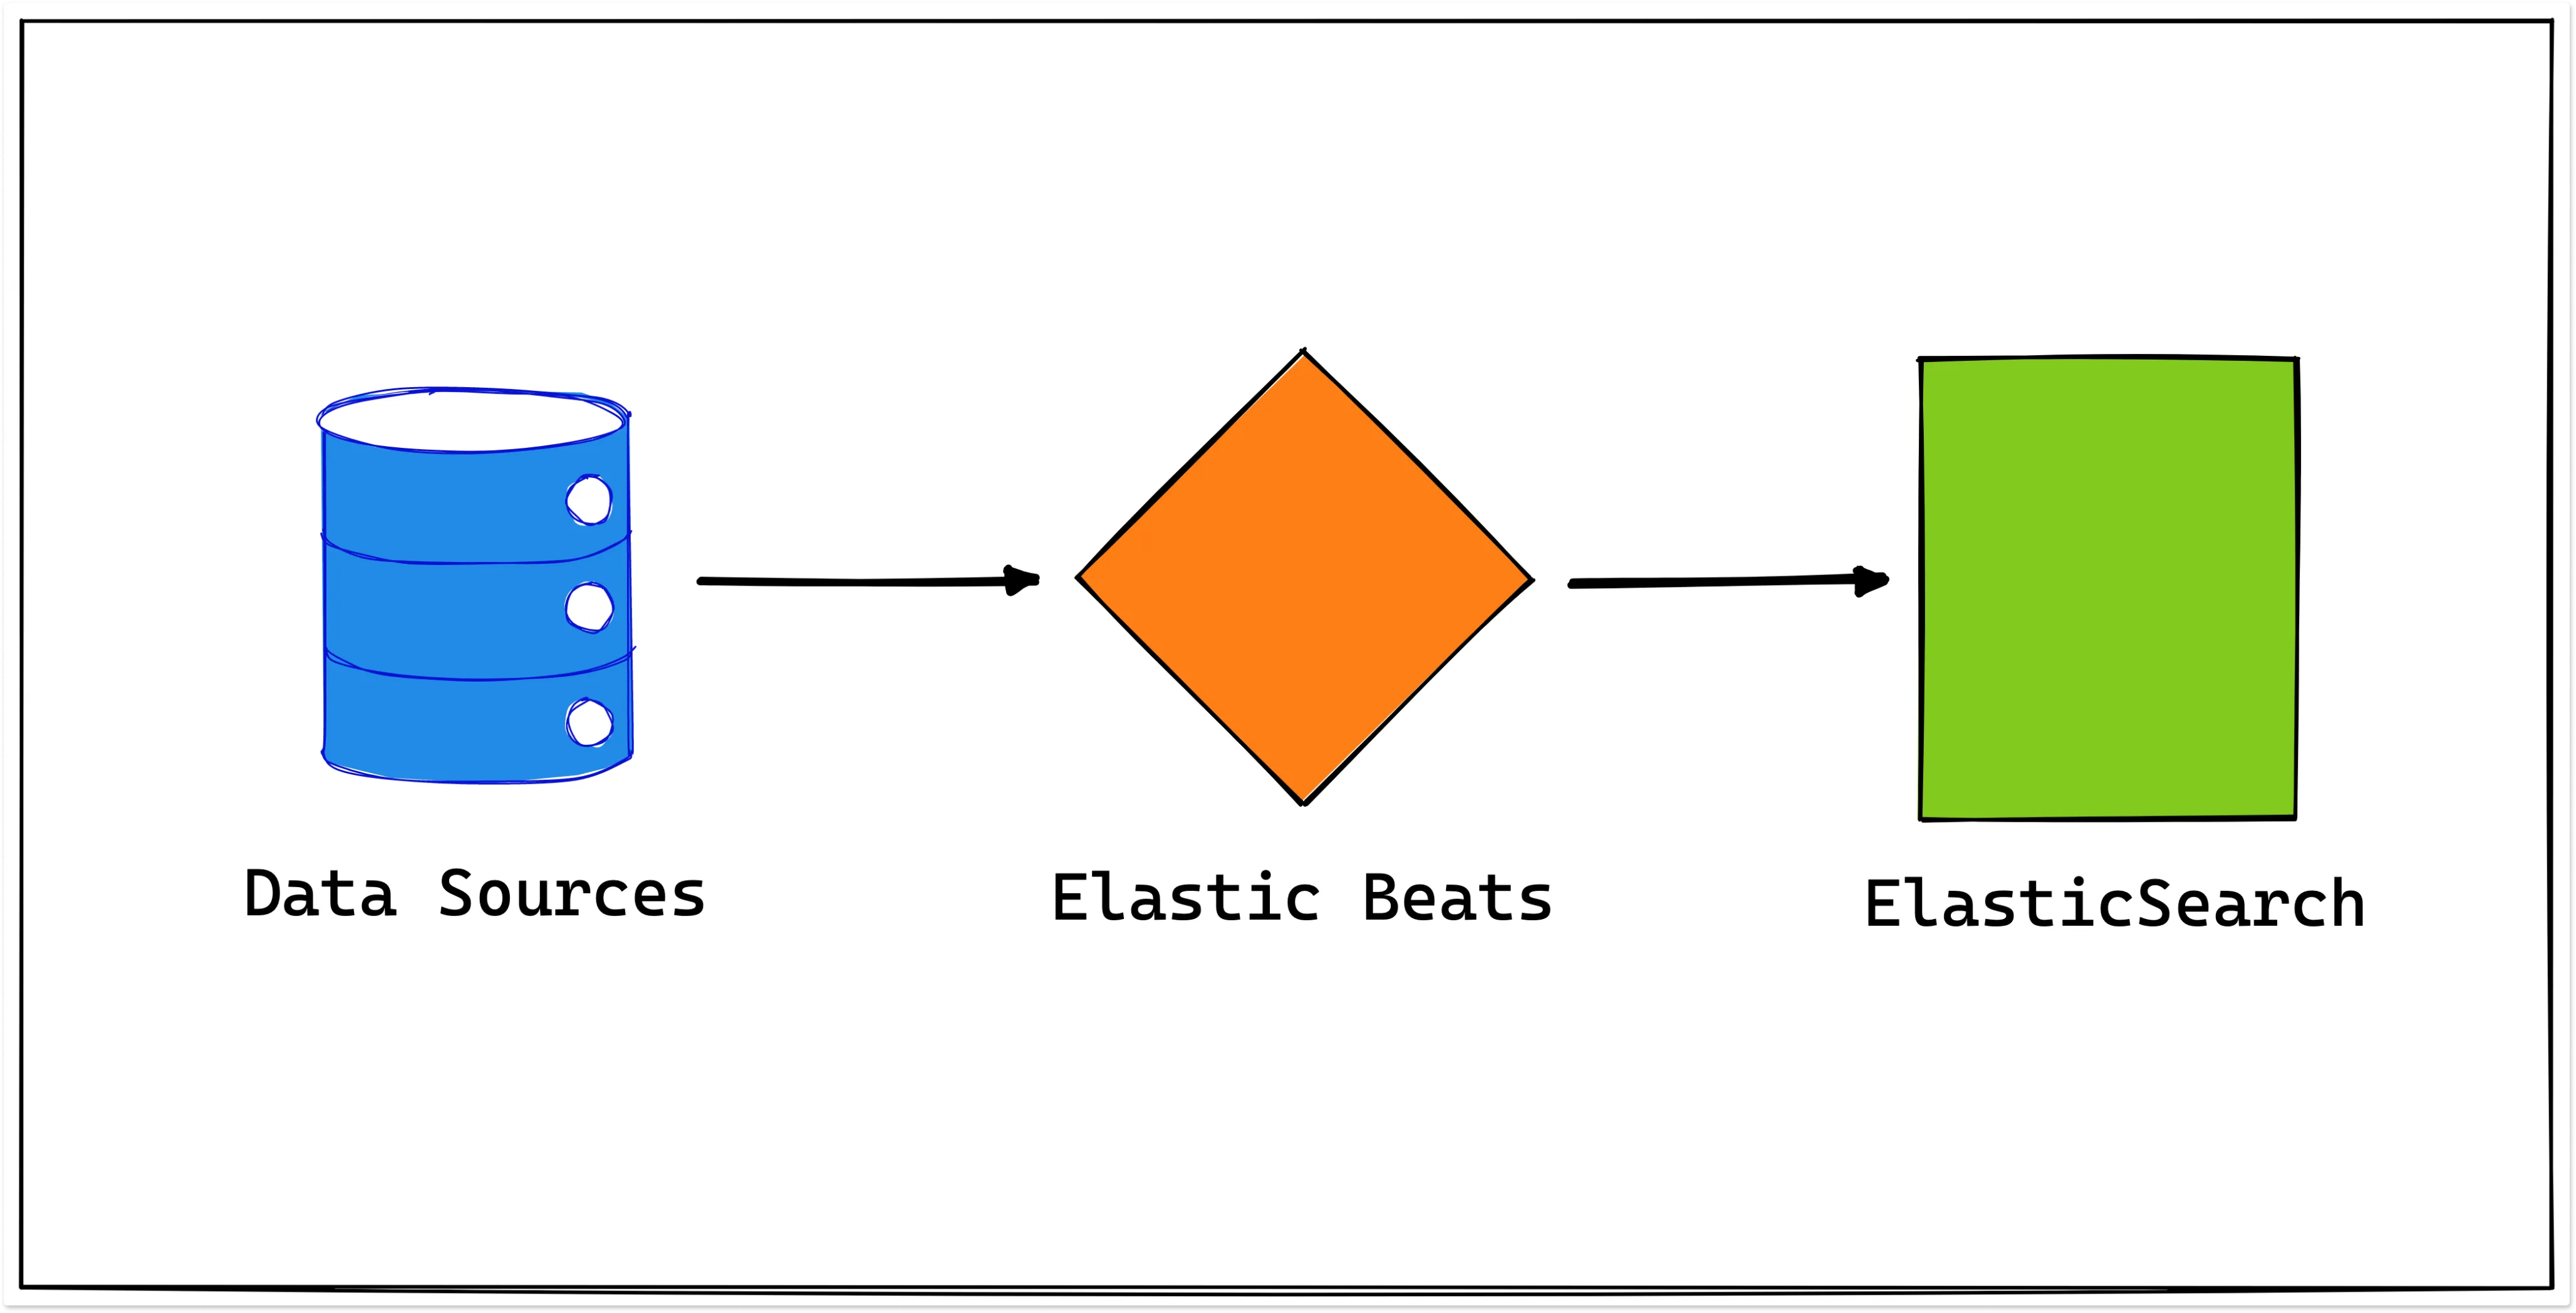
Elasticbeat is a lightweight log shipper that sends log files, system metrics, and network traffic to Elasticsearch for indexing and storage. It is part of the ELK stack (Elasticsearch, Logstash, Kibana).Elasticbeat collects data from a variety of sources and processes and enriches it before sending it to its destination. It can be installed and configured on a variety of operating systems, including Linux, macOS, and Windows. Additionally, it can be run as a Docker container.
A key benefit of Elasticbeat is that it can run on multiple servers and collect data from a variety of sources.
How does Elasticbeat work?
- It collects data (such as log files, system metrics, network traffic, and more) from configured data sources.
- It processes and enriches (like filtering and transforming) the collected data before sending it to its destination.
- It sends the processed and enriched data to Elasticsearch for indexing and storage. Then, the collected data can be accessed and analyzed.
OpenTelemetry Collector
OpenTelemetry Collector is one of the newest entrants in log collection tools. OpenTelemetry is an open source observability framework that aims to standardize the generation, collection, and management of telemetry data (logs, metrics, and traces).
OpenTelemetry is a collection of client libraries, APIs, and SDKs that help in generating telemetry data. It provides OpenTelemetry Collectors as a stand-alone service. OpenTelemetry Collectors can be used to collect logs and send them to a final destination like SigNoz.
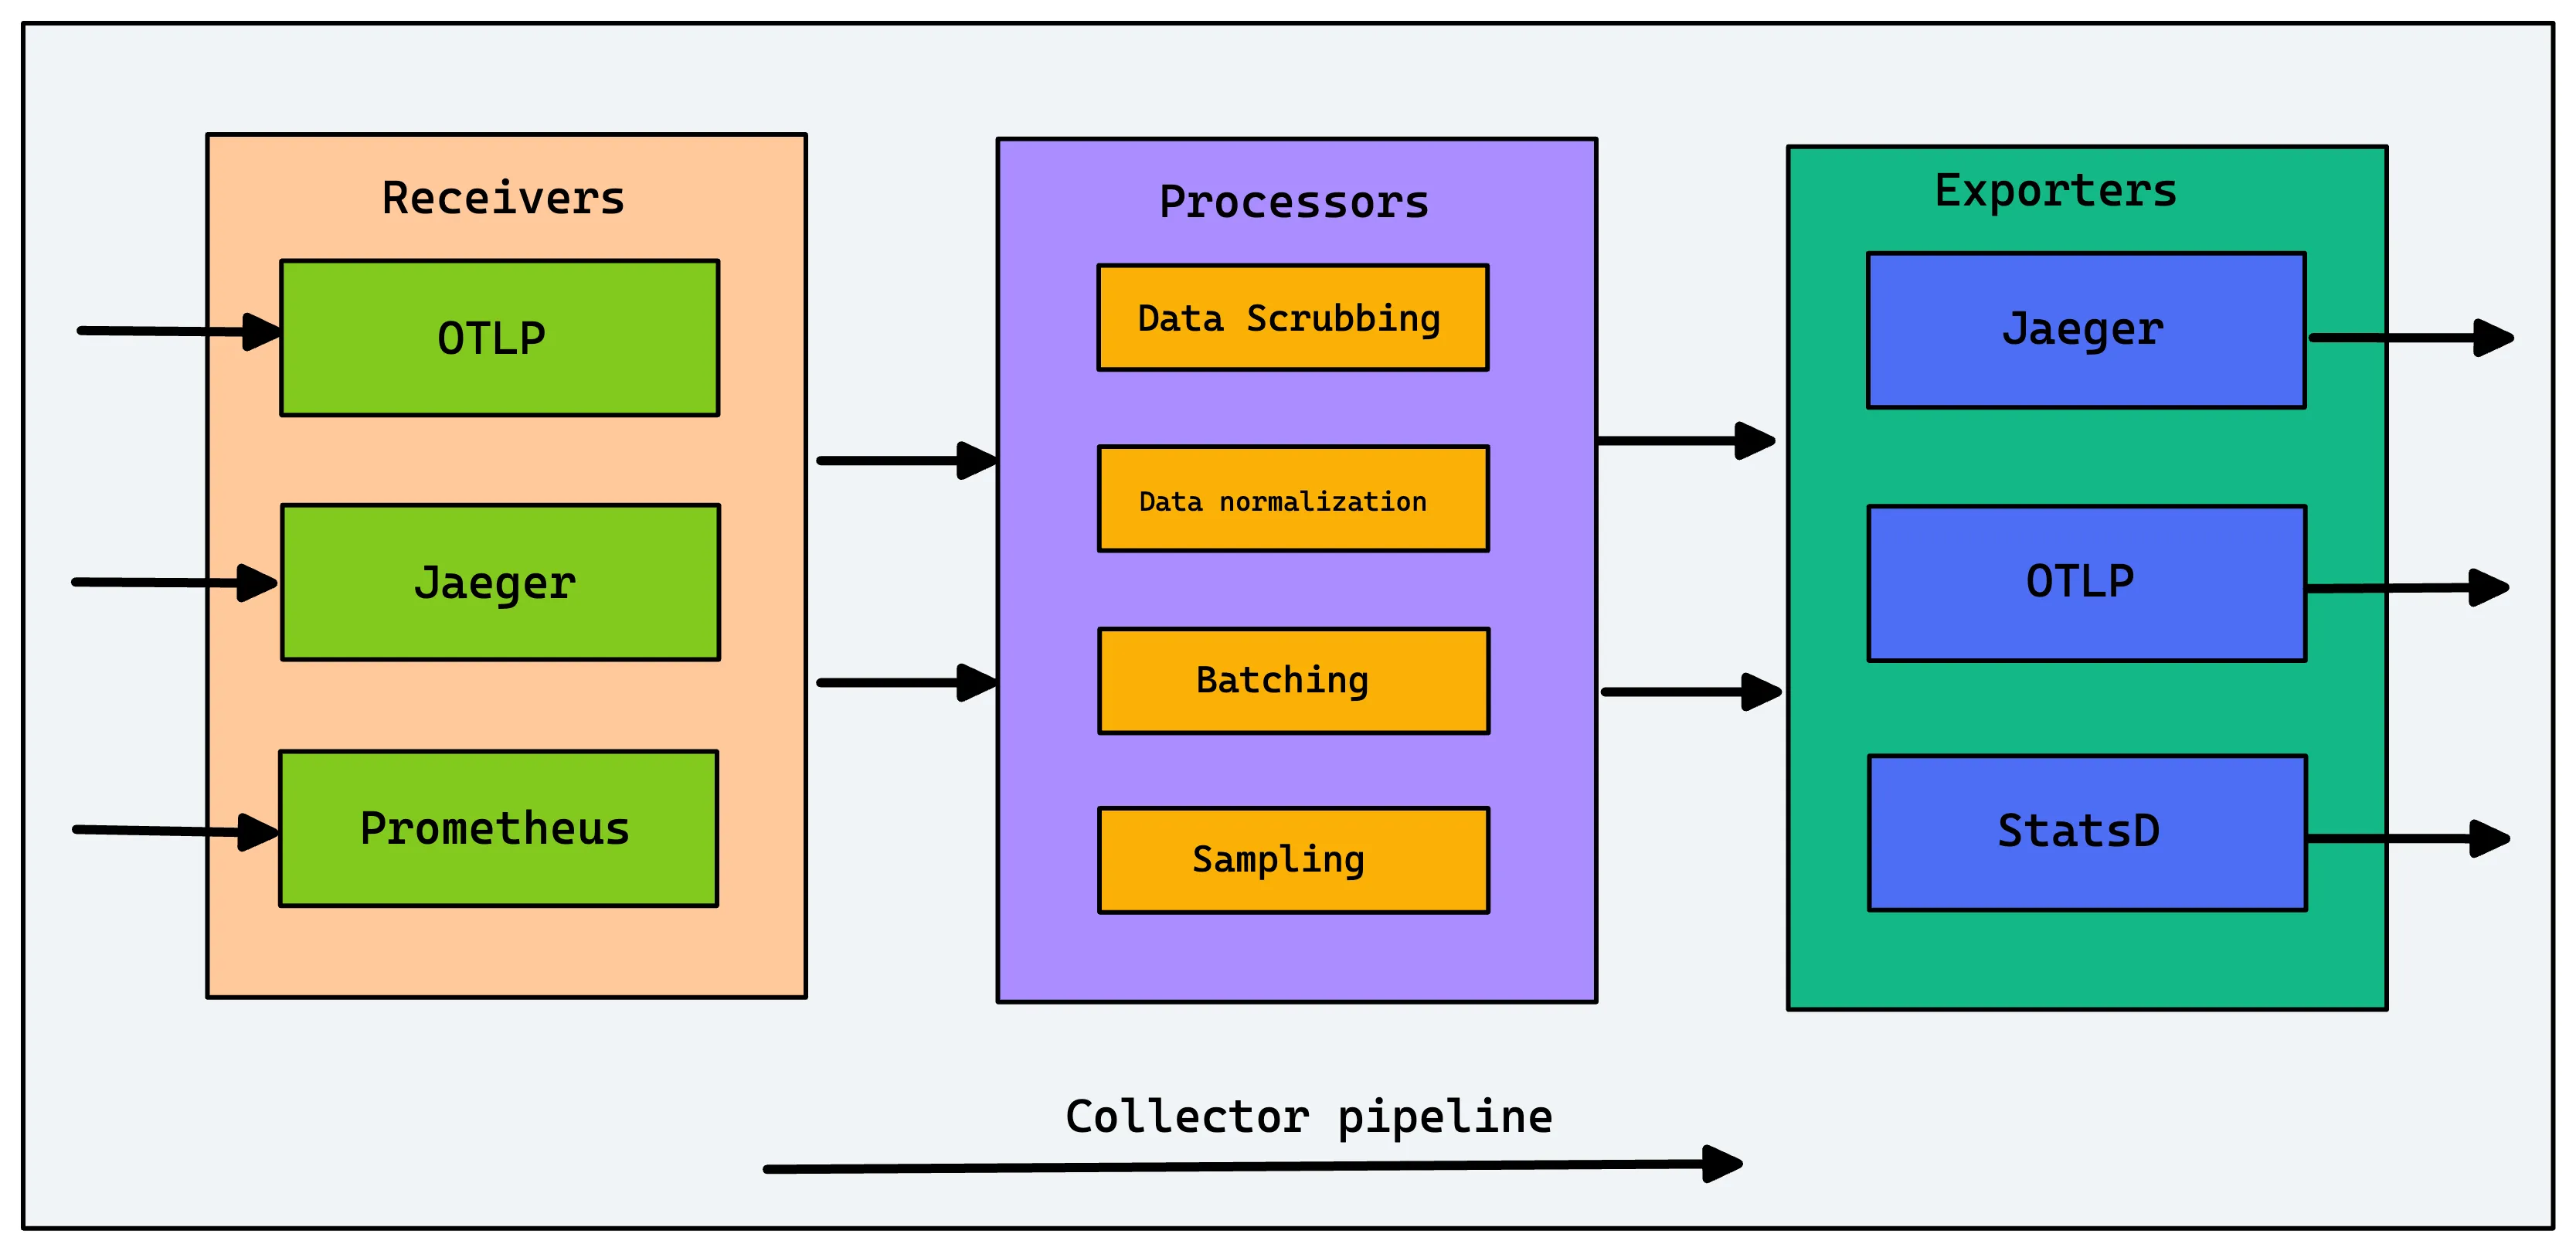
OpenTelemetry Collectors can collect logs from applications via file or stdout logs. It has different receivers like Filelog receivers to receive various kinds of logs. OpenTelemetry is quietly becoming the world standard for instrumentation, and it is a good choice to set up log collection.
Once the logs are collected, you need to send them to a log management tool. You can use SigNoz, an open source APM that provides logs, metrics, and traces under a single pane of glass.
Log Analytics with SigNoz
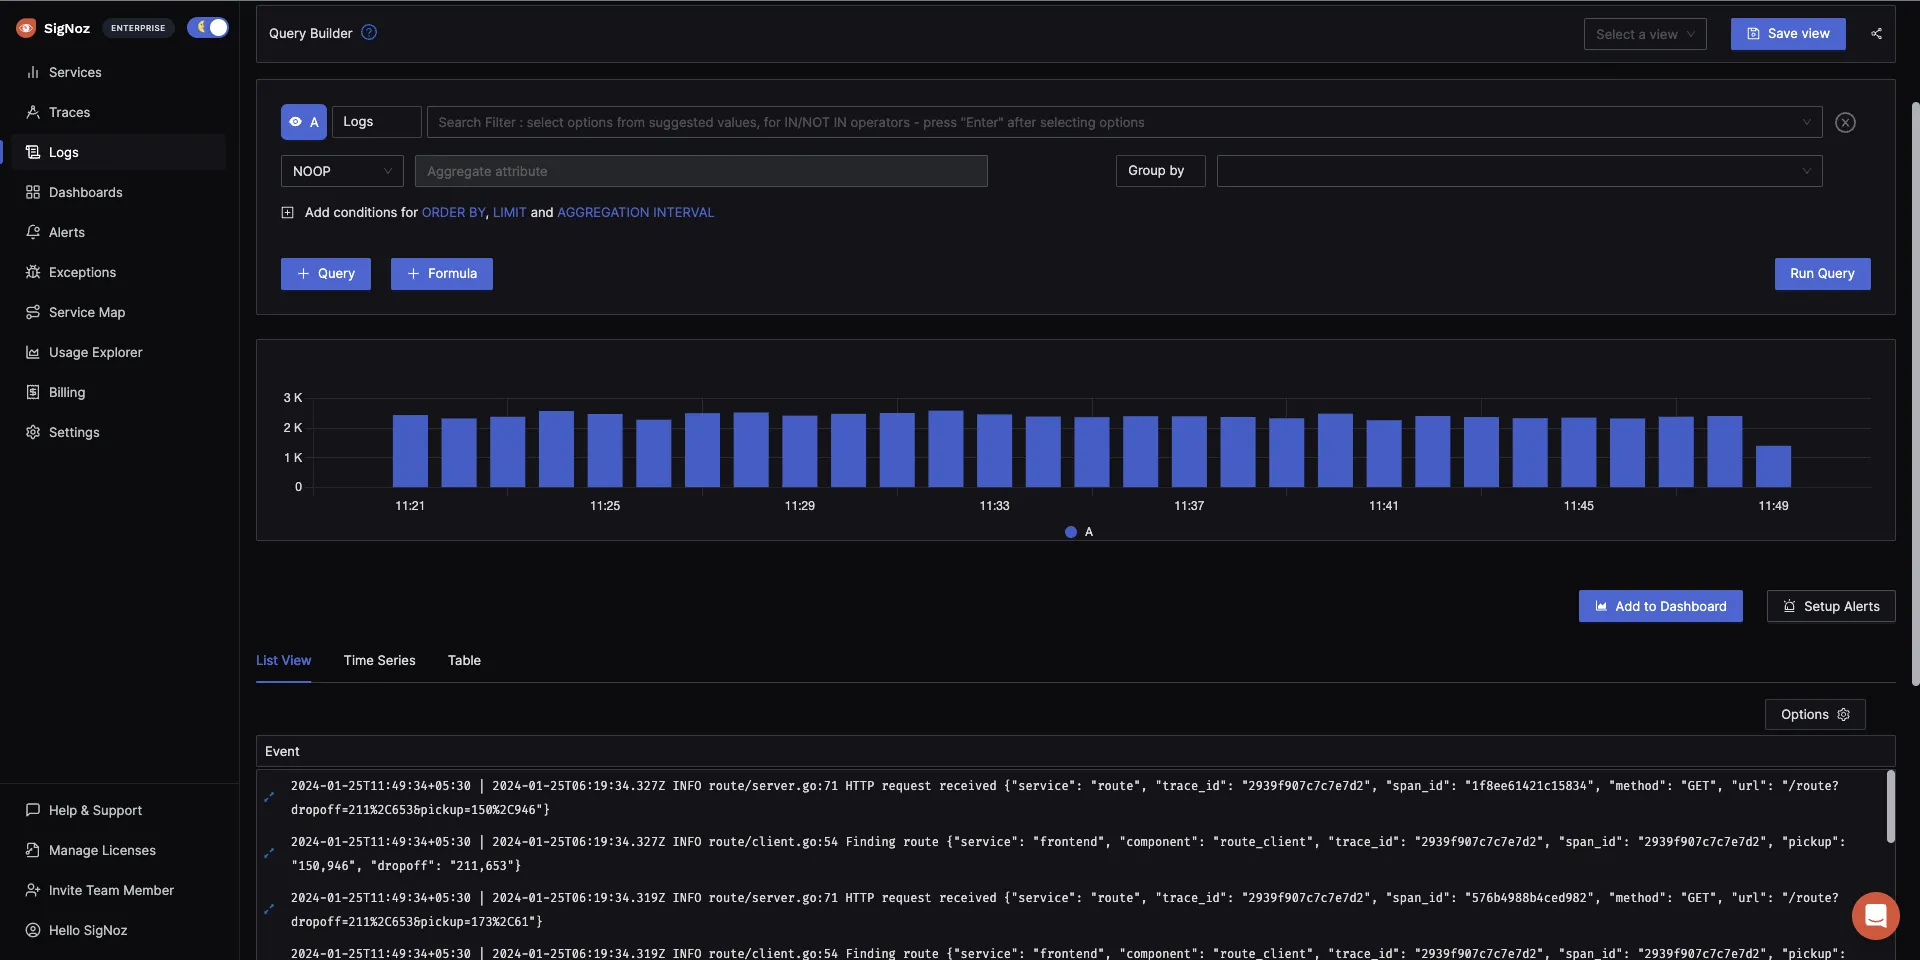
SigNoz is a full-stack open source APM that provides log management as one of its core features. It uses a columnar database ClickHouse to store logs, which is very efficient at ingesting and storing logs data. Columnar databases like ClickHouse are very effective in storing log data and making it available for analysis.
The logs tab in SigNoz has advanced features like a log query builder, search across multiple fields, structured table view, JSON view, etc.
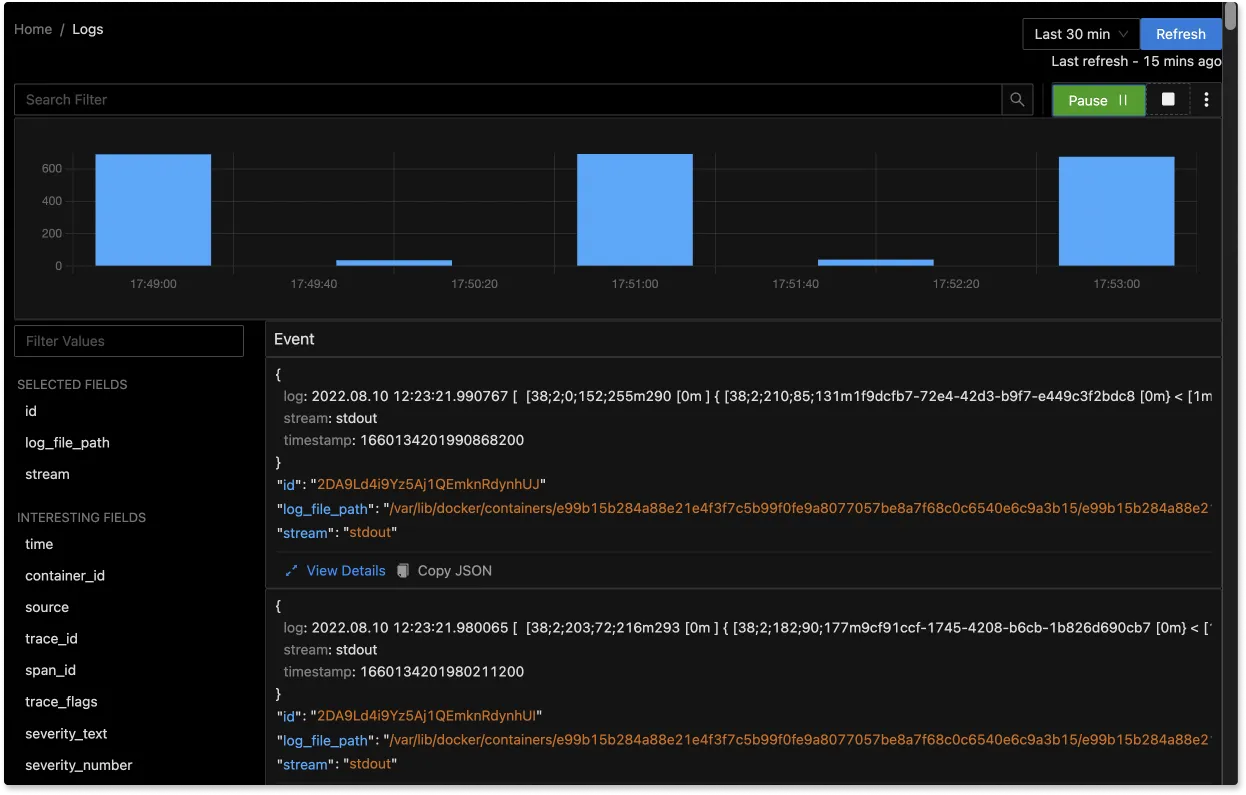
You can also view logs in real time with live tail logging.
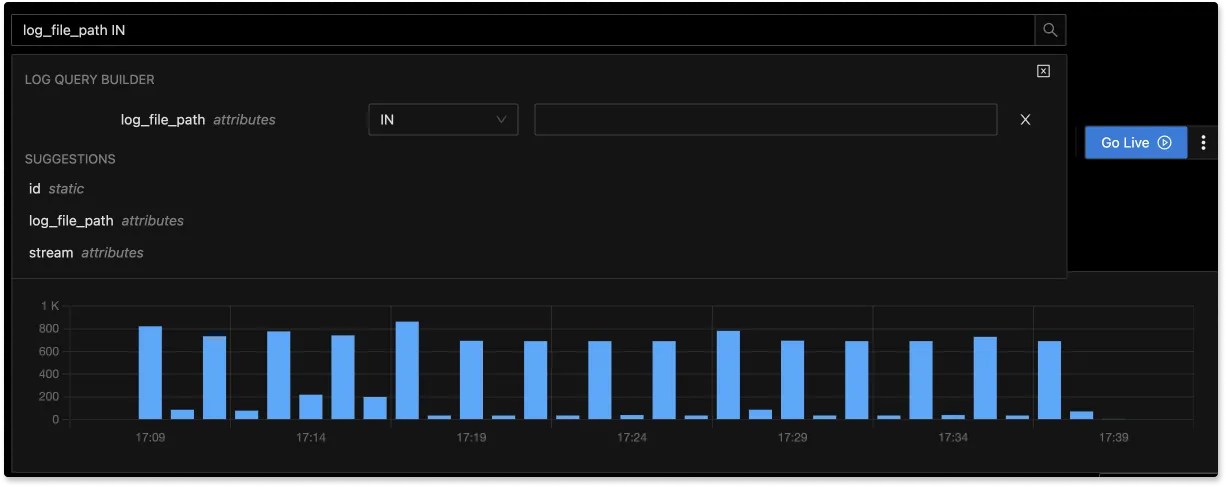
With advanced Log Query Builder, you can filter out logs quickly with a mix and match of fields.
Conclusion - choosing a log shipper of your choice
In this article, we discussed what log shippers are and why we need them. Among the log shippers, Syslog and Rsyslog can be used for collecting and sending system logs to a centralized log management tool. FluentD and Logstash can be used when you need a data processing pipeline. While Logstash is mainly used along with the ELK stack, FluentD has wider community adoption.
Elastic Beats can be used if you are using the ELK stack. OpenTelemetry Collector is one of the emerging log shippers that can be used if you plan to collect other telemetry signals with a single solution. Log shippers provide a reliable and easy means to send logs (or log files) from a file-based data source to a supported output destination. Log shippers offer a high level of reliability and flexibility.
Related Post

