Log Monitoring 101 Detailed Guide [Included 10 Tips]
Log monitoring is the practice of tracking and analyzing logs generated by software applications, systems, and infrastructure components. These logs are records of events, actions, and errors that occur within a system. Log monitoring helps ensure the health, performance, and security of applications and infrastructure.

Log Monitoring helps in early detection of potential issues, ensuring systems run smoothly and efficiently. In this detailed 101 guide on Log monitoring, we will learn
In the ever-evolving software development landscape, cloud-native applications have become the new norm. With the adoption of microservices, containers, and orchestration platforms like Kubernetes, the way we handle logs has also transformed. This article delves into the world of log monitoring, exploring its significance in the context of modern cloud-native applications.
In the context of cloud-native applications, log monitoring plays a pivotal role in maintaining system reliability, identifying issues, and troubleshooting in real-time.
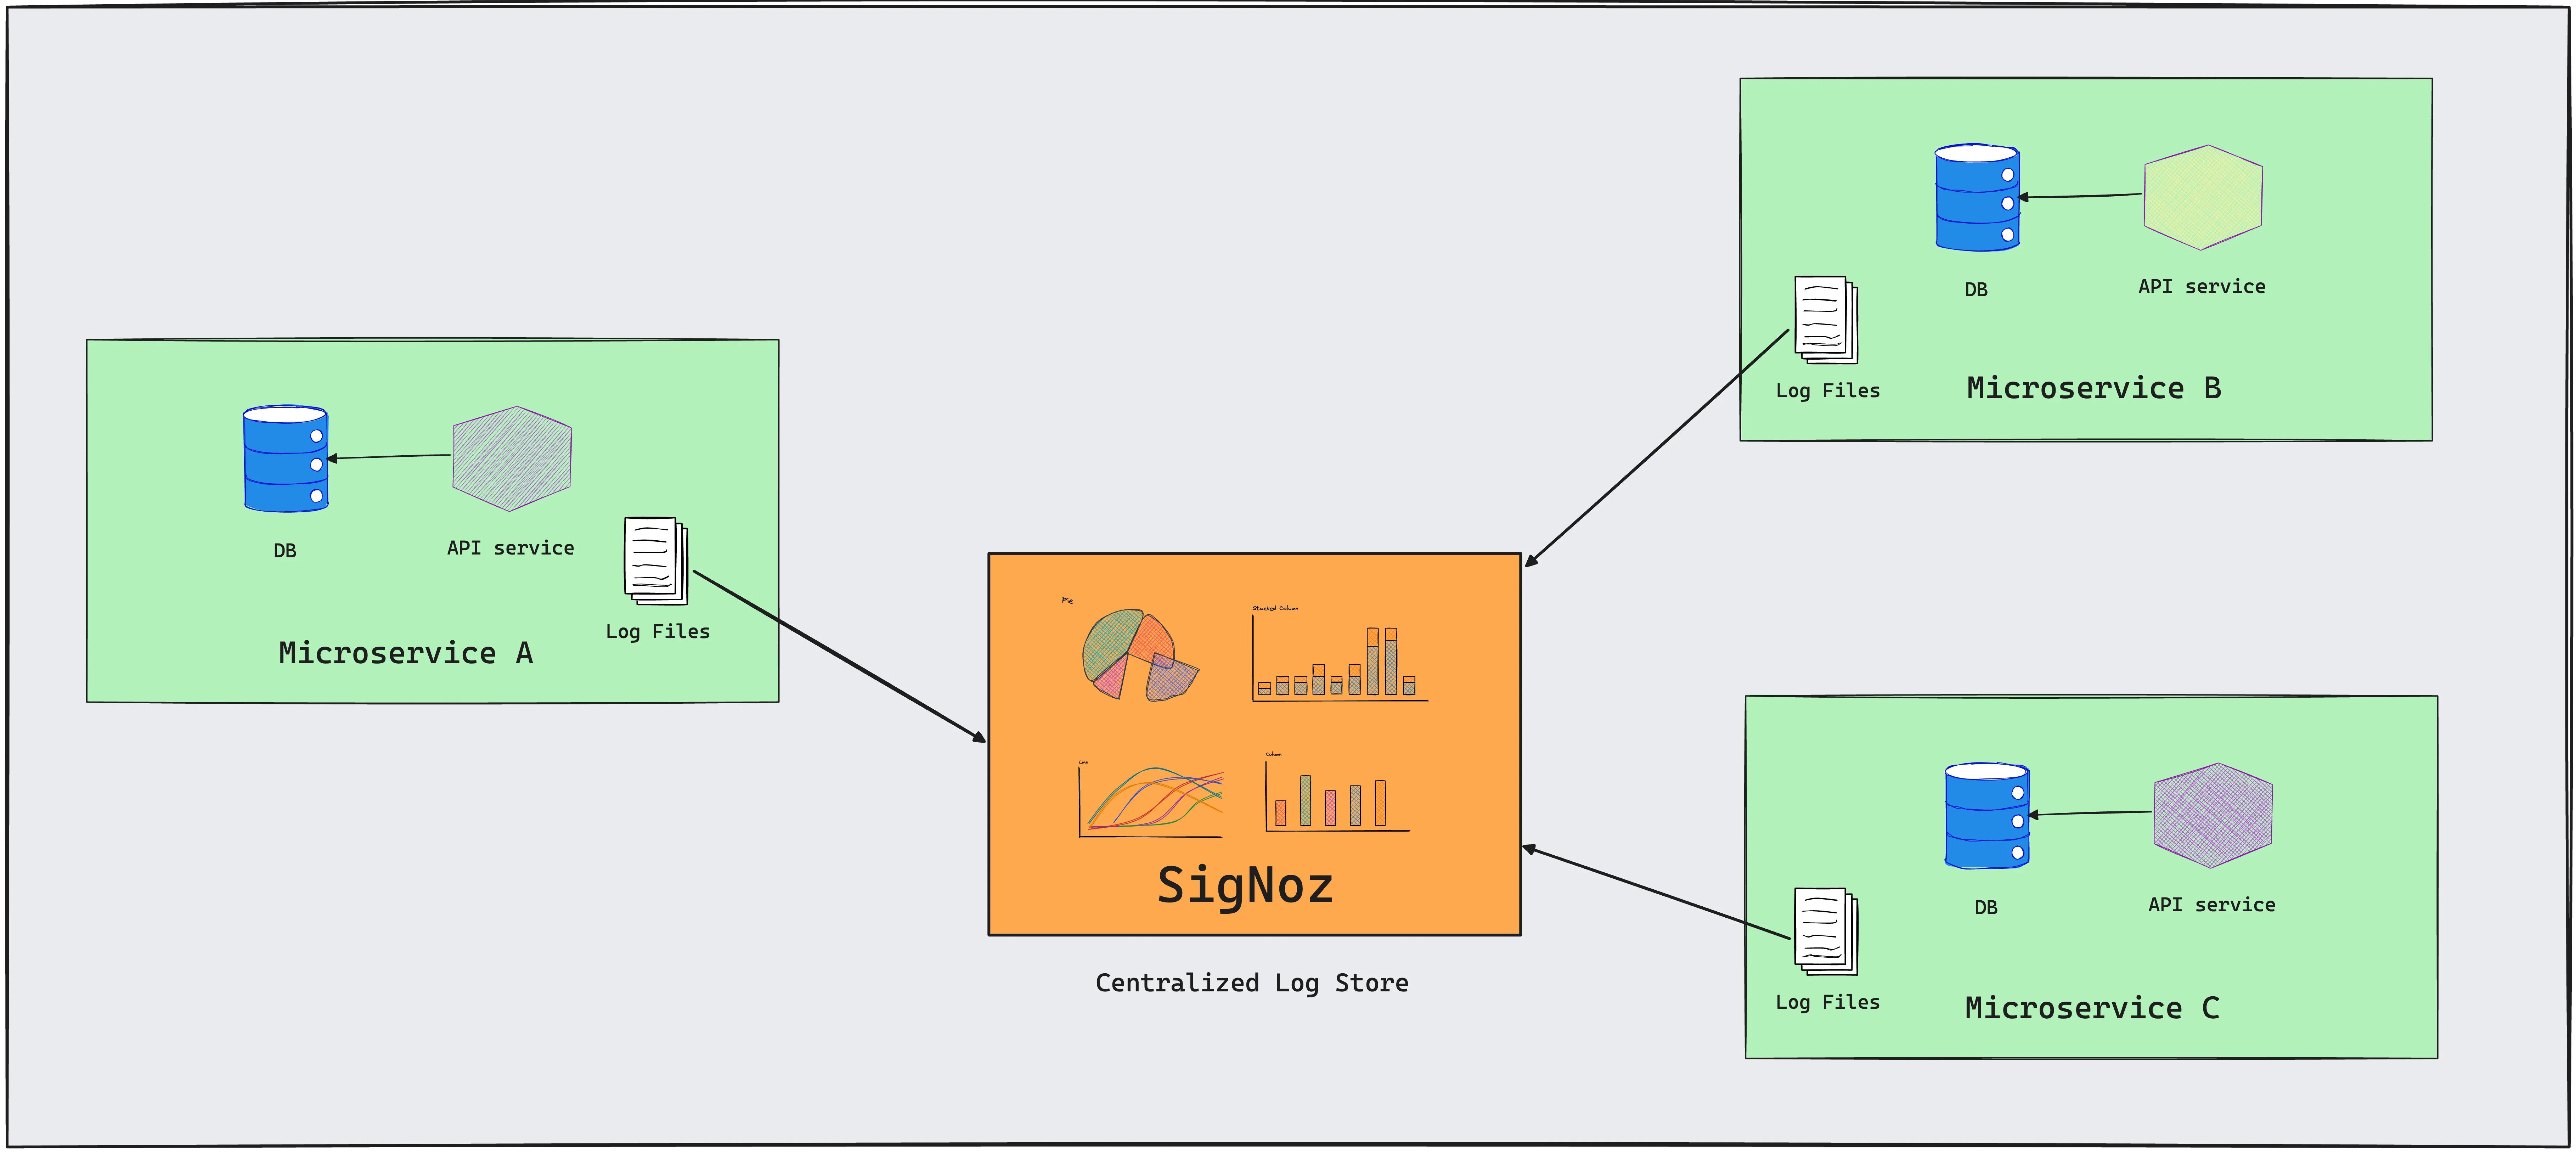
If you're looking for a log monitoring tool, you can skip to this section.
What is a Log?
A log, in the context of computing and IT, is a record that documents events, actions, transactions, or communications that occur within software applications, operating systems, networks, or other computer systems. These logs are created automatically by the systems or applications to provide a timestamped chronicle of activities.
Application developers also write their own logs to record custom information. To implement custom logging, developers use logging libraries and frameworks appropriate to their programming language and platform. For instance, in Python, the logging module is commonly used, while Java developers might use Log4J or SLF4J.
What is Log Monitoring - The Fundamentals
Log monitoring is the process of systematically collecting, analyzing, and managing logs generated by computers, applications, and networks. It involves tracking and reviewing these logs to identify and respond to issues, ensure system health, and maintain security.
Some fundamental aspects of log monitoring include:
Log Collection: Gathering log data from various sources such as servers, network devices, applications, and security systems. This step is crucial for ensuring a comprehensive view of the IT environment.
Log Aggregation: Consolidating log data from multiple sources into a single, unified format for easier processing and analysis. Aggregation simplifies managing large volumes of log data.
Log Analysis: Interpreting the collected log data to extract meaningful insights. This involves identifying patterns, anomalies, and trends that could indicate performance issues, security threats, or system malfunctions.
Log Storage: Securely storing log data for a defined period, balancing the needs of accessibility for analysis and compliance with data retention policies.
Reporting and Visualization: Creating reports and visualizations from log data to help stakeholders understand the system’s performance, security posture, and other key metrics.
Scalability: Ensuring the log monitoring system can scale with the growth of the IT infrastructure, handling increased data volumes without loss of performance.
Different Types of Logs
Logs can be categorized into various types based on their source and purpose. In the realm of cloud-native applications, some common types of logs include:
Application Logs
Application logs capture information specific to an application. These logs provide insights into user interactions, business logic execution, and application-specific errors. Monitoring application logs is essential for identifying issues affecting user experience and business functionality.System Logs
System logs originate from the operating system. They contain information about system-level events, such as hardware status, resource utilization, and system errors. Monitoring system logs is crucial for diagnosing system-level issues and optimizing resource utilization in cloud-native environments.Infrastructure Logs
Infrastructure logs encompass logs generated by the underlying infrastructure components, including servers, virtual machines, and network devices. These logs help administrators and DevOps teams monitor the health and performance of infrastructure resources in cloud-native setups.Security Logs
Security logs are specialized records within a computer system, network, or application that capture security-related events. Security logs serve as an audit trail for compliance with legal and regulatory standards. They provide evidence of security policy adherence and can be crucial during forensic investigations following a security incident.
Understanding Log formats
Understanding log format is essential for effective log parsing and analysis. Different log formats structure data in various ways. A clear understanding of the format is crucial for effective parsing and analysis of the log data. Without this understanding, extracting meaningful insights from the logs can be challenging and error-prone.
Some common log formats are:
- Plain Text: The simplest form, where logs are written in human-readable text. While easy to read, they can be challenging to parse due to a lack of standard structure.
- Structured Formats (JSON, XML): These formats organize data in a structured manner, making them easier to parse programmatically. JSON (JavaScript Object Notation) and XML (eXtensible Markup Language) are popular choices.
- Syslog: A standard for message logging, widely used in network devices and Unix/Linux systems. It provides a standardized protocol for system log or event messages.
- Proprietary Formats: Some systems or applications generate logs in proprietary formats, requiring specific tools or scripts to read and analyze.
Setting up Log Monitoring
Setting up log monitoring involves a series of systematic steps to ensure you effectively capture, analyze, and act upon the log data generated by your systems and applications. Here's a structured approach to setting up log monitoring:
Identify and Understand Your Log Sources:
- Determine where your logs are coming from (e.g., servers, applications, network devices).
- Understand the types and formats of logs these sources produce.
Define Log Monitoring Objectives:
- Determine what you need to achieve with log monitoring (e.g., error tracking, performance monitoring, security auditing).
- This will guide the setup process and help you focus on the most relevant log data.
Choose the Right Log Monitoring Tools:
- Based on your objectives, select appropriate tools for log aggregation, storage, analysis, and visualization (e.g., SigNoz, ELK Stack, Splunk).
- Consider factors like compatibility with your log sources, scalability, cost, and ease of use.
Set Up Log Aggregation and Centralization:
Implement a system to collect logs from various sources and centralize them. This could involve using log aggregators like Fluentd or Logstash. You can also use OpenTelemetry to generate and collect logs.
Ensure the solution can handle the volume and variety of logs you expect to collect. A tool like SigNoz, which uses ClickHouse as a data store, can handle good volumes of logs for both storage and querying.
Configure Log Processing and Storage:
- Set up parsing rules to process and normalize log data into a consistent format. Some tools provide easy ways to parse logs easily. For example, SigNoz provides a Logs pipeline feature to transform your logs to suit your querying and aggregation needs before they get stored in the database.
- Plan for efficient storage that balances accessibility, retention policies, and cost, especially for high-volume log data. It will also depend on factors like whether you’re using a self-hosted service or a cloud service.
Implement Log Analysis and Monitoring:
- Configure your log monitoring tool to analyze the log data. This could involve setting up filters, queries, and dashboards.
- Regularly refine these configurations as you better understand your log data and as your monitoring needs evolve.
Set Up Alerts and Notifications:
- Define criteria for alerts based on log data patterns, such as errors or unusual activities.
- Set up notification mechanisms (e.g., email, SMS, integrations with incident management tools) to alert the relevant personnel.
Test and Validate Your Setup:
- Conduct tests to ensure that your log monitoring system is capturing, processing, and analyzing logs as expected.
- Validate that alerts are triggering correctly under various scenarios.
Document the Setup and Train Your Team:
- Document the configuration of your log monitoring setup for future reference and maintenance.
- Train relevant team members on how to use the system, interpret logs, and respond to alerts.
Regular Review and Optimization:
- Periodically review the effectiveness of your log monitoring setup.
- Make adjustments to accommodate changes in your IT environment, such as new applications, infrastructure changes, or evolving security threats.
Ensure Compliance and Security:
- If applicable, ensure that your log monitoring practices comply with relevant regulations and standards.
- Implement security measures to protect log data, especially if it contains sensitive information.
By following these steps, you can establish a robust log monitoring system that helps you stay informed about the health, performance, and security of your IT environment.
One of the most critical steps in log monitoring is choosing the right log monitoring tool. Let's look at some of the top log monitoring tools that you can use.
Top 11 Log Monitoring Tools that you may consider
One of the most critical steps in setting up log monitoring is to choose the right log monitoring tool. You should look at factors such as compatibility with your existing infrastructure, scalability, and ease of use when choosing the right log monitoring tool for your use case.
Here, we are sharing a concise list of the top 11 log monitoring tools. You can also refer to this list of open-source log management tools if you’re interested only in open-source solutions.
Here are the top 11 log monitoring tools at a glance:
| Tool | Best Suited for | Pricing |
|---|---|---|
| SigNoz (Open-Source) | OpenTelemetry-based logs, efficient ClickHouse-based logs storage, strong correlation of logs with other signals like metrics & traces. | $0.3 per GB of ingested logs |
| Splunk | Handling massive volumes of data is ideal for enterprises but can be expensive. | Starts at $75 per host per month when billed annually. |
| Datadog | Unified UI for all types of signals, good integrations for logs | $0.1 per ingested GB and $1.70 per mn log events for 15-day retention. |
| Graylog | Offers products aimed at improving uptime & security | The security product starts at $1550/month |
| Loggly | Real-time log monitoring & analytics | Pro starts at $159 per month when billed annually |
| Mezmo | Telemetry pipelines to optimize telemetry data for costs & insights | $1.3 per GB for 14-day retention |
| New Relic | Integrate logs with APM data | $0.3 per GB + user-based pricing |
| Loki by Grafana | Similar to Prometheus in data model, Simple query language LogQL | $0.5 per GB ingested |
| ELK | If you’re already using Elasticsearch | $95 per month for standard plan |
| Sumologic | Logs analytics & insights with ML | $3 per GB for annual contracts with min. of 1GB data ingestion per day |
| Sematext | Uses Elasticsearch under the hood | Starts at $50 per month |
SigNoz
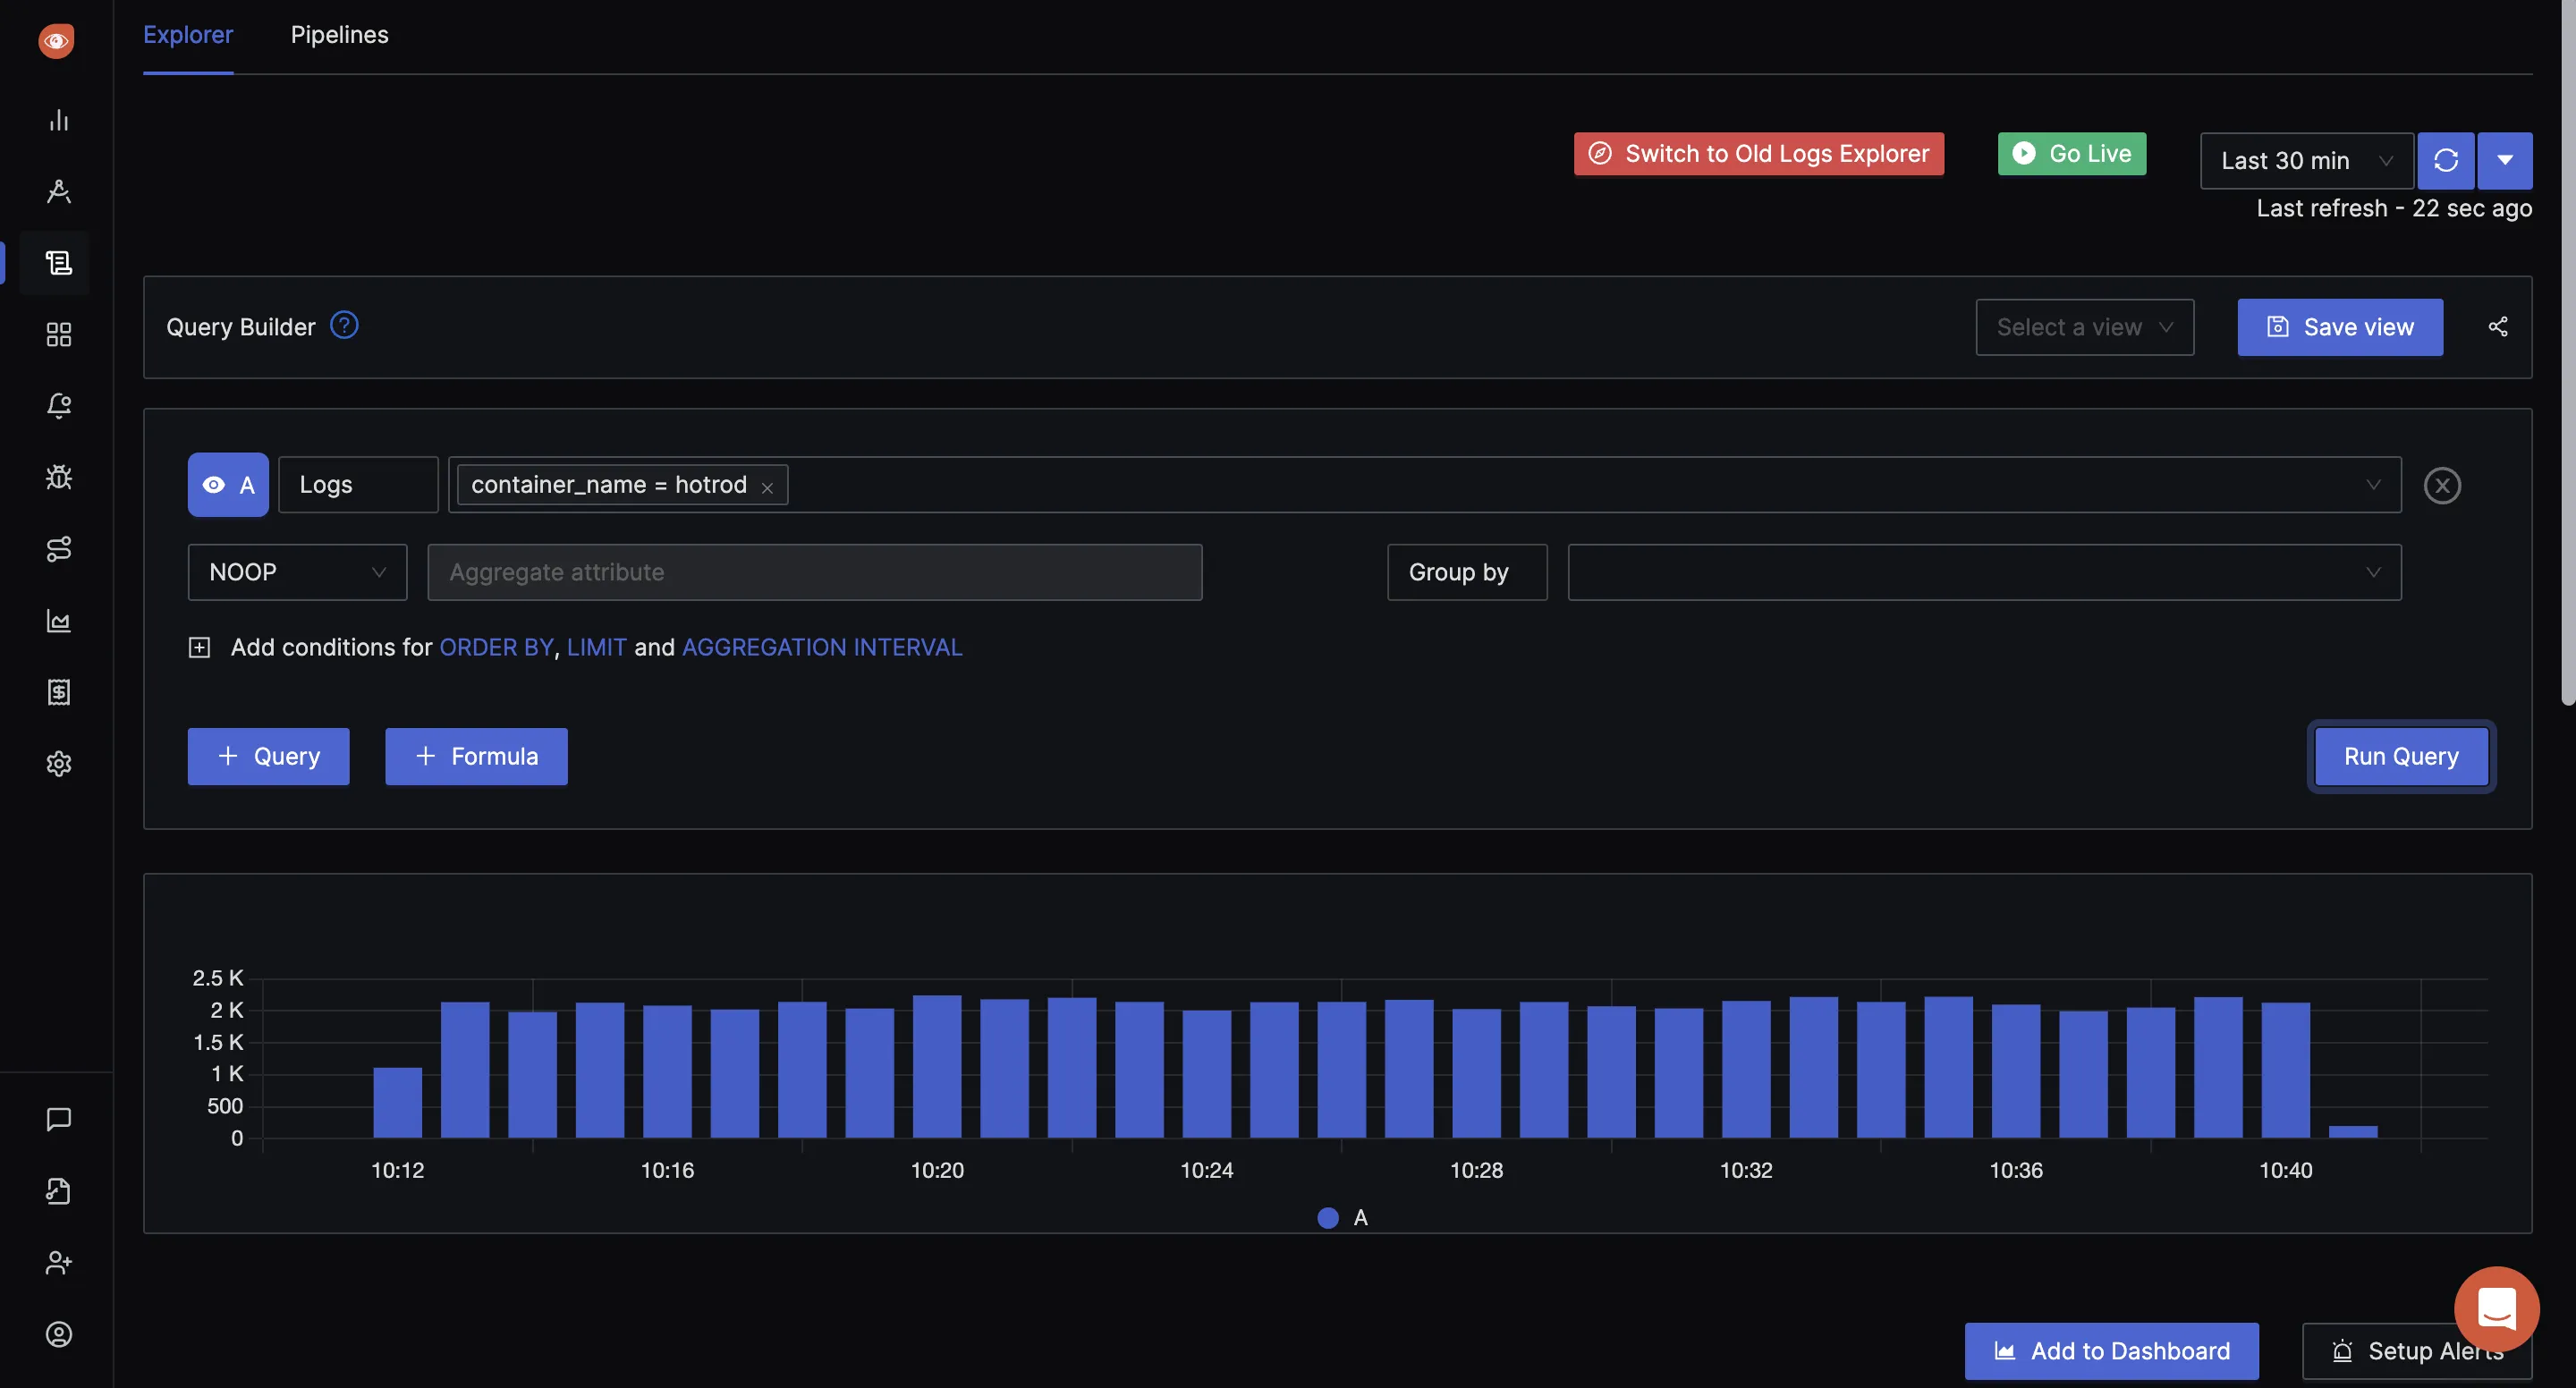
SigNoz provides log monitoring with a lot of useful features. You can aggregate and centralize your log monitoring with SigNoz. Some of the key features provided by SigNoz log monitoring is as follows:
- Centralized Log Management: SigNoz allows you to aggregate logs from various sources, providing a centralized platform for monitoring and analysis.
- Real-time Log Analysis: SigNoz provides a live tail view for real-time analysis of log data, which is crucial for promptly detecting and responding to issues or anomalies in your systems.
- Advanced Filtering and Search: SigNoz offers advanced filtering and search capabilities, allowing users to quickly locate specific log entries based on various parameters like timestamps, log levels, or custom tags.
- Visualization and Dashboards: It provides visualization tools and customizable dashboards, making it easier to understand and interpret log data. These visualizations can help in identifying trends and patterns in the log data.
- Alerting and Notifications: SigNoz can be configured to send alerts and notifications based on specific log patterns or anomalies. This feature helps in proactively managing potential issues before they escalate.
- Integration with Tracing and Metrics: Besides logs, SigNoz integrates tracing and metrics, offering a more comprehensive view of your system's performance and health. This holistic approach is beneficial for effective root cause analysis.
- Scalability and Performance: SigNoz uses ClickHouse, a columnar database for log storage. It is much more efficient than Elasticsearch and Loki as a data storage. Here’s a logs performance benchmark comparing SigNoz with Elasticsearch and Loki.
- Open Source and Customizability: SigNoz uses OpenTelemetry to generate and collect logs. Both SigNoz and OpenTelemetry are open-source. Being open-source, SigNoz offers a level of customizability and flexibility that can be advantageous for teams with specific needs or for those who wish to contribute to its development.
The easiest way to get started with logs monitoring in SigNoz is to use SigNoz cloud.
Splunk
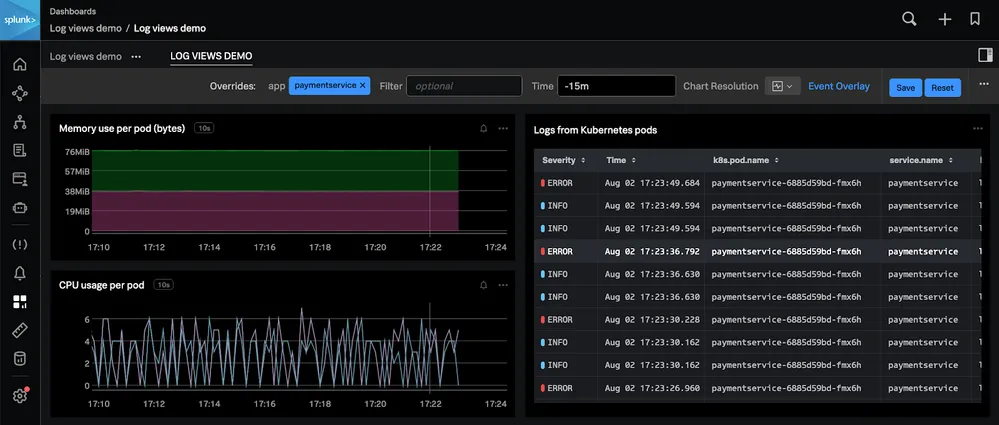
Splunk is a powerful log monitoring tool widely recognized for its ability to ingest and analyze massive volumes of machine data. It excels in real-time data processing, offering advanced search, visualization, and reporting capabilities. Splunk's intuitive interface allows for easy navigation and quick insights, making it ideal for troubleshooting, security, and compliance needs.
Datadog
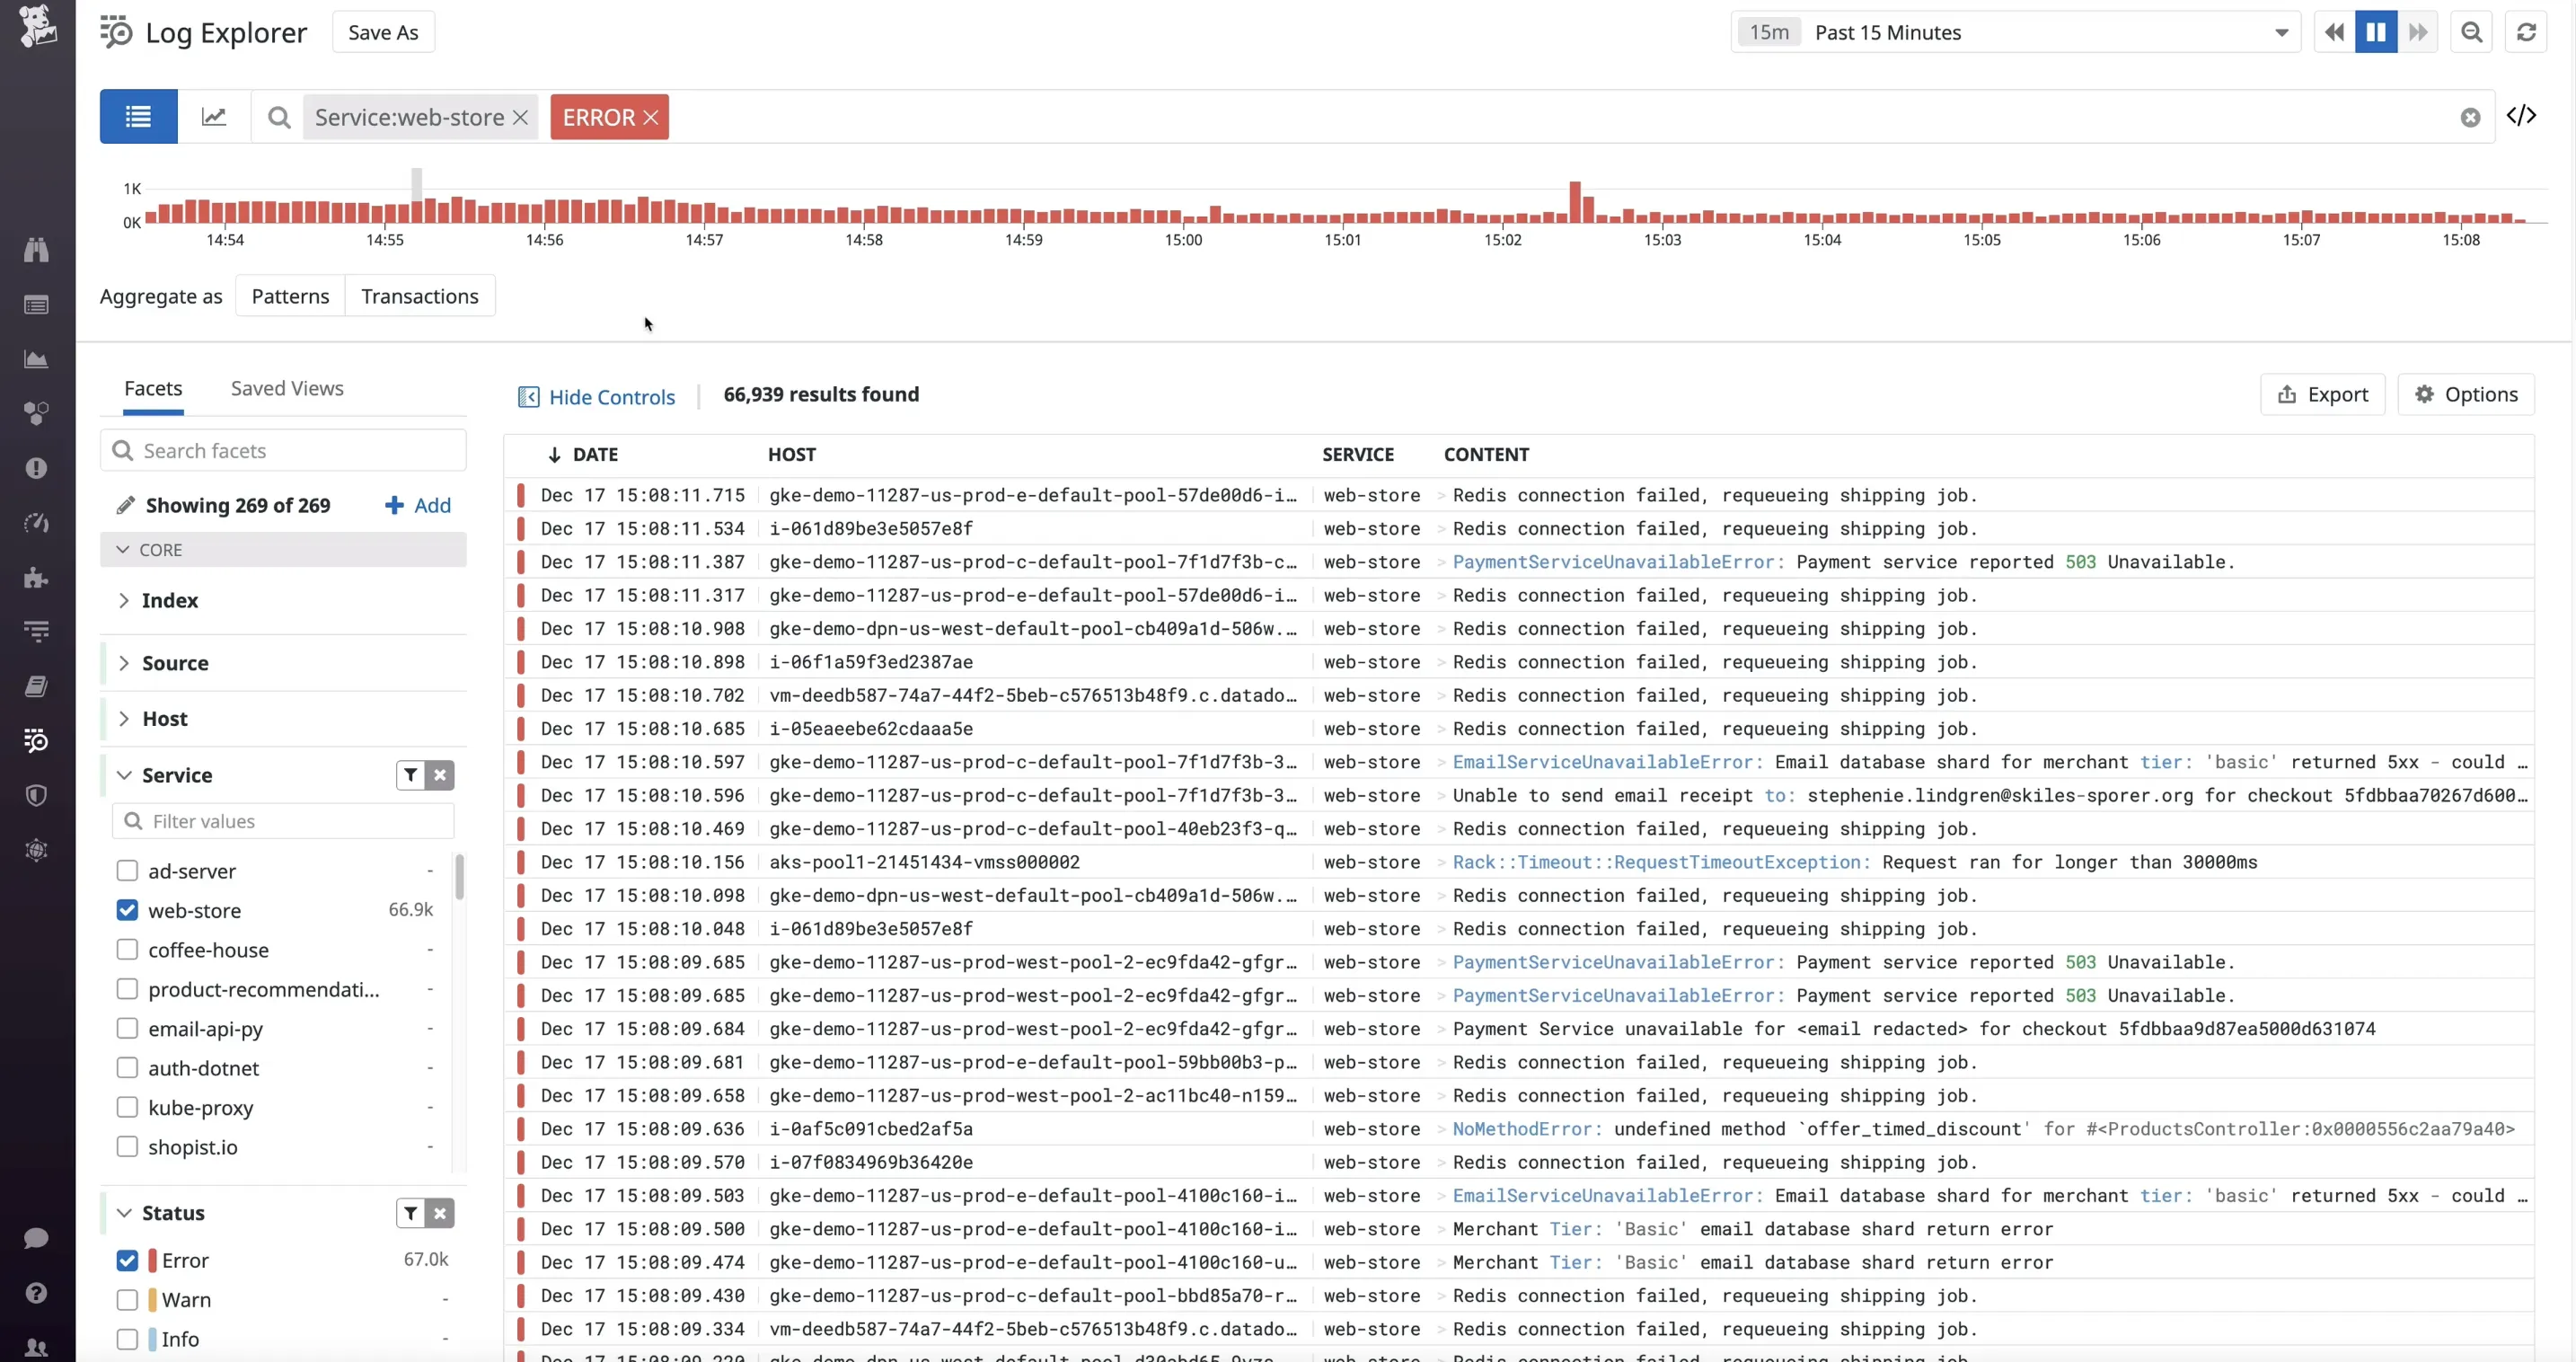
Datadog is a great log monitoring tool that integrates seamlessly with various cloud services, providing real-time analytics and observability across systems, applications, and services. Known for its user-friendly interface, Datadog offers powerful search capabilities, comprehensive dashboards, and sophisticated alerting features.
Graylog
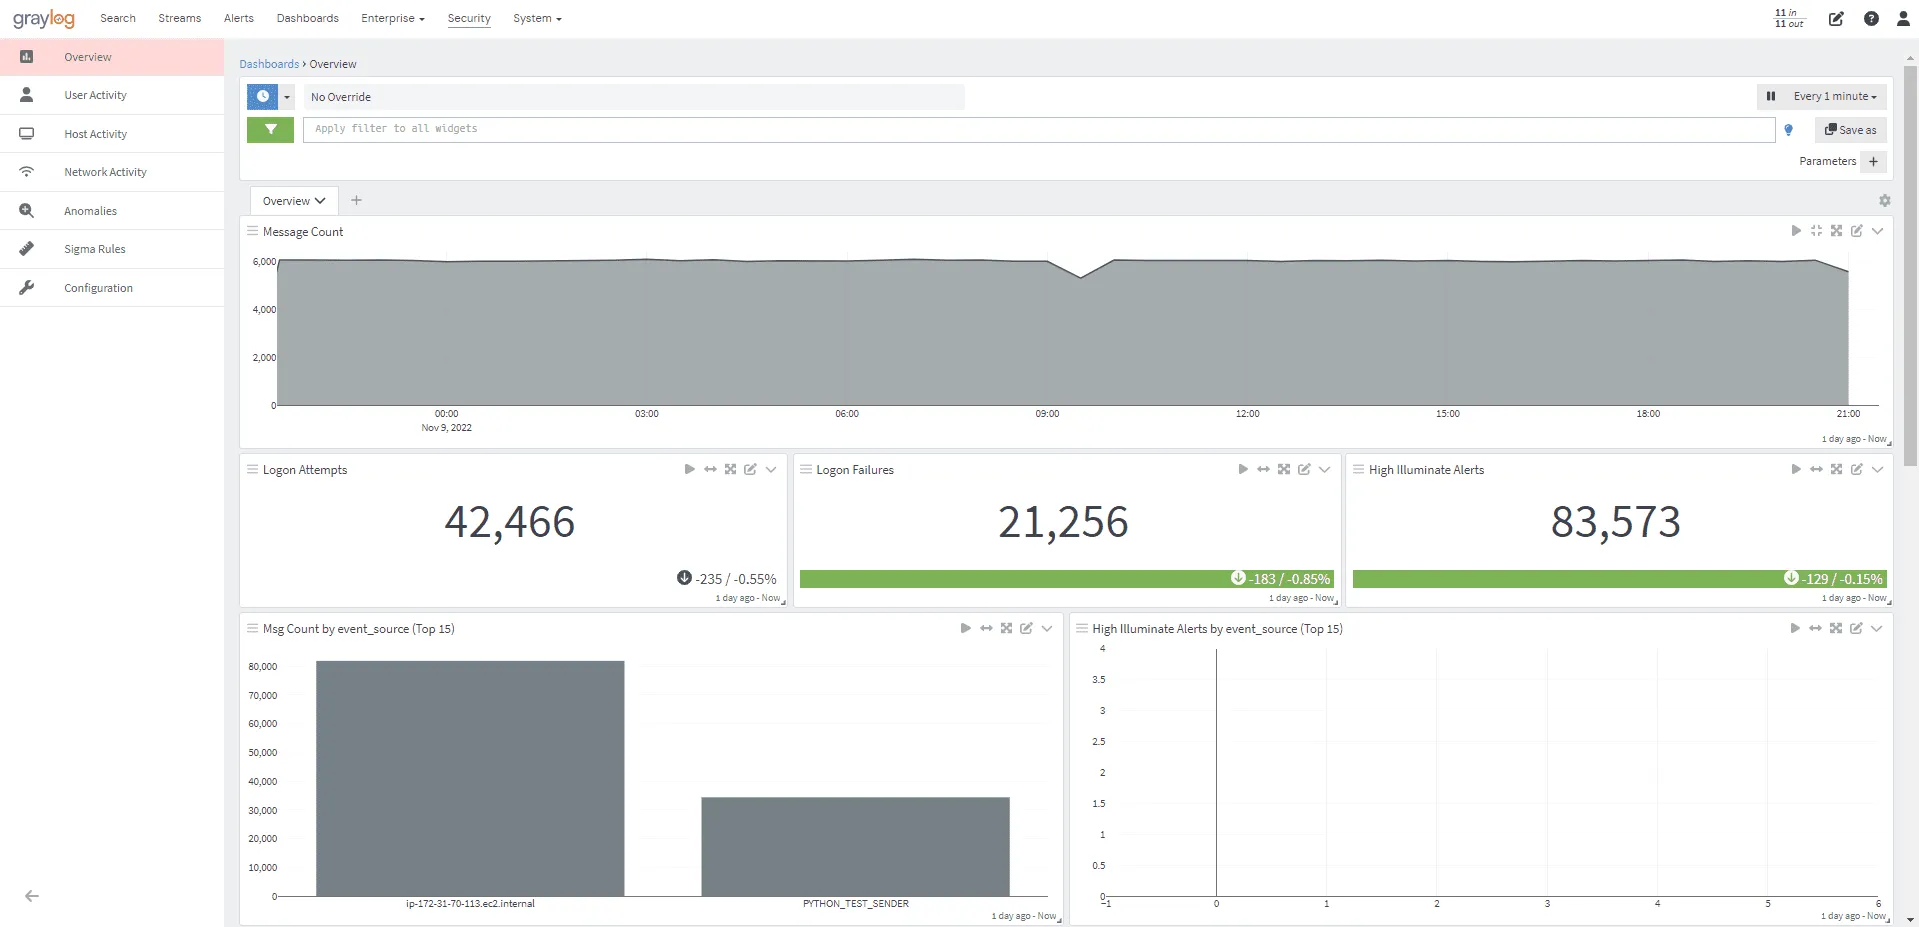
Graylog is an open-source log management and analysis platform designed to collect, store, and analyze large volumes of log data from various sources. Utilizing a pipeline system for data collection and processing, Graylog collects data from various sources, parses, transforms, and enriches it before storing it in a database, allowing for easy searching and analysis via the Graylog web interface, which provides a wide range of visualization options.
Loggly
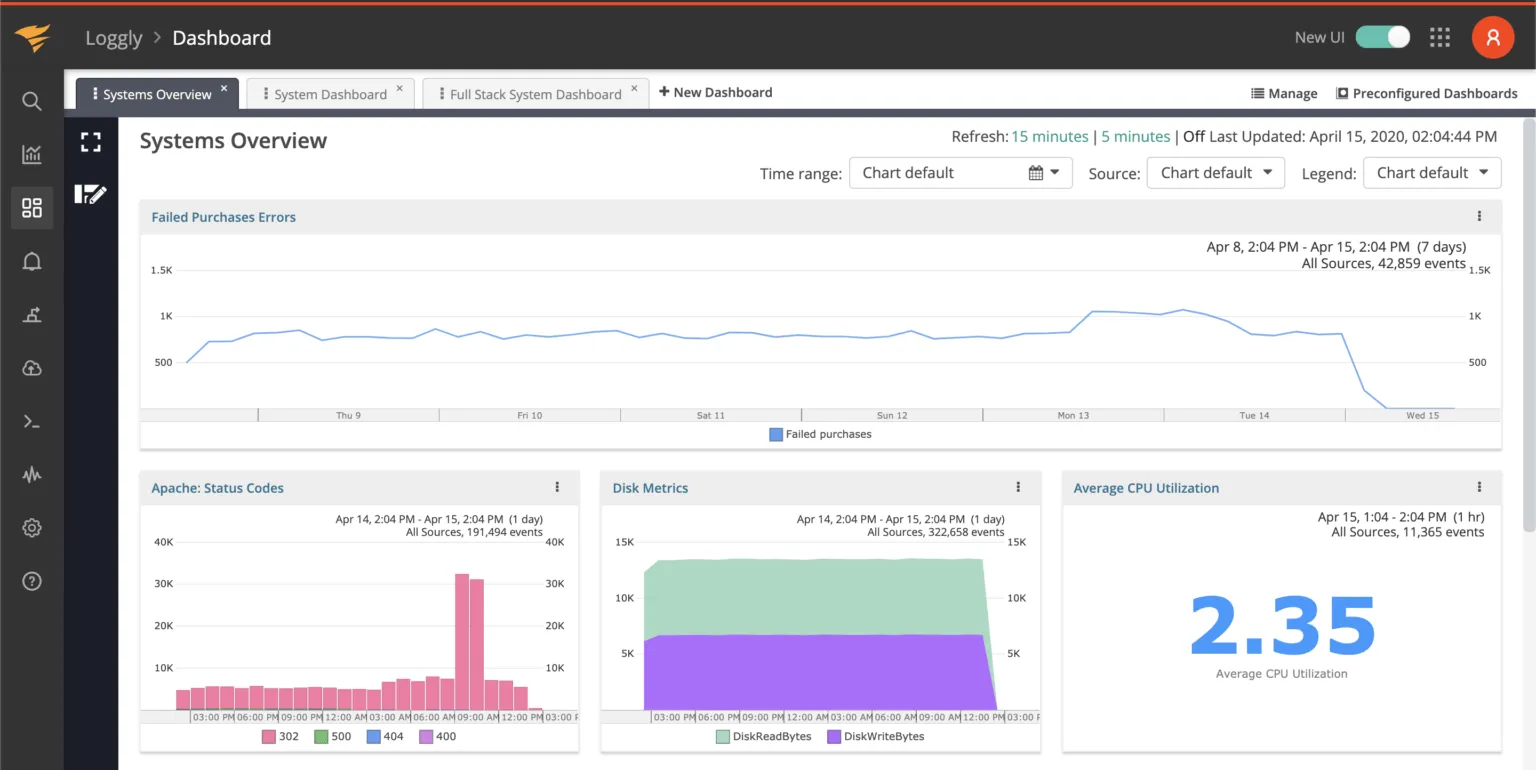
Loggly is a cloud-based log management tool focusing on simplicity and efficiency. It offers essential features for real-time log analysis, search, and basic visualizations. Ideal for small to medium-sized businesses, Loggly provides a user-friendly platform for monitoring and troubleshooting with minimal setup. Its functionality is geared towards easy handling and quick insights from log data.
Mezmo
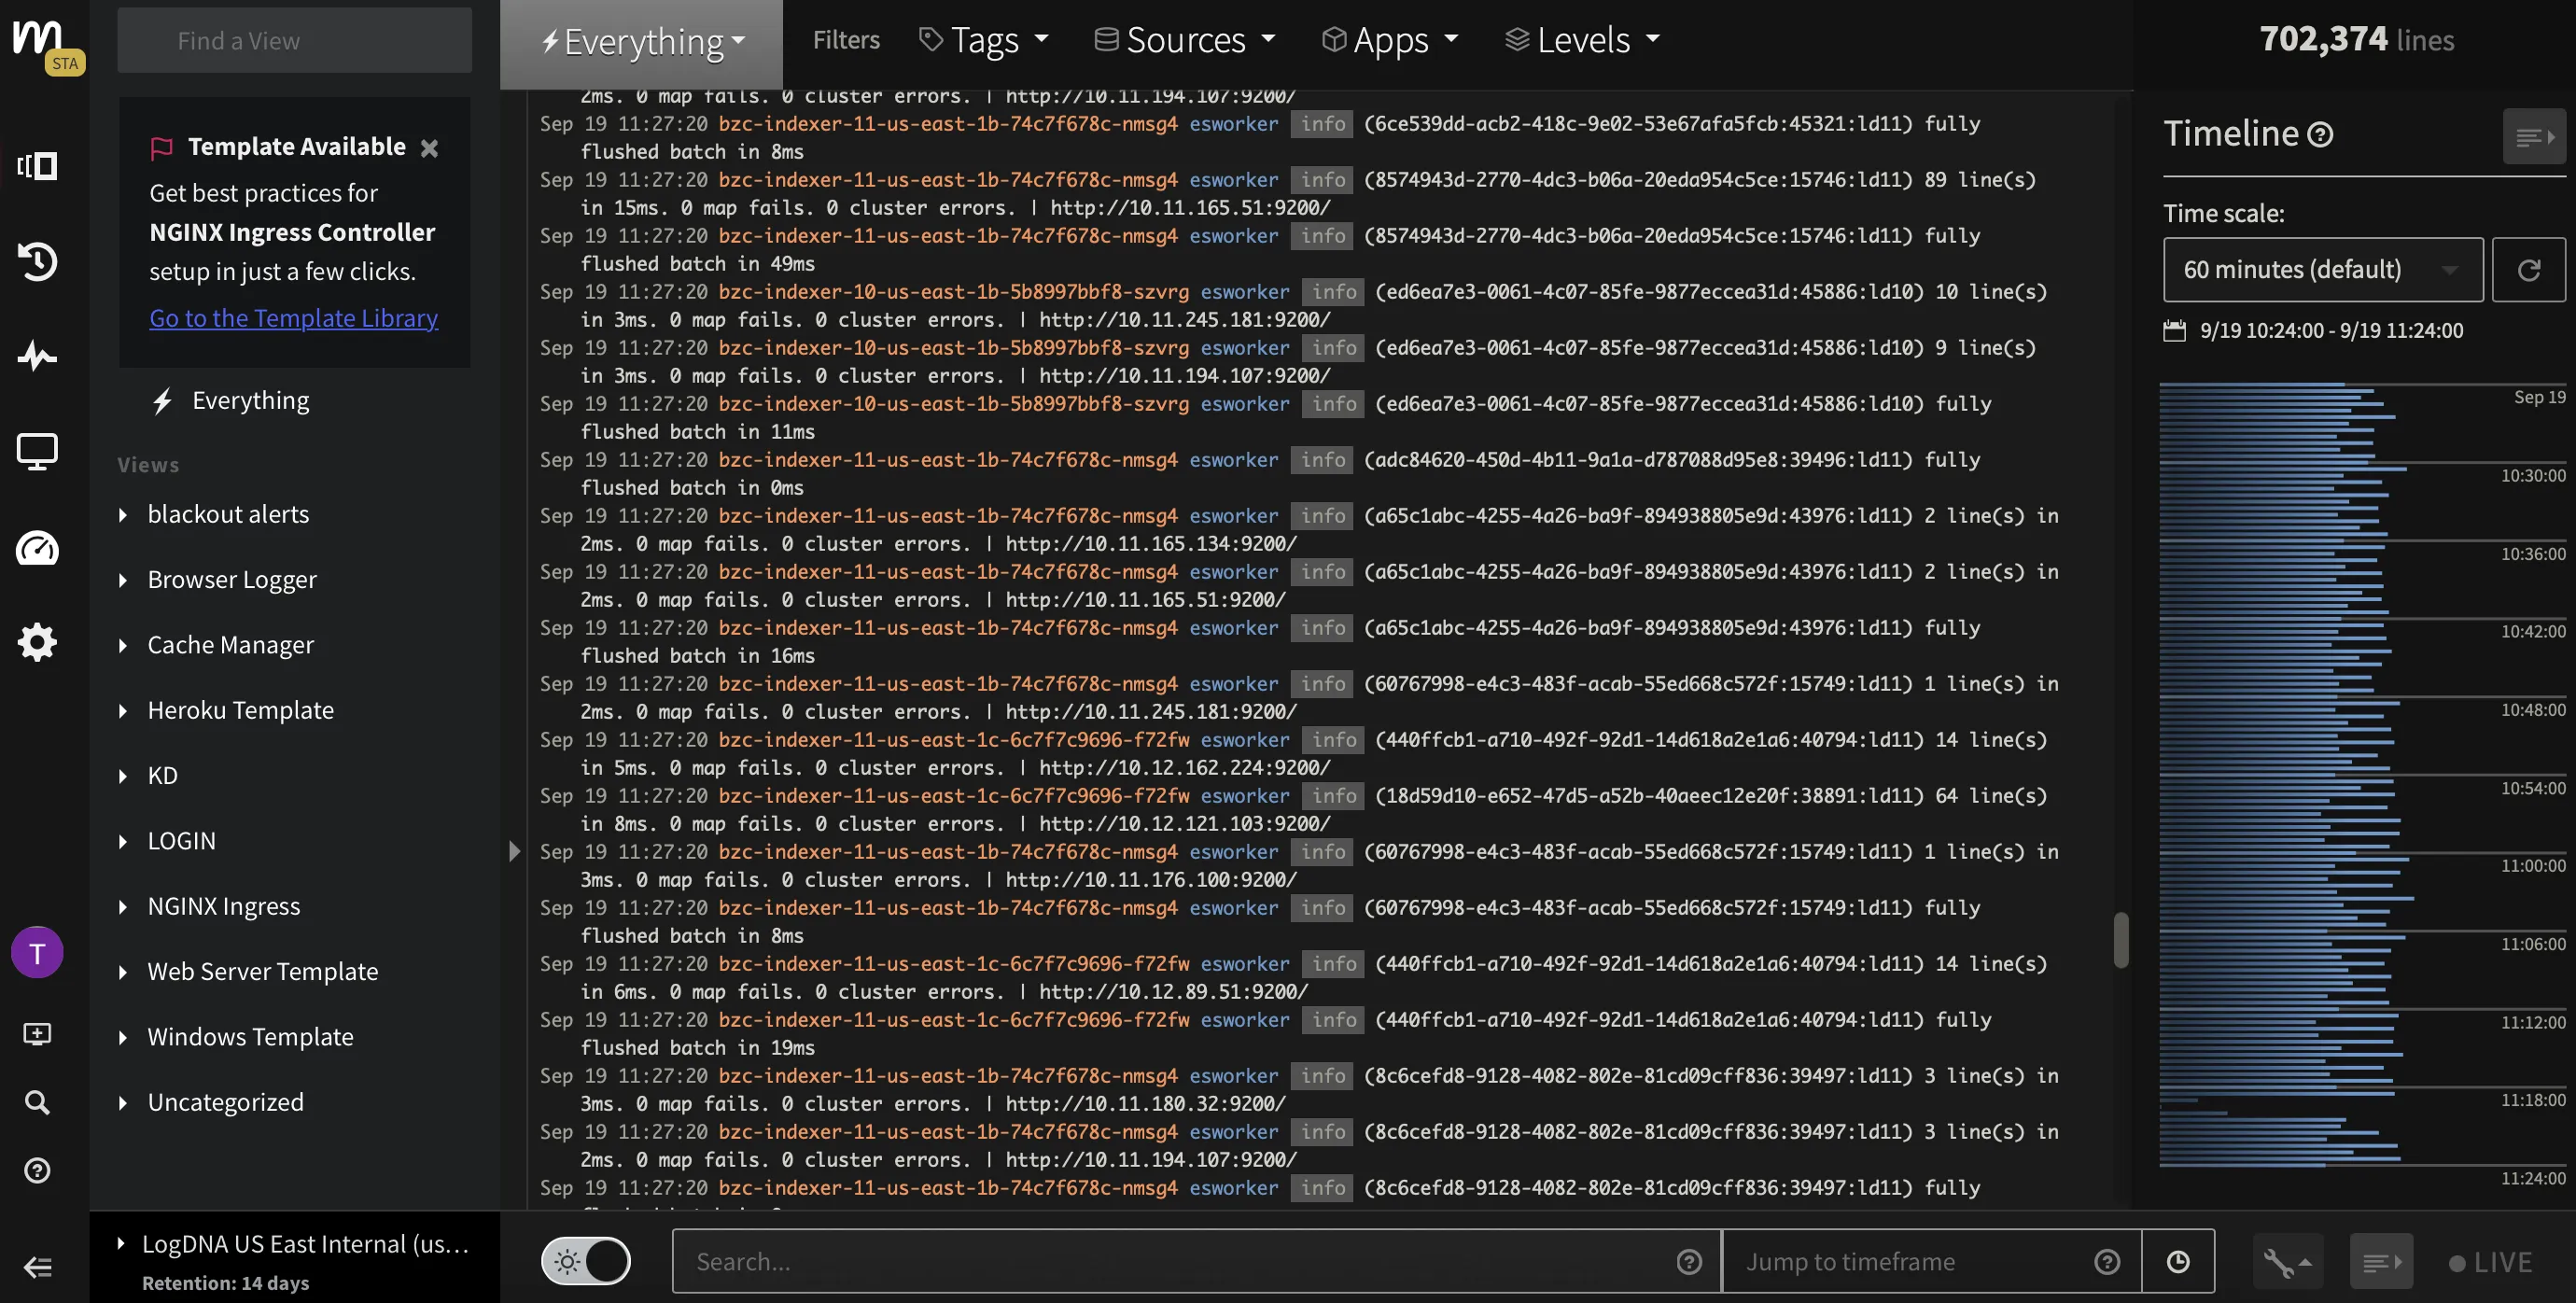
Mezmo, formerly known as LogDNA, is a modern log management solution designed for streamlined monitoring and analysis. It stands out for its high-speed log ingestion and real-time data analysis, making it ideal for dynamic, high-volume environments. Mezmo offers intuitive features such as live tailing, powerful search, and customizable alerts, all within an easy-to-use interface.
New Relic
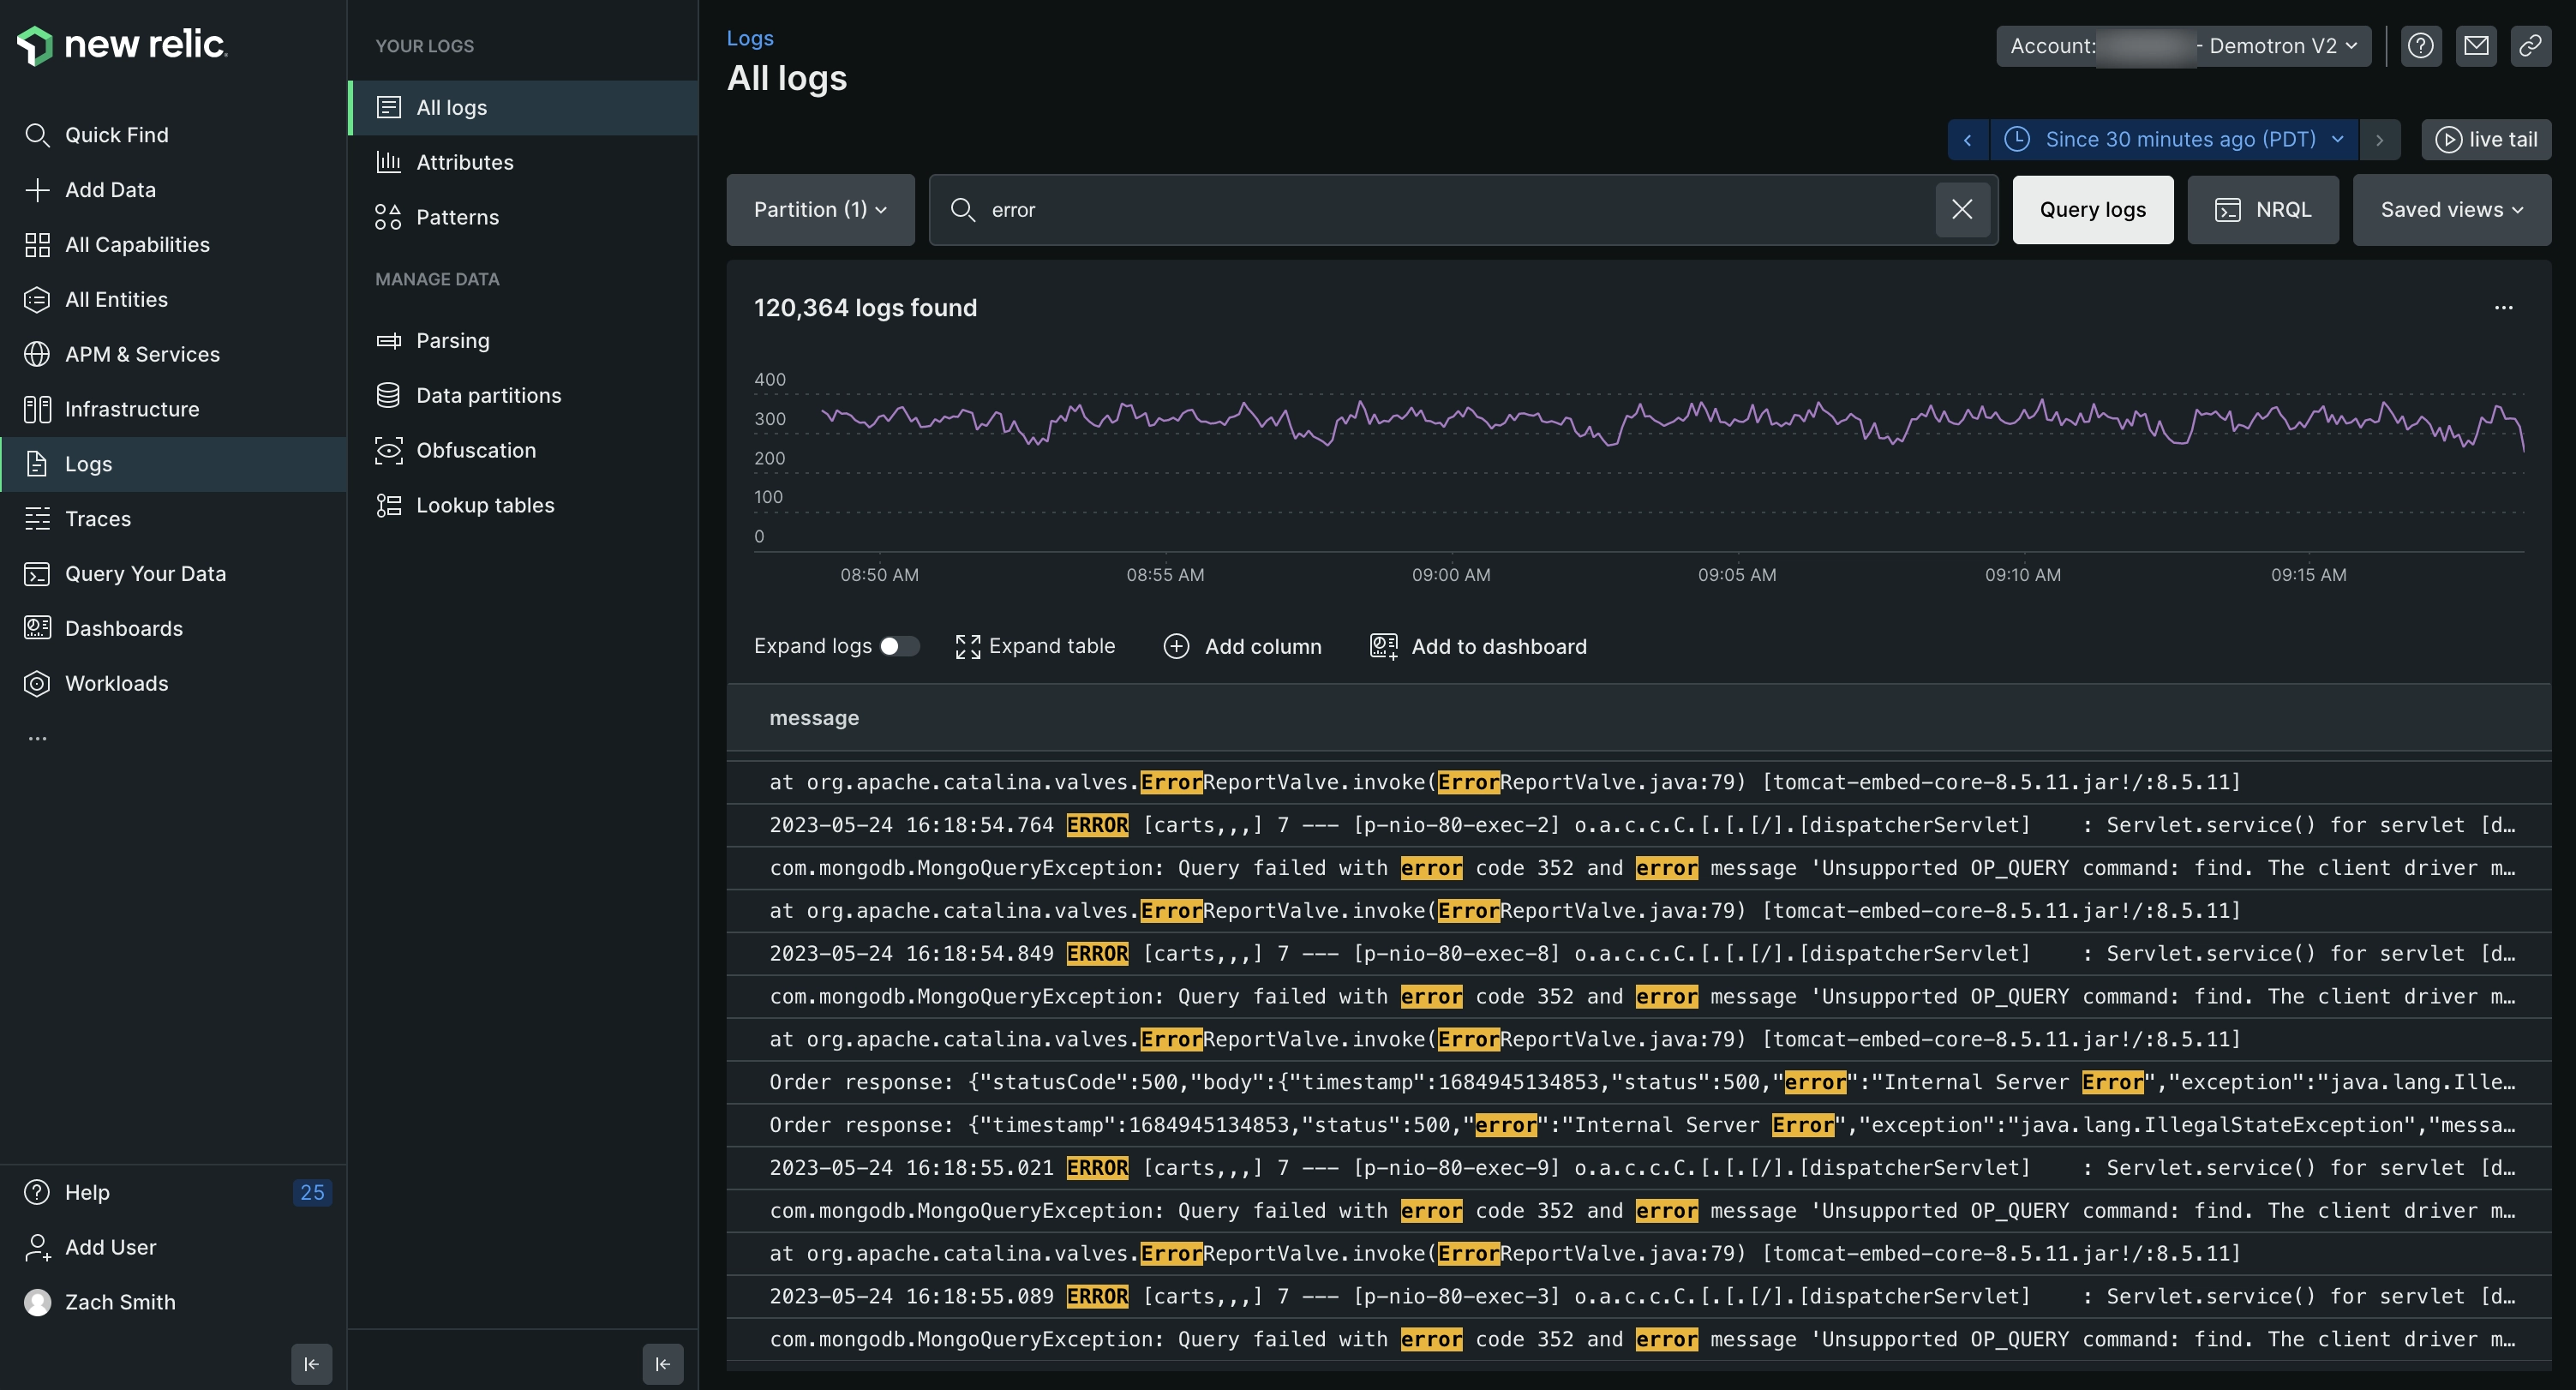
New Relic is a comprehensive log monitoring tool known for its full-stack observability and data-driven insights. It seamlessly integrates log data with application performance metrics, providing a unified view of system health. New Relic's powerful analytics engine allows for efficient log querying and real-time alerting, aiding in proactive issue resolution.
Loki by Grafana
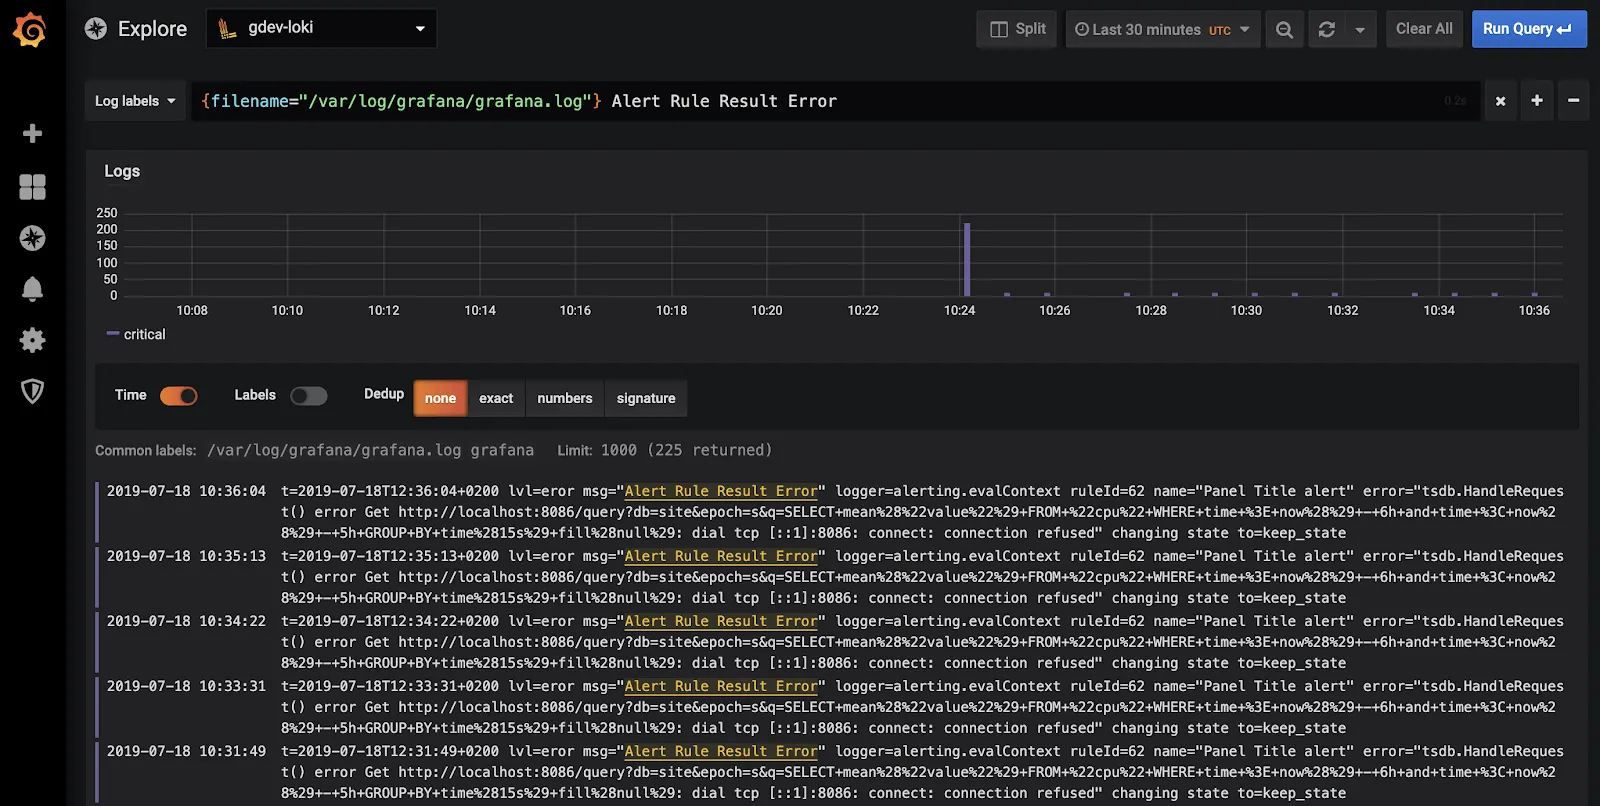
Loki by Grafana is a cost-effective and highly efficient log aggregation system, particularly designed for storing and querying massive amounts of log data with minimal resource usage. It integrates seamlessly with Grafana, enabling powerful visualization and analysis of logs alongside metrics. Loki's unique indexing approach allows for faster searches and lower operational costs.
The disadvantage of Loki is that it not very efficient when it comes to handling high-cardinality data.
ELK Stack by Elastic
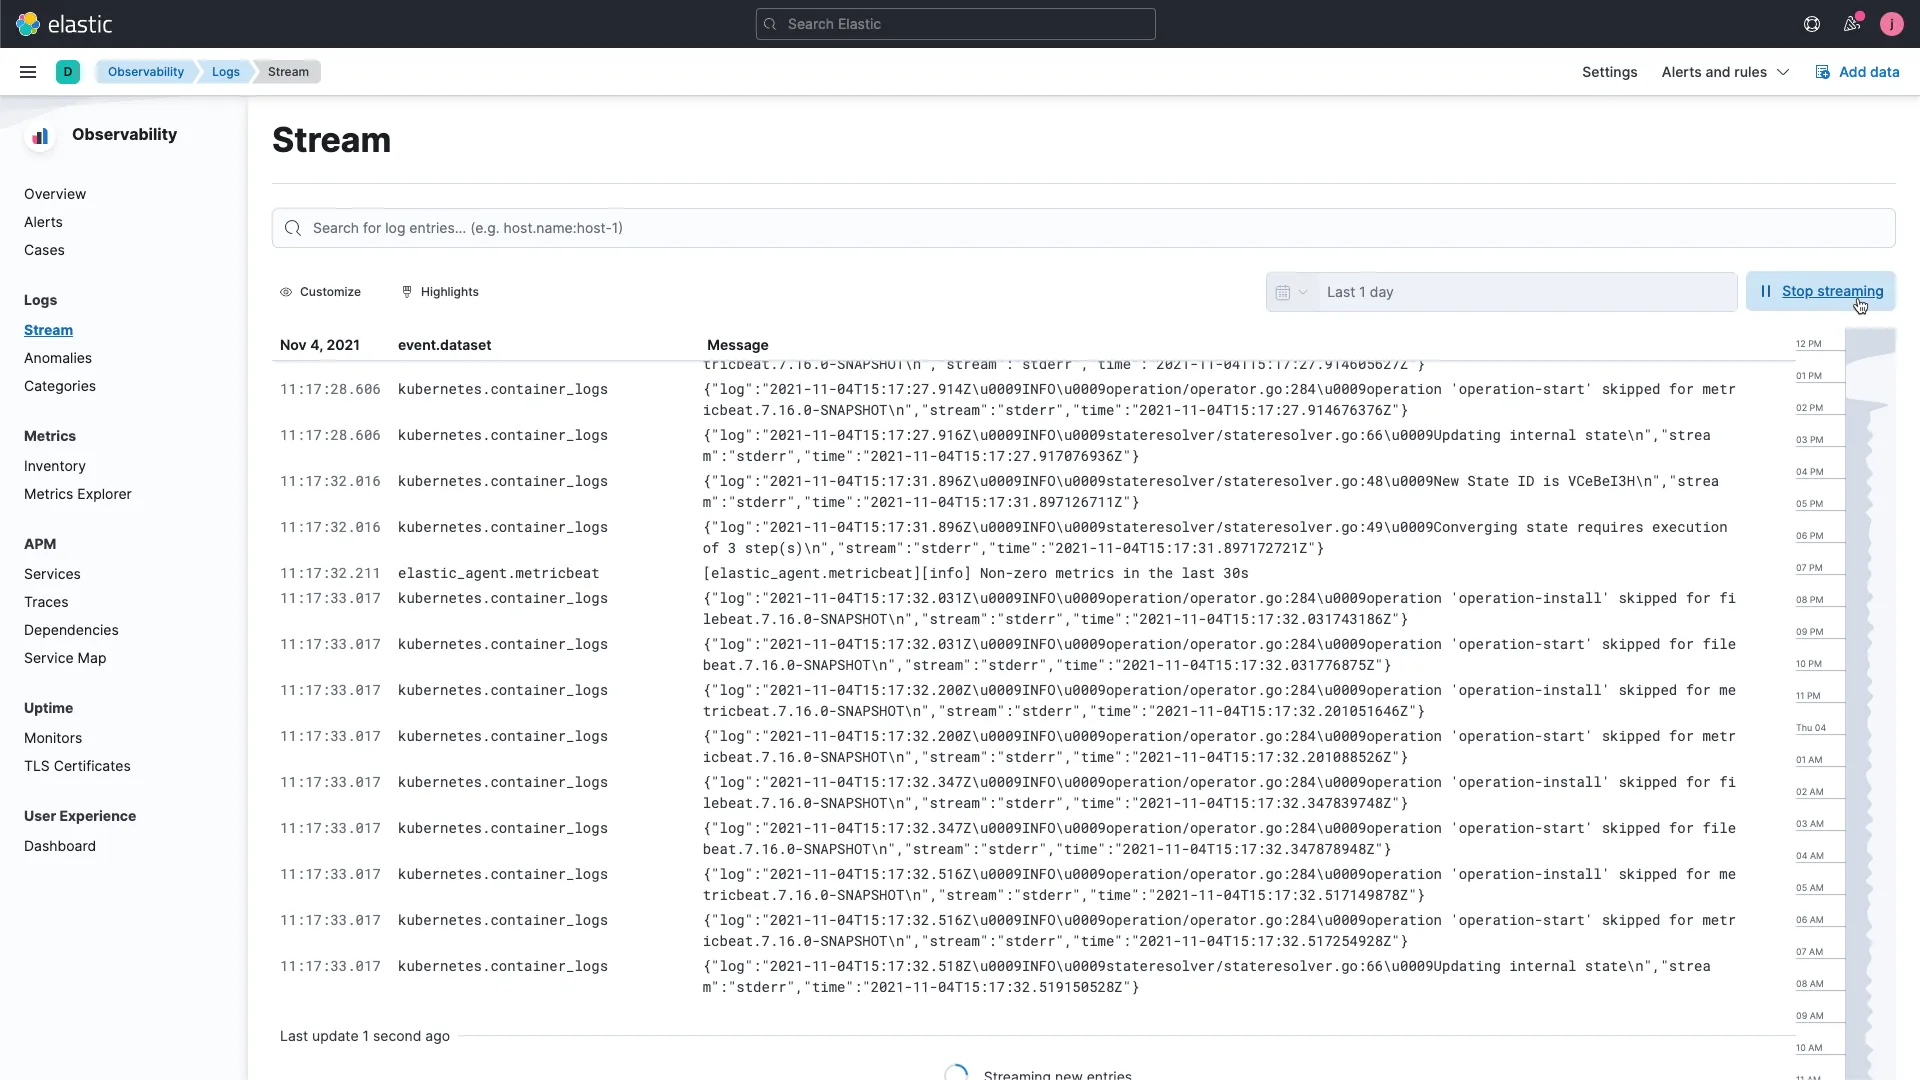
The ELK Stack, consisting of Elasticsearch, Logstash, and Kibana, is a widely used log monitoring solution known for its flexibility and powerful analytics capabilities. Elasticsearch provides efficient data indexing and search functionality, while Logstash allows for versatile data processing and aggregation from various sources. Kibana offers intuitive data visualization and dashboard creation. Together, they form a comprehensive tool for real-time data analysis, making ELK Stack ideal for in-depth log analysis, monitoring, and troubleshooting in diverse IT environments.
Sumologic
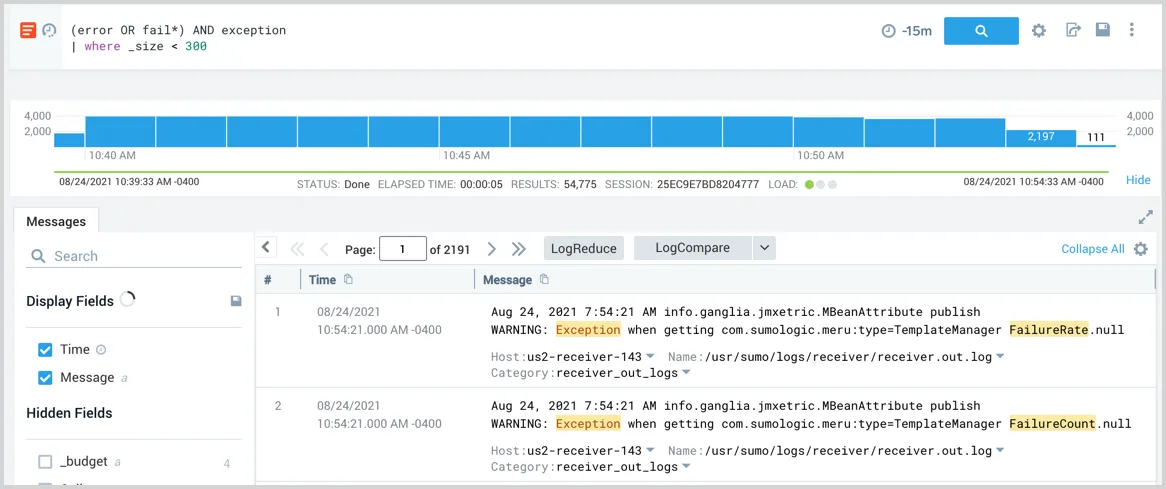
Sumo Logic is a cloud-native log management and analytics service designed for modern enterprises. It excels in handling and analyzing large volumes of machine-generated data, offering real-time visibility into IT operations and security. Sumo Logic's advanced analytics capabilities, coupled with its machine learning features, provide deep insights and pattern recognition, aiding in proactive issue resolution.
Sematext
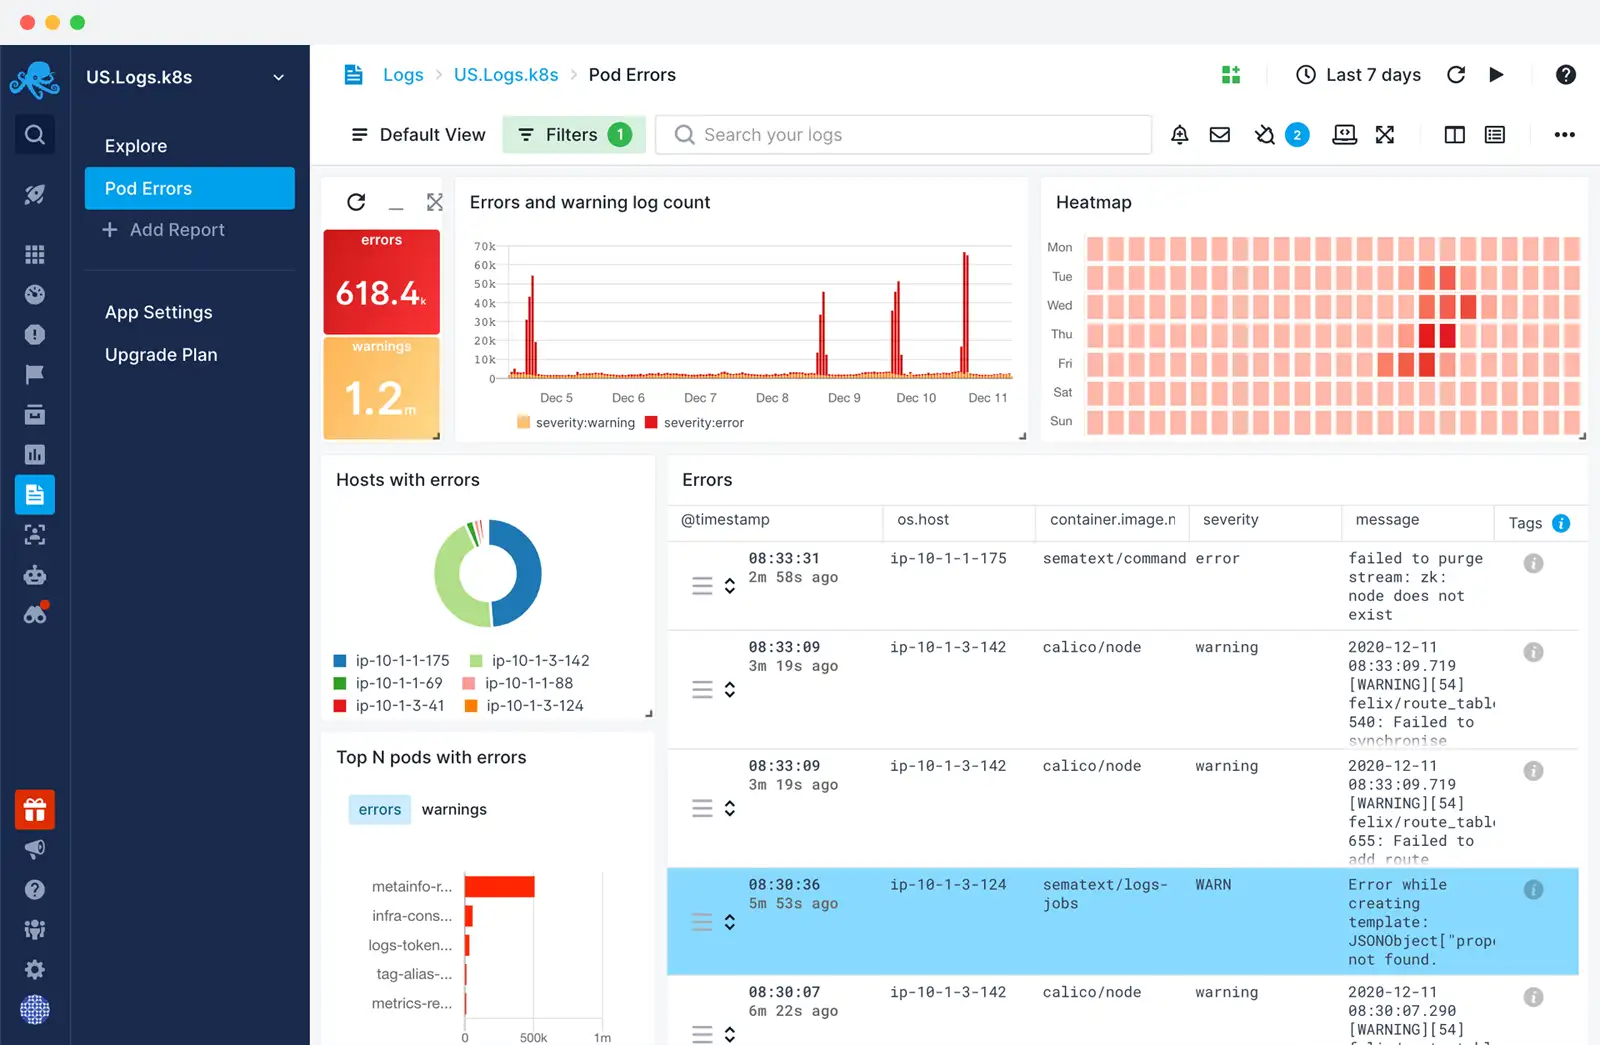
Sematext uses a combination of open-source technologies and proprietary solutions under the hood to provide its log management and monitoring services. Some of the key technologies include Elasticsearch, Apache Kafka, and Kibana.
It provides real-time log aggregation and search functionality, making it easy to navigate and analyze vast amounts of log data. Sematext stands out for its straightforward setup, user-friendly interface, and integration with various data sources and platforms.
10 Tips for someone getting started with Log Monitoring
If you're just getting started with Log Monitoring, here are 10 tips that can help you should keep in mind:
Understand Your Logging Goals: Clearly define what you want to achieve with log monitoring. This could include troubleshooting, performance monitoring, security auditing, or compliance.
Familiarize with Log Sources: Identify all potential sources of logs in your environment, such as servers, applications, databases, and network devices. Understanding the nature of logs from each source is crucial.
Choose the Right Tools: Select log monitoring tools that best fit your needs. Consider factors like scalability, ease of use, integration capabilities, and support for different log formats.
Implement Centralized Logging: Set up a centralized log management system. This makes it easier to aggregate, analyze, and store logs from various sources in a single location.
Set Up Log Aggregation and Parsing: Aggregate logs to a common format and parse them for easier analysis. This step is vital for effective log monitoring and analysis.
Prioritize and Categorize Logs: Not all log data is equally important. Prioritize logs based on their relevance to your goals and categorize them (e.g., error logs, access logs, system logs) for easier management.
Develop a Log Retention Policy: Determine how long you need to store logs based on operational and compliance requirements. Implement a log rotation and archival strategy to manage log data effectively.
Create Effective Alerts: Configure alerts for critical events to ensure prompt response. Avoid alert fatigue by fine-tuning alert thresholds and avoiding unnecessary notifications.
Regularly Review and Analyze Logs: Regular log analysis helps in proactive identification of potential issues and trends. Dedicate time for periodic reviews beyond just responding to alerts.
Stay Updated and Educate Your Team: Keep up with the latest trends and best practices in log monitoring. Educate your team about the importance of logs and train them in effective log analysis techniques.
How do I monitor Log Files - A Practical Example
One of the most important use cases in log monitoring is to monitor log files. Instead of theory, let’s go through a quick example of doing it.
Tools involved - SigNoz and OpenTelemetry Collector.
You can either use SigNoz self-host or SigNoz Cloud for this example. We will showcase this example with the SigNoz cloud.
OpenTelemetry collector is a standalone service provided by OpenTelemetry to collect, process, and export telemetry data. Here’s a full guide on OpenTelemetry Collector.
Let’s suppose you have a log file named app.log on a virtual machine. Here are the steps to collect logs from that log file and send them to SigNoz.
Step 1: Install OpenTelemetry Collector by following this guide.
Step 2: While installing the OpenTelemetry Collector, you will create a config.yaml file. In that file, add a file log receiver with the following code:
 receivers:
  ...
  filelog/app:
    include: [ /tmp/app.log ]
    start_at: end
...
start_at: end can be removed once you are done testing. The start_at: end configuration ensures that only newly added logs are transmitted. If you wish to include historical logs from the file, remember to modify start_at to beginning.
For parsing logs of different formats, you will have to use operators; you can read more about operators here.
For more configurations that are available for filelog receiver, please check here.
Step 3: Next, we will modify our pipeline inside otel-collector-config.yaml to include the receiver we have created above.
service:
    ....
    logs:
        receivers: [otlp, filelog]
        processors: [batch]
        exporters: [clickhouselogsexporter]
Step 4: Now, we can restart the Otel collector container so that new changes are applied.
If the above configuration is done properly, you will be able to see your logs in SigNoz UI.
Choosing the right Log Monitoring Tool
Choosing the right log monitoring tool involves evaluating several key factors to ensure it meets your organization's needs:
Assess Functionality and Features: Determine if the tool offers essential features such as real-time monitoring, advanced search, alerting, and data visualization. It should cater to your specific requirements like error tracking, performance monitoring, or security analysis.
Consider Scalability: The tool should be able to scale with your infrastructure. As your system grows, the tool should handle increased data volume and complexity without performance degradation.
Evaluate Integration Capabilities: It's important that the tool integrates seamlessly with your existing tech stack. Compatibility with various data sources, platforms, and other monitoring tools adds to its efficacy.
Check for User-Friendly Interface: A tool with an intuitive and easy-to-navigate interface reduces the learning curve and improves efficiency in monitoring tasks.
Review Support and Community: Especially for open-source tools, a strong community and responsive support are crucial for troubleshooting and keeping the tool up-to-date.
Consider Open Source Options: Open source tools offer customization, community-driven enhancements, and cost savings. However, they may require more in-house technical expertise. Evaluate if this aligns with your team's capabilities and long-term strategy.
Unified View with Three Signals: Opt for tools that integrate logs, metrics, and traces in a single pane. This unified approach simplifies monitoring, provides comprehensive system visibility.
Compatibility with OpenTelemetry: Ensure the tool supports OpenTelemetry, a set of APIs and standards for telemetry data like traces, metrics, and logs. This compatibility is key for future-proofing your monitoring setup and maintaining flexibility.
Consider Cost: Finally, evaluate the cost against your budget, including any setup, maintenance, or additional feature costs.
SigNoz is an open-source OpenTelemetry-native Log monitoring tool that might be a great choice for you. It also offers a cloud service in case you don't want to maintain it yourself. It's highly scalable datastore of ClickHouse makes it very performance in log monitoring at scale.
Getting started with SigNoz
SigNoz cloud is the easiest way to run SigNoz. Sign up for a free account and get 30 days of unlimited access to all features.
You can also install and self-host SigNoz yourself since it is open-source. With 16,000+ GitHub stars, open-source SigNoz is loved by developers. Find the instructions to self-host SigNoz.


