Using Kubectl Logs | Complete Guide to viewing Kubernetes Pod Logs
Information about the containers and pods on your cluster may be obtained using the kubectl logs command. These logs allow you to know the performance of your applications, whether they are failing or healthy, and are particularly useful for debugging and troubleshooting purposes.

In this article, we will see how to use the kubectl logs command to get information from existing resources in a Kubernetes cluster.
Before we dive in, let's first take a quick look Kubernetes architecture and logging.
Kubernetes Architecture and Logging
Kubernetes, a powerful container orchestration system, is designed to manage complex containerized applications. At the heart of its logging mechanism is the concept that each pod in Kubernetes represents a group of one or more containers. These containers produce logs to help with debugging and monitoring.
Logging in Kubernetes is primarily focused on two types of logs: container logs and system logs. Container logs capture the output of a container's stdout and stderr. Kubernetes enables the aggregation of these logs at the pod level, facilitating easy access and management. System logs, on the other hand, provide insights into the Kubernetes nodes themselves, helping in understanding the activities and health of the Kubernetes system.
Kubernetes does not provide a native storage solution for log data, but it allows for log data to be collected and stored using external logging solutions. This flexibility lets users integrate with various logging backends and platforms, enhancing log management and analysis capabilities.
What is kubectl?
Kubectl is pronounced Kube: c-t-l, Kube-control or as kube-cuttle.
It is a command-line tool for Kubernetes that lets you control or communicate with Kubernetes clusters or resources you create by using the Kube API.
Take a look at how this works in the background.
You issue a kubectl command, for example, kubectl logs. Kubectl connects to the Kube API server, which verifies and authenticates the request you made. The Kube API server, in return, responds to you as a client/user with the requested data or information after it has completed authentication and validation. This requested data is obtained from the etcd server, which serves as the Kubernetes database. Etcd server stores information regarding the cluster, such as the nodes, pods, configs, secrets, etc.
Every information presented to you when you run a kubectl command is gotten from the etcd server. The Kube API server acts as a messenger for delivering your requests. This is how kubectl as a command line tool lets you interact with your cluster or resources.
For more insight, it would be beneficial to look at the Kubernetes architecture.
What is a log?
Simply put, a log is a text record of an event or incident that took place at a specific time.
There are few possibilities of figuring out what went wrong when your software crashes, and you need logging information. This is why logs are very important.
What is kubectl log command?
An integrated tool for reading logs is kubectl log. It might not be the greatest choice for production scenarios because this is a manual process. Your business needs will determine which tool is best for viewing your Kubernetes logs.
The kubectl log command is the command that displays information about the background activities or events completed or ongoing in your resources. It is used to view container logs for debugging. Because container applications are packaged in pods, if an application is failing or misbehaving, the next line of action would be to check the logs of the container(s) in that pod to know why.
Debugging your Kubernetes resources depends on your logs. With the knowledge provided by this command, you can restart your pod by making the necessary adjustments or repairs.
SigNoz to be 2.5x faster than ELK and consumed 50% less resources.
Kubectl logs quick reference
Here is an outline of commonly used kubectl logs commands and what they do:
- List all the pods currently running in the default namespace
kubectl get pods
- Print the logs for a pod
kubectl logs [pod name]
- Follow the logs in a pod
kubectl logs -f [pod name]
- Follow the logs for a particular container in a pod
kubectl logs [POD name] [-c CONTAINER name] [--follow] [flags]
- Display all container logs in a pod
kubectl logs [pod-name] --all-containers=true
- Output the logs for a pod into a file
kubectl logs <pod_name> > file-name.log
- Obtain logs for a Pod that was previously running
kubectl logs -p [pod-name]
Kubectl Logs Command Quick Guide With Examples
If you want to access the logs for a specific resource, you can get a list of the resources that are part of your cluster.
To get a list of available pods in your cluster, run the below command:
$ kubectl get pods

event-simulator                 1/1     Running             0             18m
nginx-76d6c9b8c-8f9m7           1/1     Running             0             69s
pod                             0/1     ContainerCreating   0             5s
pod-example                     0/1     ImagePullBackOff    0             20m
sample-flask-5d67d8d556-t8t77   0/1     ErrImageNeverPull   0             26m
sample-flask-645d95f4b4-vbztg   0/1     ErrImageNeverPull   0             29m
webapp                          1/1     Running             4 (39d ago)   42d
webapp-release-0-5              1/1     Running             4 (39d ago)   42d
After getting a list of all existing pods, the logs of those pods can be seen individually by running
# This returns a snapshot of the logs from the pod

kubectl logs [pod name]
If you want to stream or follow the logs in a pod, you can use the below command
$ kubectl logs -f event-simulator

[2022-11-29 04:12:17,262] INFO in event-simulator: USER3 is viewing page1
[2022-11-29 04:12:18,264] INFO in event-simulator: USER4 logged out
[2022-11-29 04:12:19,266] INFO in event-simulator: USER2 is viewing page2
[2022-11-29 04:12:20,268] INFO in event-simulator: USER2 is viewing page2
[2022-11-29 04:12:21,270] INFO in event-simulator: USER4 logged out
[2022-11-29 04:12:22,271] WARNING in event-simulator: USER5 Failed to Login as the account is locked due to MANY FAILED ATTEMPTS.
[2022-11-29 04:12:22,272] INFO in event-simulator: USER1 is viewing page3
[2022-11-29 04:12:23,274] INFO in event-simulator: USER3 is viewing page1
[2022-11-29 04:12:24,276] INFO in event-simulator: USER4 is viewing page1
[2022-11-29 04:12:25,278] WARNING in event-simulator: USER7 Order failed as the item is OUT OF STOCK.
[2022-11-29 04:12:25,278] INFO in event-simulator: USER1 logged out
[2022-11-29 04:12:26,280] INFO in event-simulator: USER4 is viewing page1
[2022-11-29 04:12:27,282] WARNING in event-simulator: USER5 Failed to Login as the account is locked due to MANY FAILED ATTEMPTS.
[2022-11-29 04:12:27,283] INFO in event-simulator: USER2 is viewing page2
[2022-11-29 04:12:28,285] INFO in event-simulator: USER1 logged out
The -f flag helps you to stream the log's life. As events happen in that resource, it is streamed on your screen. If you do not want to follow the logs, you can administer the command without the -f flag, as shown previously.
If there are multiple containers running in a pod, it is advisable to specify the name of the container you need logs from in your kubectl logs command otherwise, the command will fail.
To follow the logs for a particular container in a pod, use the below syntax:
kubectl logs [POD name] [-c CONTAINER name] [--follow] [flags]
- You can refer to the Kubernetes log documentation to learn more about different flags that can be used.
To display all containers logs in a pod, use the below command
kubectl logs [pod-name] --all-containers=true
- The container name is not required if the pod only contains one container.
By adding the -p flag, you can obtain logs for a Pod that was previously running.
kubectl logs -p [pod-name]
Use Cases of kubectl logs command
Here are some practical examples and use cases of kubectl logs, particularly useful in troubleshooting common issues:
Debugging Crashing Pods: If a pod is frequently crashing or restarting, use kubectl logs
pod-nameto check the logs for error messages or stack traces. This can help identify configuration errors, missing dependencies, or runtime exceptions.kubectl logs my-crashing-podMonitoring for Specific Errors or Warnings: In a production environment, you might want to monitor specific errors or warnings. You can use kubectl logs with grep to filter out specific patterns.
kubectl logs my-app-pod | grep "ERROR"Tail Logs in Real-Time: For real-time monitoring, especially useful during a deployment or when troubleshooting live issues, you can tail the logs.
kubectl logs -f my-app-podFetching Logs from a Specific Container in a Multi-Container Pod: When dealing with pods that have multiple containers, you can specify the container from which to fetch logs.
kubectl logs my-pod -c my-containerAggregate Logs for a Set of Pods: Using label selectors, you can aggregate logs for a specific set of pods, useful for getting an overview of a service or application.
kubectl logs -l app=my-appHistorical Logs with Previous Flag: If a pod was restarted, you can view the logs of its previous instance, which is crucial for understanding why a restart occurred.
kubectl logs my-restarted-pod --previousExporting Logs for Analysis: For deeper analysis, you might want to export logs to a file or an external analysis tool.
kubectl logs my-app-pod > my-app-logs.txtCheck logs in specific scenarios: You can also check logs of pods in scenarios that need further investigating.
Logs from Pods That Have Completed or Failed
For pods that have already completed their lifecycle (like Jobs or CronJobs), you can still fetch logs to understand what happened.Investigating Slow Performance
Sometimes applications may become slow, and checking logs can reveal long-running requests or performance bottlenecks.Checking for Configuration Issues
Configuration errors often show up in the application logs, making kubectl logs a first point of investigation.
Kubernetes logs in production environment
As discussed, you can get logs of containers using the kubectl log command, this is a manual log inspection that happens mostly locally.
In production environments, when you have a stable cluster deployed and running, it's possible to forget the logs and assume everything is working fine easily. Also, since containers in pods are ephemeral, in situations where the pods get restarted, you lose logs for those containers, which may contain critical data to be analyzed later.
A helpful solution to this problem would be to use a distributed logging solution like Signoz.
Collecting Kubernetes logs in SigNoz
SigNoz is a full-stack open source Application Performance Monitoring tool that you can use for monitoring logs, metrics, and traces. Having all the important telemetry signals under a single dashboard leads to less operational overhead. Users can also access telemetry data with richer context by correlating these signals.
SigNoz uses a columnar database ClickHouse to store logs, which is very efficient at ingesting and storing logs data. Columnar databases like ClickHouse are very effective in storing log data and making it available for analysis.
Big companies like Uber have shifted from the Elastic stack to ClickHouse for their log analytics platform. Cloudflare too was using Elasticsearch for many years but shifted to ClickHouse because of limitations in handling large log volumes with Elasticsearch.
SigNoz uses OpenTelemetry for instrumenting applications. OpenTelemetry, backed by CNCF, is quickly becoming the world standard for instrumenting cloud-native applications. Kubernetes also graduated from CNCF.
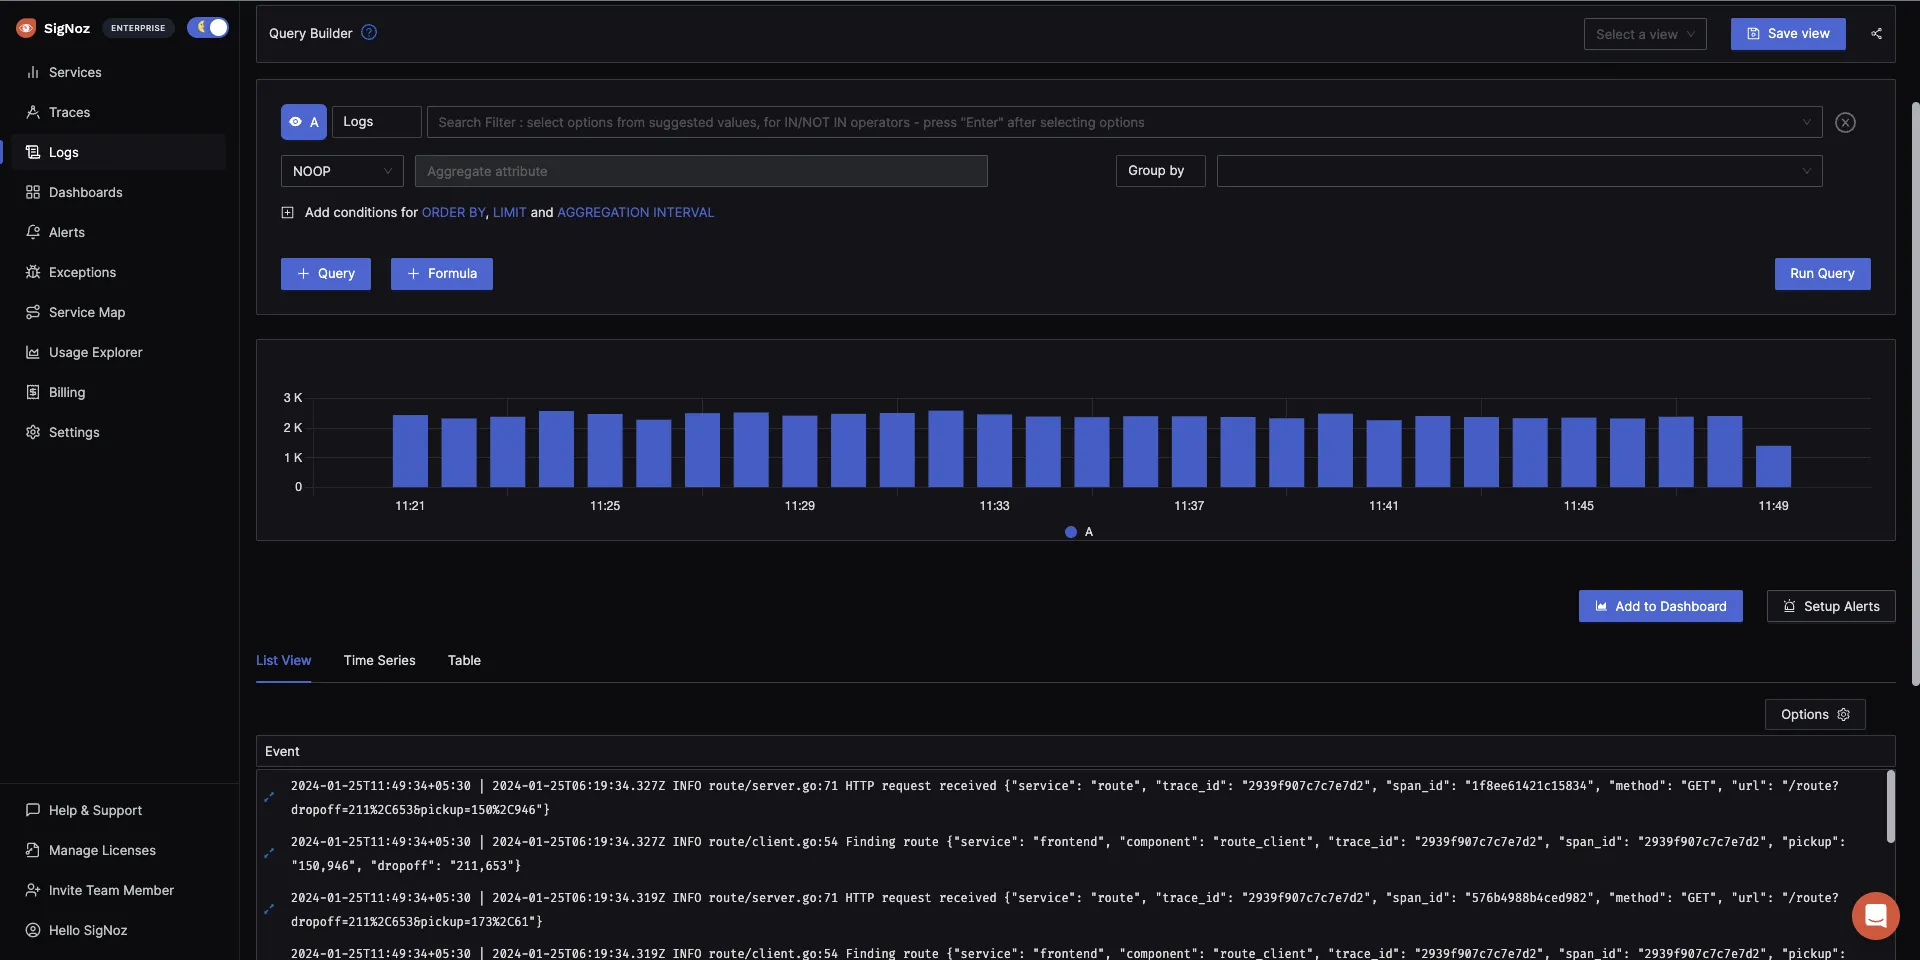
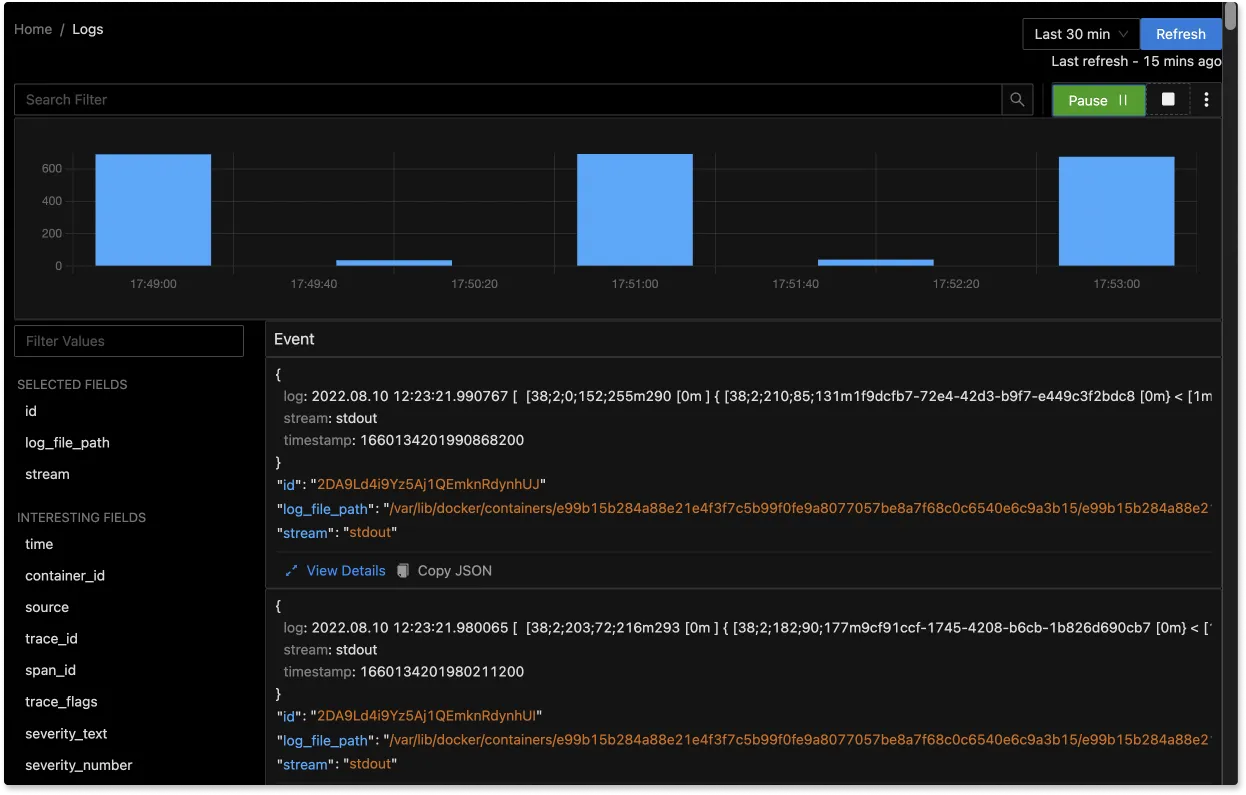
The logs tab in SigNoz has advanced features like a log query builder, search across multiple fields, structured table view, JSON view, etc.

You can also view logs in real time with live tail logging.

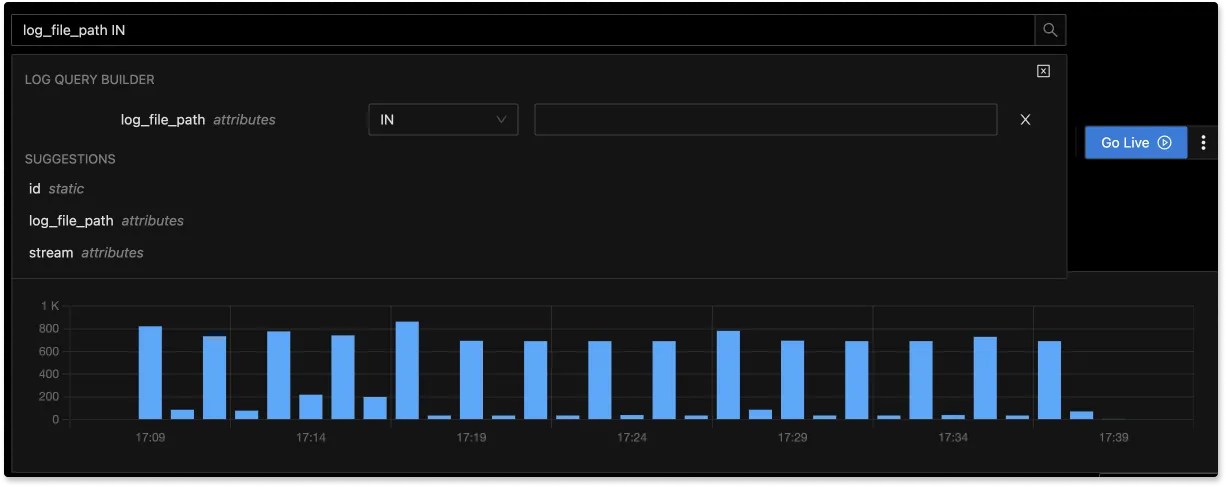
With advanced Log Query Builder, you can filter out logs quickly with a mix and match of fields.

Getting started with SigNoz
SigNoz cloud is the easiest way to run SigNoz. Sign up for a free account and get 30 days of unlimited access to all features.
You can also install and self-host SigNoz yourself since it is open-source. With 16,000+ GitHub stars, open-source SigNoz is loved by developers. Find the instructions to self-host SigNoz.
Related Posts


