Gathering data with the OpenTelemetry Collector
Join Nočnica Mellifera and Pranay as they discuss architecting and collecting data with the OpenTelemetry Collector. We discuss using Apache Kafka queues to handle OTLP data, and why you probably shouldn't push OTel data straight to Postgres.
Below is the recording and an edited transcript of the conversation.
Find the conversation transcript below.👇
Nica: Hi everybody! If you're seeing this we're starting up we'll get started in just a moment here.
This is the first in a series of OpenTelemetry webinars. This series will be product-agnostic, and we will not be focusing on SigNoz specifically. We promise this will not be an extended sales pitch; instead, we will be discussing high-level concepts in OpenTelemetry engineering.
I am joined today by Pranay, co-founder and CEO of SigNoz. We will be discussing some basic concepts of the OpenTelemetry collector. We have drawn a few questions from the CNCF Slack channel, and those specific questions have already been answered. Therefore, we will not be addressing those questions directly.
We will also not be discussing the specific setups that people mentioned in their questions, but we will be covering similar topics that have been asked about on Reddit and in the CNCF Slack channel.
We would like to discuss these comments in general and what they suggest. The first comment was from Mike on the CNCF Slack, who said,
"I’m new to OpenTelemetry, I was thinking that the collector was backed by some sort of data storage but I'm not finding that, I'm just seeing statements here to the contrary if it just spans in the data and passes it on elsewhere."
Pranay, I think this is one of the places where beginners start, thinking that OpenTelemetry is a whole project from collecting data all the way to presenting a cool dashboard with all your metrics and maybe even sending you like alert emails. However, that is not the reality.
OpenTelemetry is a set of APIs, SDKs, and tools that make it easy to instrument your applications and collect telemetry data. It does not provide any data storage or visualization capabilities. These are provided by other tools and frameworks, such as Prometheus, Grafana, and Jaeger.
We hope this clarifies the situation.
Pranay: That is correct. I believe that one thing which people often fail to realize is that OpenTelemetry is primarily focused on instrumentation SDKs, which are used to send data from applications to the Collector, and then from the Collector to other backends. This is where the scope of the project ends, as it does not include things like data storage and visualization
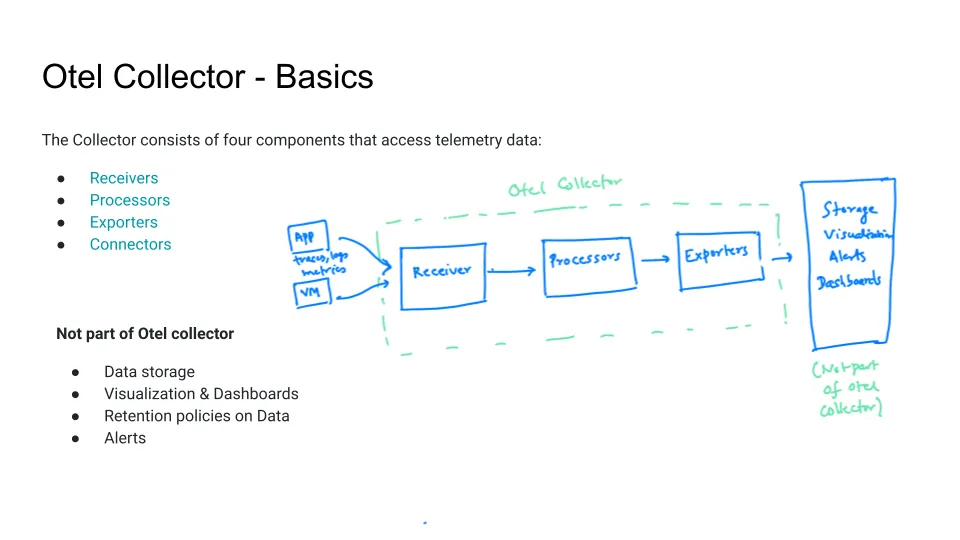
or how to set alerts. SRE Engineers and DevOps Engineers use a variety of tools to configure their systems. The OpenTelemetry collector is a data pipeline processor that can be used to collect, process, and export data from applications. The collector has three key components: receivers, processors, and exporters.
Receivers collect data from applications. This data can include traces, logs, and metrics. Processors can be used to transform the data, for example, by removing sensitive information. Exporters send the data to other sources, such as vendor backends, open source projects, or databases.
The OpenTelemetry collector does not store data. It is responsible for collecting, processing, and exporting data, but it does not store the data or create dashboards. This is the responsibility of other projects, such as SigNoz and Grafana.
Nica: The OpenTelemetry protocol does not specify how data is stored. It is only concerned with encoding and transporting data. It does not imply how data will be stored relationally, how rich logs or events will be stored, or how spans will be collected and connected to traces. These are all implementation details that are left up to the user.
Pranay: OpenTelemetry specifies the wire format, which is a standard way of encoding telemetry data. Any backend or storage layer that understands the wire format can store and process telemetry data. This is important to note because many people are under the impression that OpenTelemetry can provide dashboards and other visualizations out of the box.
This is not the case. OpenTelemetry is a data collection and transport protocol, not a visualization tool. To create dashboards and other visualizations, you will need to use a separate tool or service.
Nica: There are some opinionated aspects, especially when it comes to processes and exporters, about how data is stored. This can help ensure that your data is relatively efficient, both in terms of how it is finally stored and how much bandwidth it uses when sending data.
For example, you can batch data or compress it, and you can also average metrics with processes to reduce the number of metric sends. However, this does not specify how the data is stored.
This is another question that we will not get into the specifics of, but I will touch on it in general. Harsh Thakur asked on the CNCF Slack:
"I’d like to use OTLP Gateway but I have this issue on finding a fault-tolerant way of getting into Kafka. If I set up an OpenTelemetry collector on the server side to receive OTLP and then export it, I'm afraid those OTel collectors would be a single point of failure."
This is a fairly specific question, but it is something that we often come across when discussing engineering with a collector. It is like saying, "I'm starting to get worried about where the collector sits in the architecture." The thread that follows up with this question makes it a little clearer that it is quite an engineering challenge to have OTLP data go into Kafka and come back out.
After addressing these questions, we may return to the following concern: "I am concerned that some of my data may be located far from my cluster and that it will be sent to the collector that I have already set up. I am worried that there will be errors, lag, and a lot of internal network traffic. Can I set up a queue or another service within my architecture to address this?"
My understanding is that this is generally not necessary because collectors cannot communicate with each other, but we can discuss some basic architectural considerations with the collector.
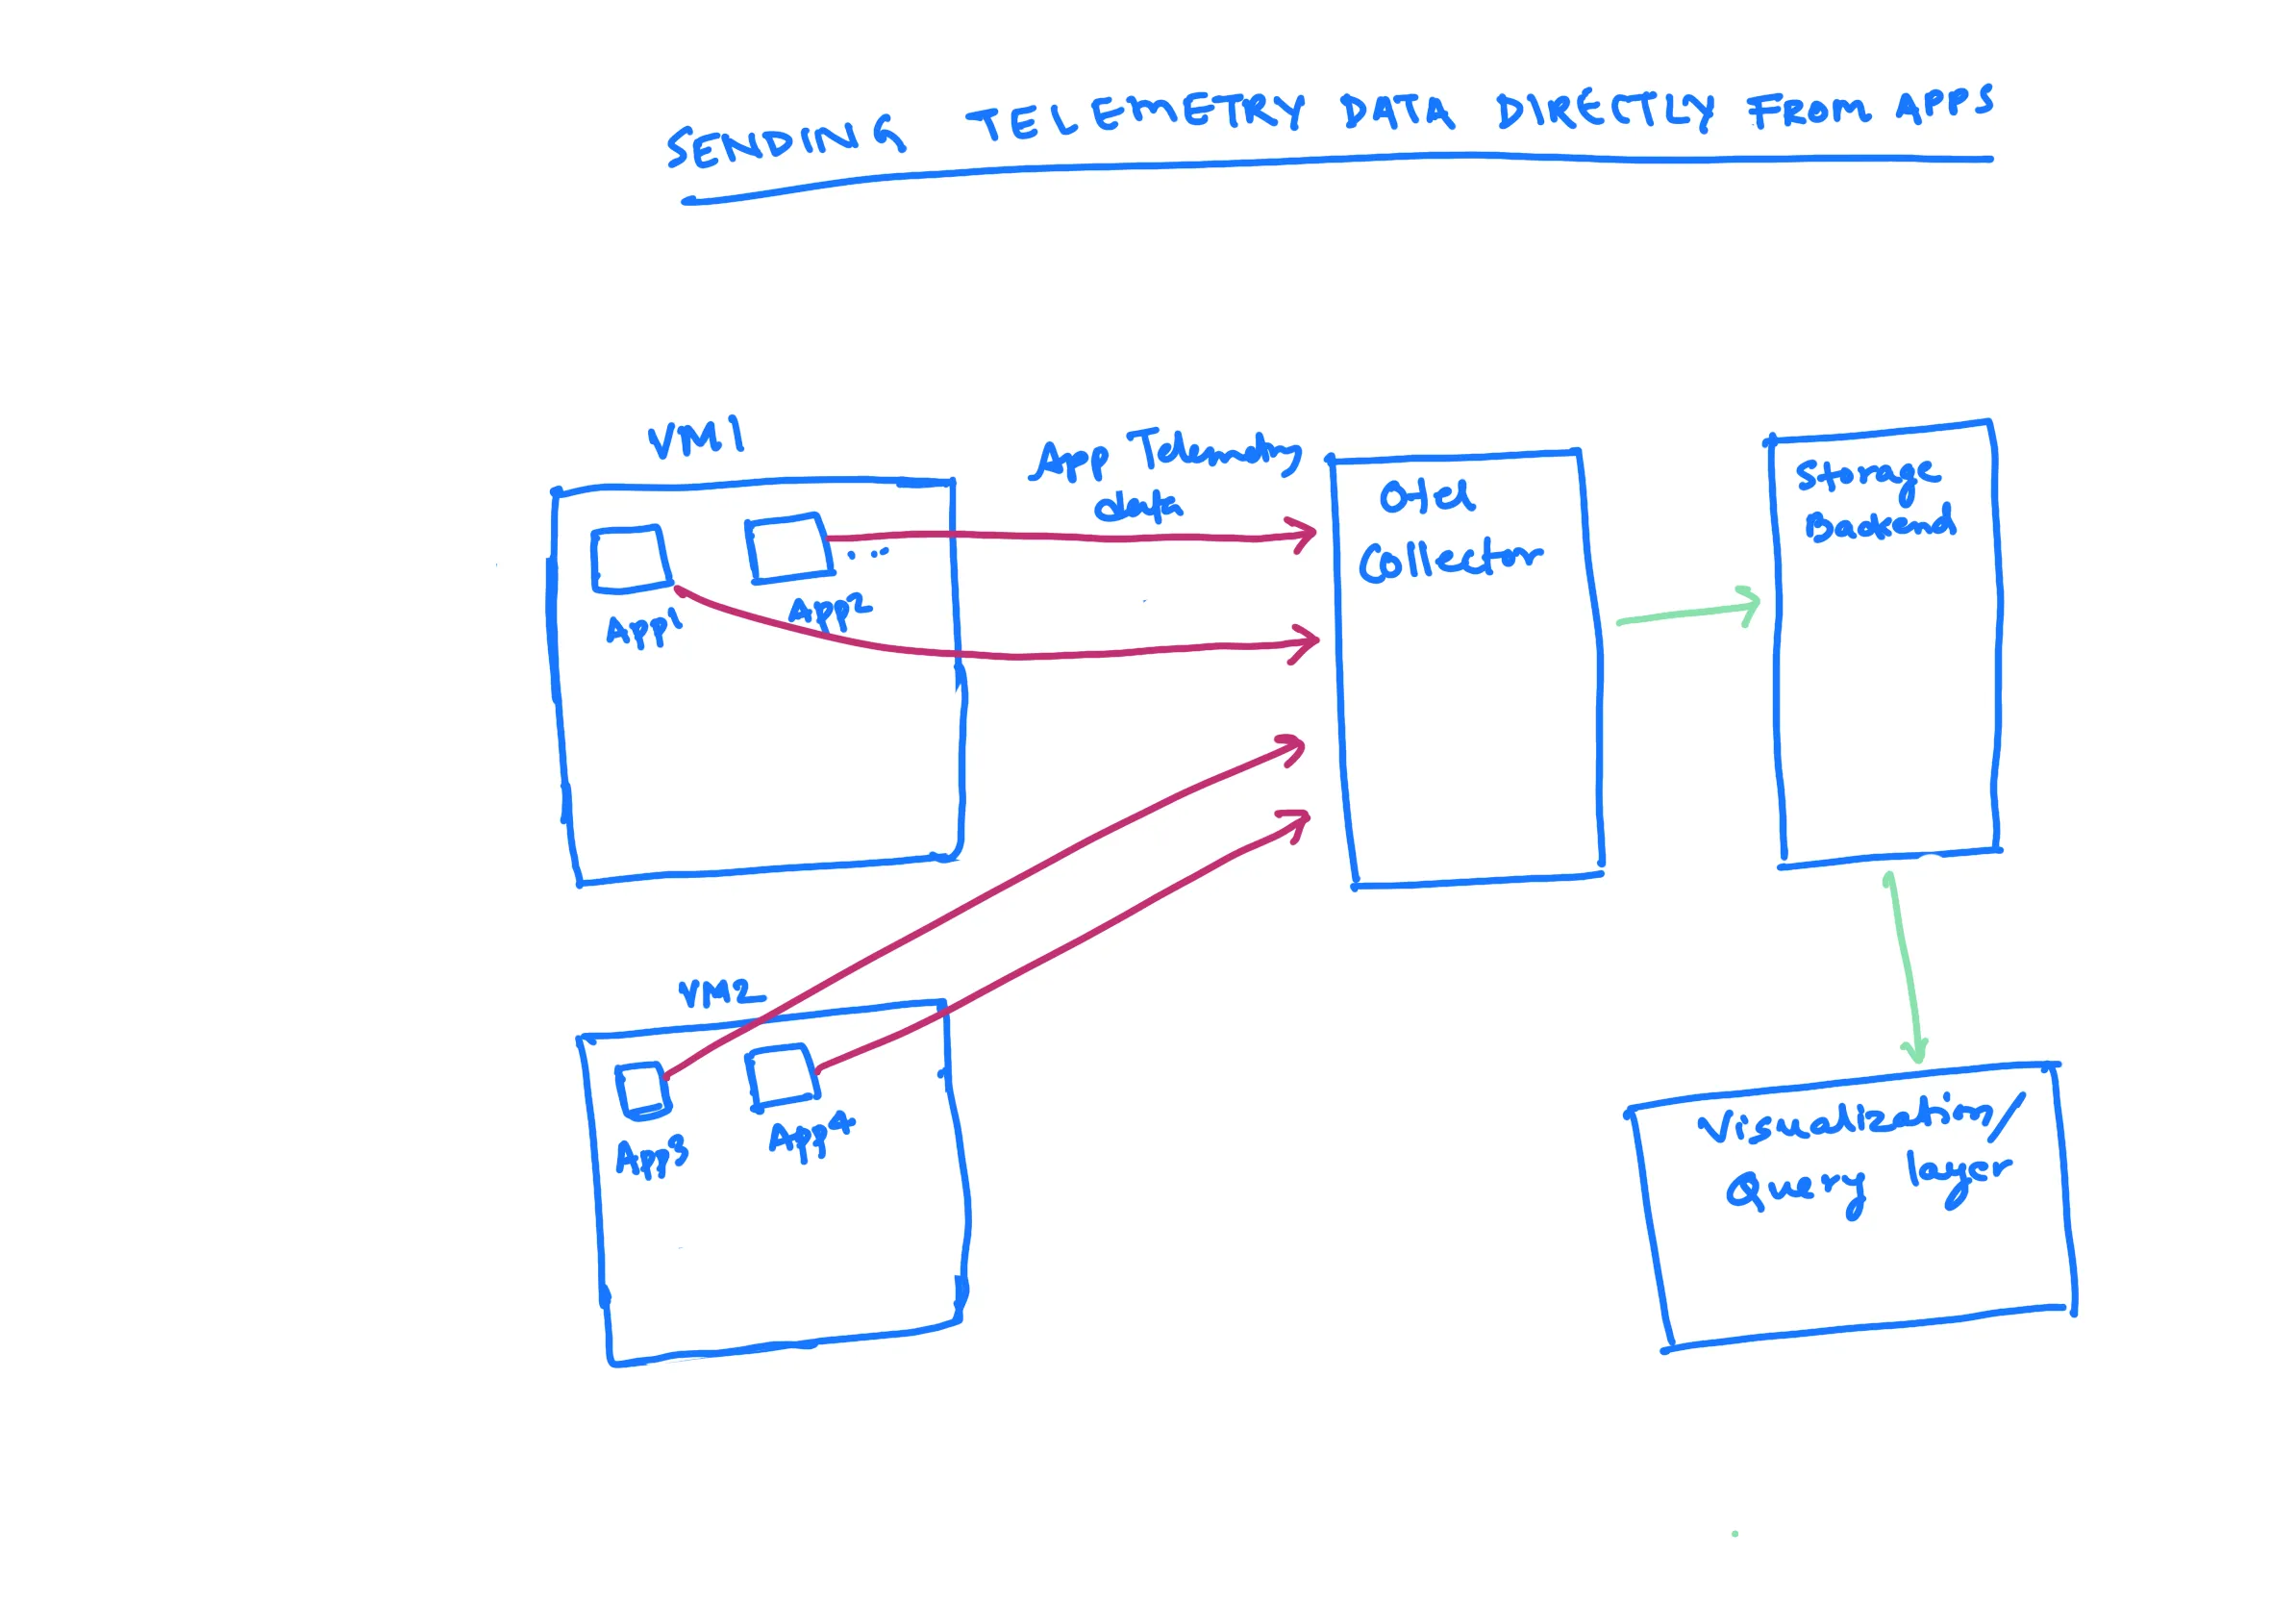
Pranay: Indeed, this is a topic that we can explore in more depth. The idea is that we have OpenTelemetry collectors, which may be used with a storage backend. However, there are various ways in which apps and nodes can interactively send data.
I will attempt to provide some details on this and discuss the patterns that we have seen. If there is more interest, we can delve into more advanced topics such as gateways and load balancers in a future session.
Let's get started. One of the basic patterns is to have an OpenTelemetry collector and a storage backend, as well as a visualization layer that can be used to communicate data and create dashboards.
However, if you have, for example, a JavaScript application, one common pattern is to send data directly from that application to the OTel collector. You install an OTel collector and then obtain an endpoint for it. You then specify those endpoints in your applications and begin sending data directly to them.
This is a common pattern that people use to get started. It appears to be rather simple. However, what are the advantages and disadvantages of this approach?
One advantage is that it is simple to set up and use. Another advantage is that it can be used with any application that supports OpenTelemetry. However, one disadvantage is that it can be difficult to scale, especially if you have a large number of applications. Additionally, it can be difficult to secure, as the data is sent directly to the collector.
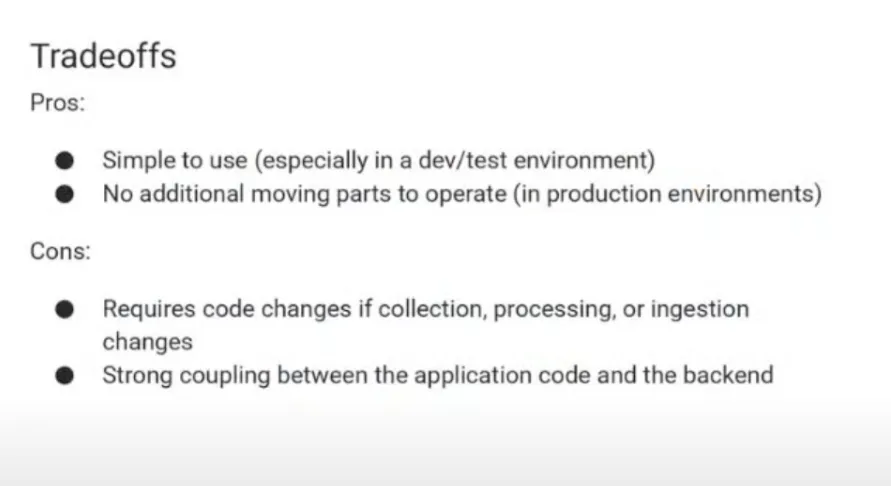
One of the key advantages of using OTel is its simplicity. You can start using it in a development environment with ease, and there is no need to operate other OTel collectors in the application flow.
The OTel collector is primarily at the observability layer, so you have one main central OTel collector to which you send your data. This makes it a very straightforward and easy-to-use tool.
One disadvantage of this approach is that any code changes or collection ingestion changes require changes to the code, as it is directly tied to the application logic.
In some teams, the responsibility of managing applications is handled by a different team, such as the DevOps team or the SRE team. Therefore, this approach is generally used for testing and sending data, but not in production, as it creates a strong coupling between application code and backend.
The next approach is to use a separate service for data collection and ingestion. This service can be managed by a different team, and it can be used by multiple applications. This approach has the advantage of decoupling the application code from the backend, which makes it easier to make changes to either.
Nica: I often think of this solution as being a developer solution. A developer might say, "I'm excited about monitoring my application more closely with OpenTelemetry." They may have someone set up a collector for them, or they may do it themselves. Then, they can experiment with their application code, instrument their code on the application side, and see the results pretty quickly.
This is great for a quick experiment, such as trying a custom instrumentation.
However, if you want to instrument all 23 microservices and get everyone on board, you don't want to have to go to the entire development team and say, "Hey everyone, go in and edit a bunch of code to send data in a different format. We're not collecting it now, but I can't do anything about it otherwise." That would be a lot less clean and efficient.
A better approach would be to use a tool that can automatically instrument code. This would save the development team a lot of time and effort, and it would ensure that all of the microservices are instrumented in the same way.

So a great place to get started but not too often do you see this, you see this almost as really as you see no OTel collector with just sending data to the backend.
Pranay: Indeed.
Nica: Returning to your slide, we are back on track.
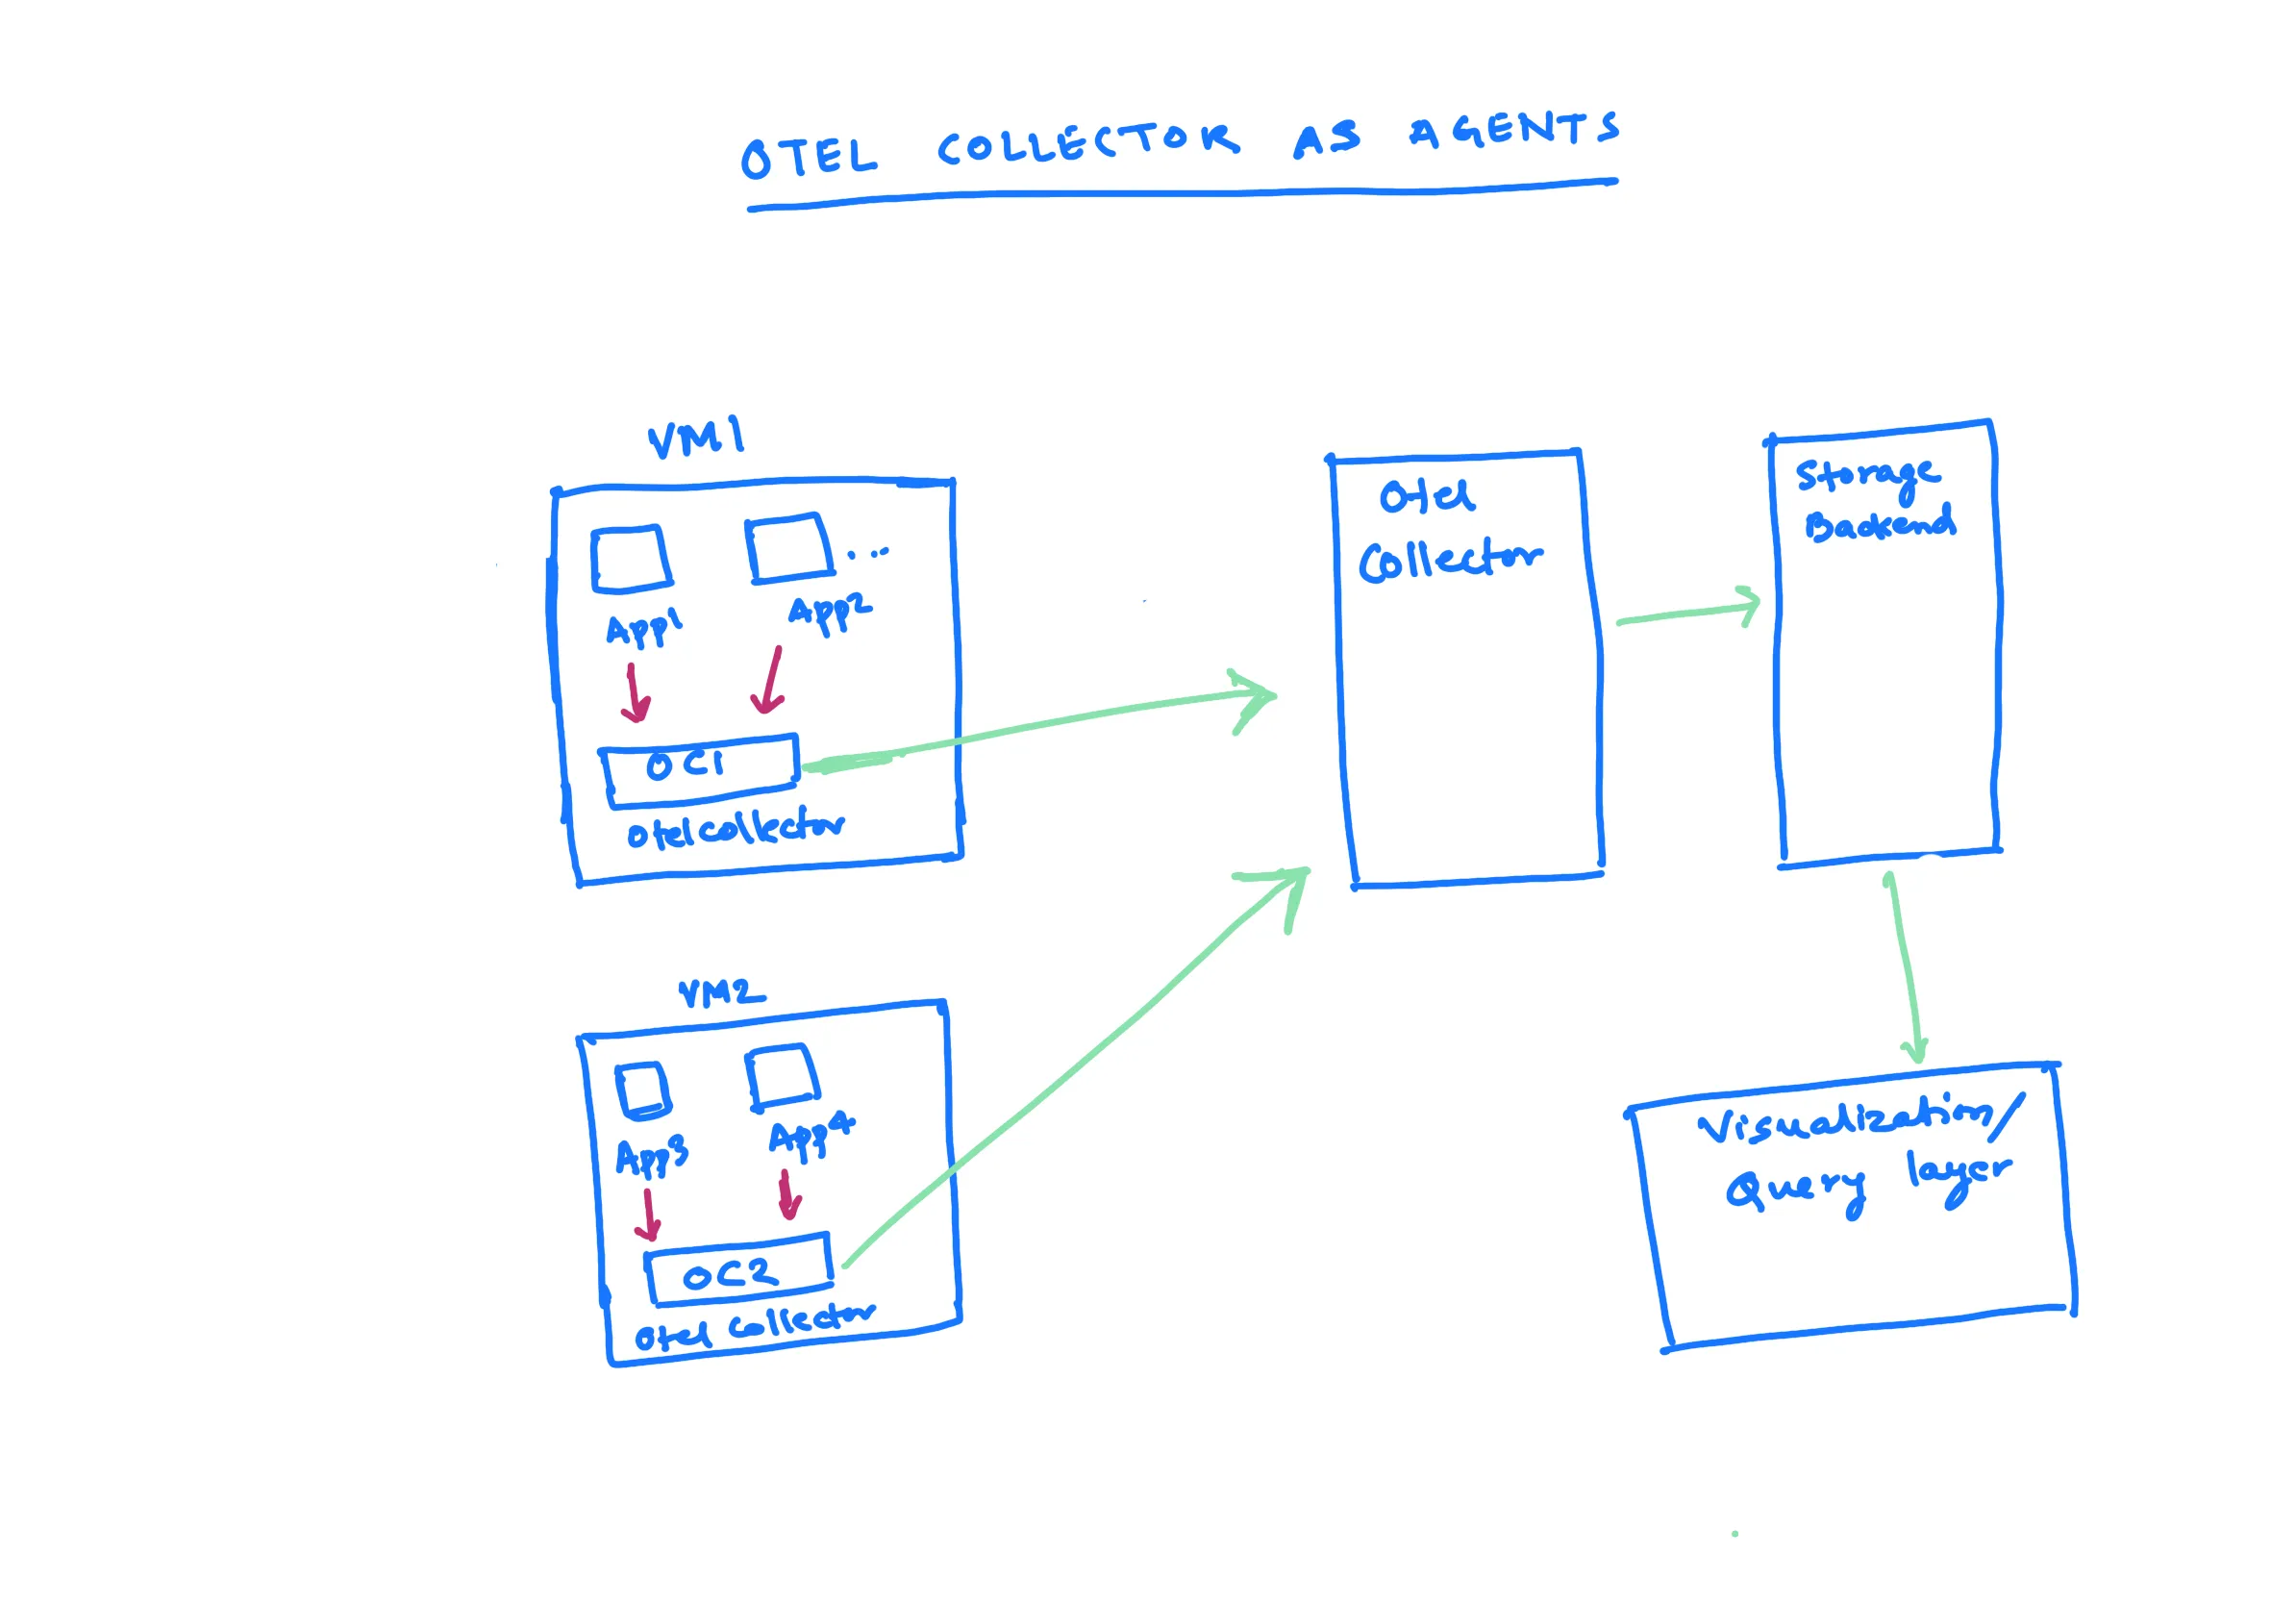
Pranay: Yes, sending data directly from applications may present some challenges. One common approach, especially for those who deploy applications on virtual machines, is to run an OTel collector on each virtual machine. This collector acts as an agent.
If you have multiple applications running on virtual machines, the applications send data to the OTel collector on the machine, which acts as the agent. Then, all of the OTel collectors on the machine send data to the central collector.
There are a few advantages to this approach. First, it is easy to get started. You simply need to install one OTel collector. There is a clear mapping between the applications and the OTel collectors, so you know which application is sending data to which collector. If you want to do any processing, such as removing PII data, you can easily set it up on a node level.
One disadvantage of this approach is that you need to manually set up OTel collectors on each node. You are responsible for setting up the applications and the OTel collectors on the nodes, and then configuring them properly.
However, this is a common approach that is used by many vendors. They ask you to install an agent on the VM, which then sends data to their endpoint. This is very similar to the approach that we are discussing.

Nica: One of the factors that we are overlooking here, but which is usually present, is that the first Green Arrow, the first screen send, is often associated with some cost. Therefore, having these collectors left on these virtual machines gives you the opportunity to batch, debounce, compress, and collate your data a little bit, which can save you a lot of money if you are spending on this end.
I think that these three collectors are often drawn to scale, where the ones running on the virtual machines are usually pretty minimal. They may just be batching data and may have your most critical PII settings, such as "Oh my God, if you see a credit card number or a social security number, go ahead and pull that out."
However, a lot of that configuration, a lot of that complexity, is happening on the other side. Here's how you stitch together traces or perform other kinds of very sophisticated processing steps, because you don't want to have to tell everyone with every virtual machine, "Hey, go in and add this config and have that config. You just manage it on your Central Secondary collector."
Pranay: One reason why sometimes this approach is essential is for example, if you are interested in getting infrastructure metrics of the virtual machine, you need to run something on the Node level to get those metrics. Either, in terms of the node, for example, if you're running Prometheus or you're running host metric receiver, you run that at the node level and send data to this OTel collector which is running on a virtual machine at the node level.
Or if you want syslogs of a machine, so generally the approach people take is, you forward all those logs to the OTel collector in the machine and then you send that to the main Center OTel collector. Sometimes this becomes essential. Let's move on to the next topic.
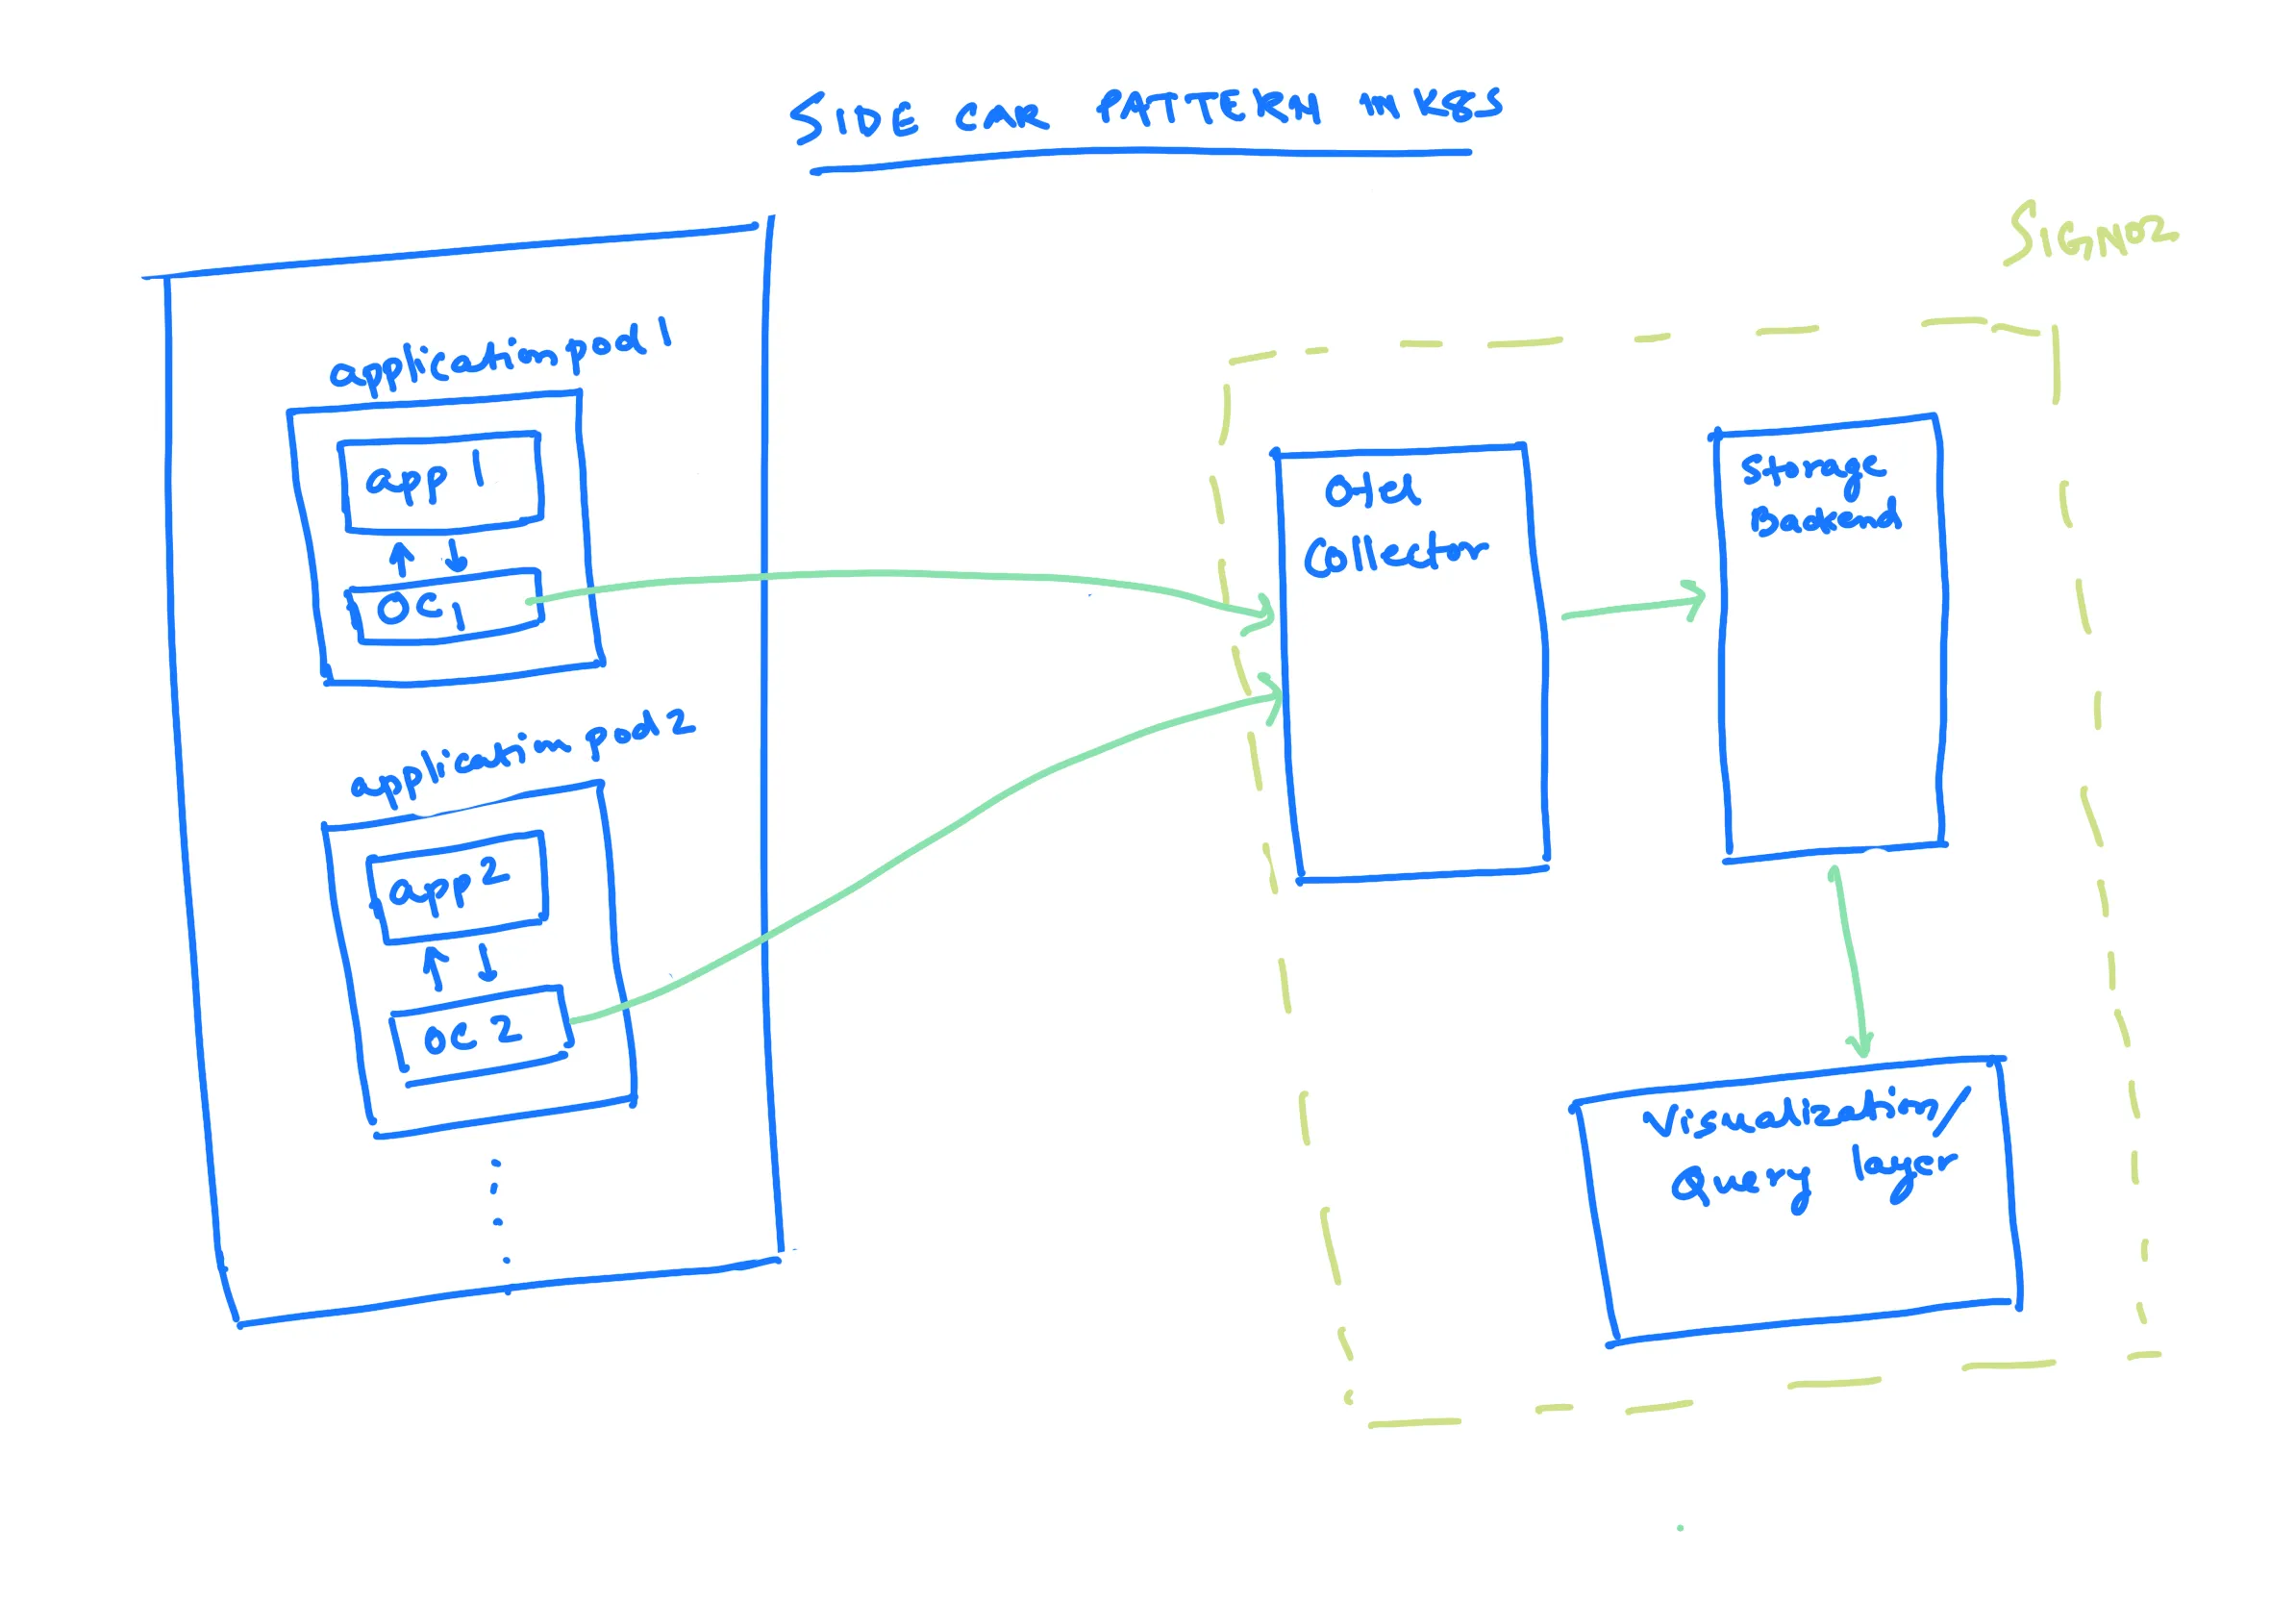
Let us now discuss some of the patterns that are also common in the Kubernetes world. There are a couple of patterns that are generally used. One of them is running the OpenTelemetry (OTel) collectors as sidecars with each application pod. In this approach, an OpenTelemetry collector container is also run with each application container, and that collector sends data to the OTel collector.
This helps you by ensuring that each application has an OTel collector associated with it. This makes you agnostic of the backend you use. If you have an OTel collector here, you can just configure it to point to the backend.
Let us assume that you are currently using Jaeger or SigNoz as your backend. If you want to change your backend, all you need to do is change the endpoints or exporters in the OTel collector. Everything you have done in the application pod will remain the same.
This is one of the interesting aspects of this type of OTel collector. By the way, I have just shown this in the sidecar pattern. For example, the things you see in the dotted green light are what come with SigNoz.
So, if you are running an instance of SigNoz itself, it comes with a central OTel collector, a storage backend (clickhouse in our case), and then the visualization and query layer. So, basically, the OTel collectors that are running as sidecars point to the SigNoz OTel collector, and we take care of the rest.
Nica: I believe this is one of the reasons why some vendors who have previously sold closed-source SaaS observability solutions are now nervous about the existence of the OpenTelemetry project.
While there is certainly an effort to embrace these standards, there is also some concern. I believe one of the reasons for this is the simple fact that you can configure OpenTelemetry to send data to a different OpenTelemetry endpoint. Of course, different tools like Prometheus and Jaeger will have different advantages and disadvantages, and they will be used for different purposes.
Overall, the OpenTelemetry project has the potential to disrupt the observability market, and it is understandable that some vendors are concerned about this.
However, I believe that there is some apprehension in the SaaS world. It is as if one is saying, "If you can get this running in a configuration like this, it is very easy to have all of these sidecars hitting the same point for a configuration file. This is where we are sending our data, and this is the side collector that we are sending it to."
And then, of course, the migration process should be relatively straightforward, because you can simply say, "I think this will provide better visualizations, it will take a better look at my traces, the storage makes more sense on this platform, and then you can simply configure it and be migrated to someone else."
I do not mean to sound like an industry insider, but I believe that one of the reasons why we say "Hey, this is worth exploring" is because it is not very enjoyable to collect some nice observability data only to discover that you are stuck with a particular vendor and there is no way to see this data with any other tool, certainly not with an open source tool.
This is one of the great things about using OpenTelemetry and the OTLP standard fully.
Pranay: Yes, I think that what the OpenTelemetry project has essentially done is democratize the instrumentation layer, which I think is very fascinating. As a result, many projects can offer products like SigNoz as the backend, which can be easily built on top of the OpenTelemetry collector.
Returning to the topic of sidecar patterns, one advantage is that each OTel collector is tied to an application. This allows for much more fine-tuning of how much OTel resource is allocated to a particular application. For example, if an application is sending a lot of data, is important, or needs to be monitored closely, then more resources can be assigned to the OTel collectors that are attached to that application.
This pattern provides much greater configurability for the OTel collector for each application individually. Additionally, because all of these OTel collectors are acting independently for each application, load balancing is much easier when running the system at scale.
If the OTel collector in the observability system is scaling, you want to ensure that all of these systems or parts in the OpenTelemetry collector which are in the application pod can scale much faster. After all, they are independently sending data to the OTel collector. And because the aggregation level happens at the application level, the traffic is smoothed out, making it much easier to handle higher workloads.
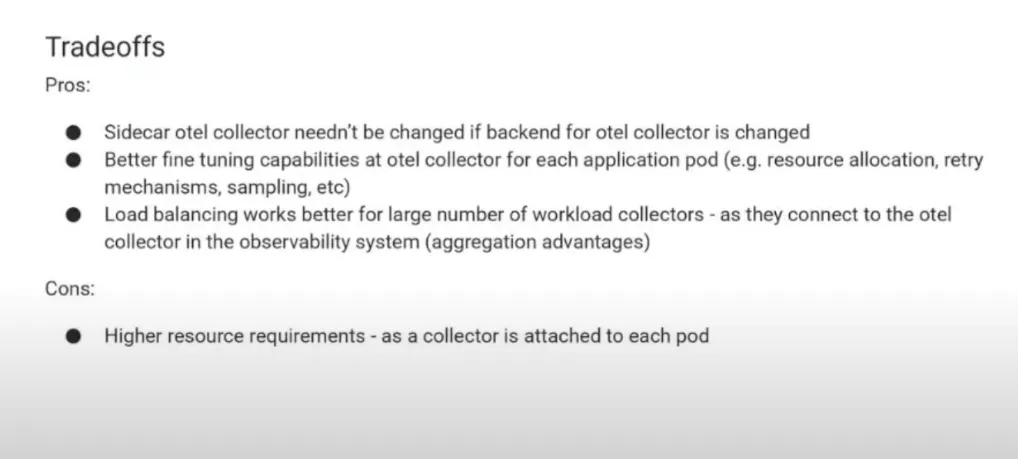
The other only disadvantage or one of the disadvantages of this is that because you are running an application pod with each, like an OTel collector with each of the application pods, you are just running so many of them and that is higher resource requirements.
So generally the OTel collector should run within five to ten megabytes and then if you say are running 100 pods. that sort of scales up.
Nica: If you're running nano-services maybe you need to start worrying about that you've pushed beyond the micro threshold. Let's talk about this let's talk about this last model here.
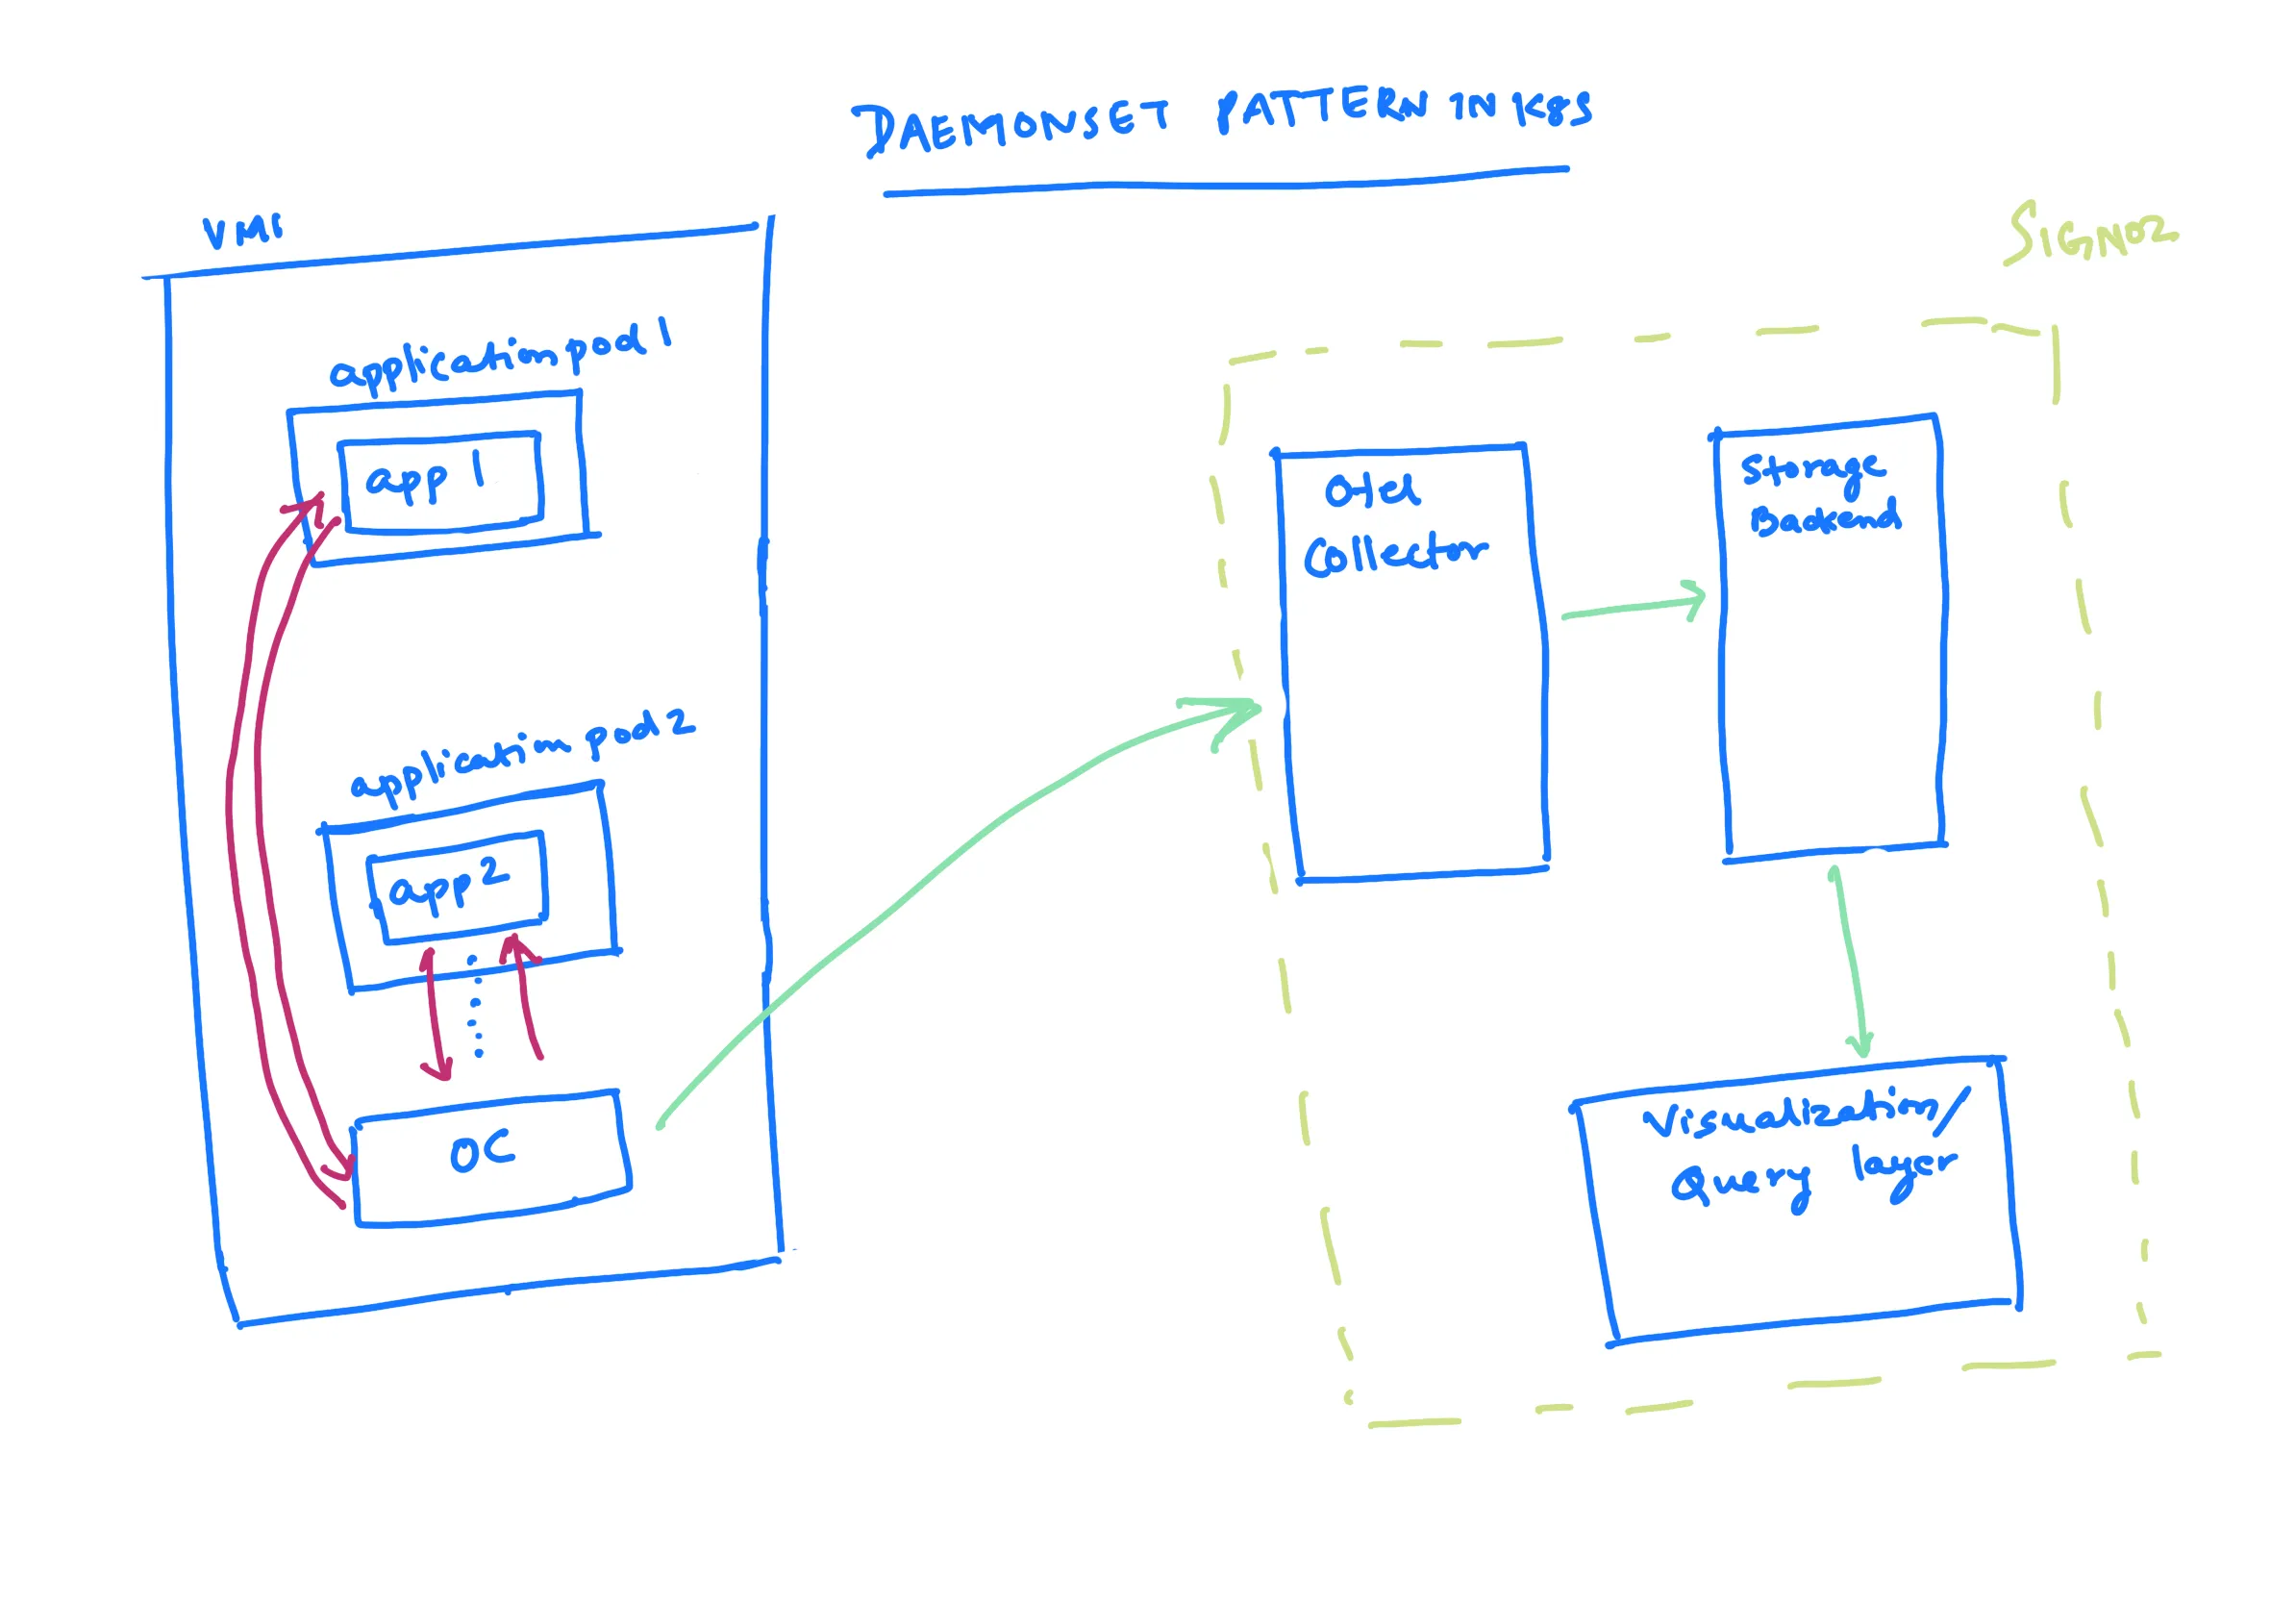
Pranay: I believe this is a trade-off between the application sidecar pattern and the first-second pattern, which is seen in the VM world where an OTel collector runs at the node level.
In Kubernetes, this is essentially the daemon set pattern, where instead of running things with each application pod, you run one OTel collector on each virtual machine. This gives you enough flexibility to control things at the node level, while at the same time there are not as many application pods.
The amount of resource requirements is not as much. Another advantage is that because you are still running the OTel collector very close to the application pod, the application can simply offload data much more easily, rather than sending it to the (say) Central OTel collector over the network.
The application offloads data very easily within the confines of the machine's private network, and then the OTel collector in the node is responsible for sending the data to the central OTel collector.
The trade-off in this setting is that, because there is only one OTel collector in each node, you lose the fine-tuning capability that was discussed. For example, you cannot allocate resources for a particular OTel collector based on the particular application pod, as it must be based on the entire node.
Nica: If a pod is sending a large amount of data, it is theoretically possible to reduce the amount of data being sent by the processor, but it is not as easy to implement different collection strategies for different pods running in the same cluster.
Pranay: Another point to note is that, since you are running things at the node level, it is difficult to do application-level multi-tenancy. For example, if you want to run something where different applications belong to different tenants, it is difficult to do here because there is a single node and hence you cannot do different sampling for each tenant or different resource allocation for each tenant. So that is the trade-off.
Nica: We have a great question that just came in via chat. I have put it up on the screen. The question is: "How could we have a push-based system where the new pod will push the metrics and logs to a common collector?" So, can you help me understand what a push-based system is? I want to make sure that we answer this question well.
Pranay: A push-based system is a system where the data source pushes the data to the collector. In this case, the pod would push the metrics and logs to the collector. This is in contrast to a pull-based system, where the collector would pull the data from the data source.

Nica: Okay
Pranay: Prometheus is renowned for its utilization of a pull-based system. In essence, the Prometheus data exposure involves designating a specific endpoint. A Prometheus scraper is then employed to retrieve data from this endpoint, exemplifying the pull-based approach.
In a contrasting manner, the post-based system involves transmitting data to the OTel (OpenTelemetry) selector. This is particularly evident in the default operational mode of OpenTelemetry SDKs. In this scenario, data is accumulated, queued, and subsequently dispatched to the collector.
Nica: When considering the configuration of new pods, it is typical to specify the collective location and integrate the appropriate OpenTelemetry SDK. This practice is particularly relevant for instances like a Java pod executing a job application. Consequently, upon setting up a new pod, the anticipation is that it will automatically commence forwarding data to the collector without explicit intervention.
Pranay: Admittedly, the concept behind facilitating a push-based system for the transfer of metrics and logs from a recently established pod to a shared collector remains somewhat nebulous to me. It seems that the predominant approach adopted by OpenTelemetry is of the push variety.
For instance, if you use a host Matrix receiver in OpenTelemetry, consider the scenario where an OTel collector, referred to as Agent, is in a node image. Imagine there's an OTel collector operating in a virtual machine. If you wish to obtain host metrics, by default, these metrics follow a push-based approach. In this approach, the OTel collectors take the metrics and push them to the central OTel collector.
Nica: You should have the ability to configure this. I've been thinking about writing on this topic. I assure the commenter that there will likely be documentation about this in the coming weeks. It's like you can search within your cluster, find your collector, and automatically start reporting to it with the new setup.
This entire process involves auto-instrumentation. By just adding the OpenTelemetry SDK as a requirement, the experience may differ slightly based on your programming language and framework.
But there are a few scenarios where this has been used. For instance, if someone asks, "How can I deploy my rails application?" They can deploy it to the new pod, and it will automatically incorporate the rails SDK for auto-instrumentation. It will begin reporting to the correct collector right away because you should be able to find that collector locally within your cluster.
Pranay: Yes
Nica: Your question is excellent. Thank you for bringing up this important topic. If anyone has more questions, please type them in the chat. We'll be ending soon but will still address any questions you have.
Pranay: Let's aim to conclude. We've talked about the daemon set pattern and the challenges of setting up multi-tenancy here. I'd like to highlight something relevant to Kubernetes – the OpenTelemetric operator. This might not be well-known to many people.
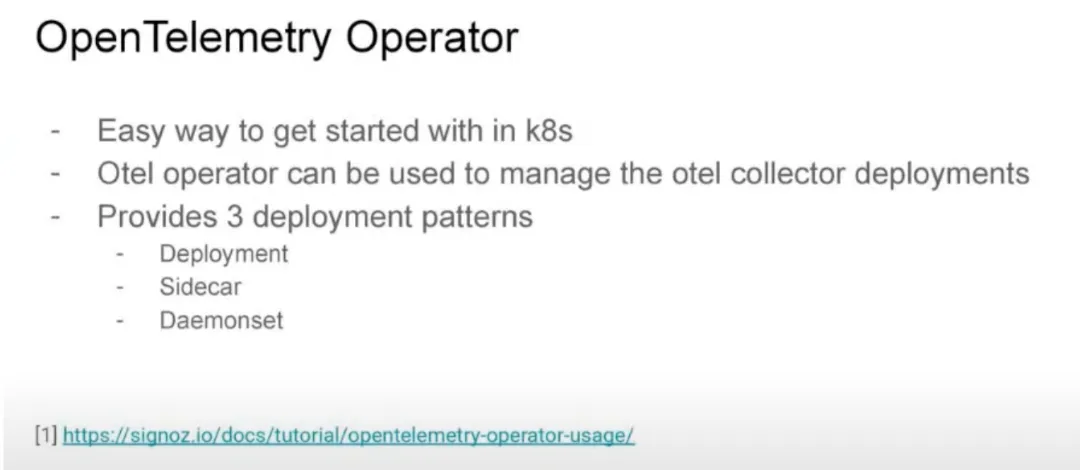
Nica: Yes, the OpenTelemetry operator might not be widely understood or extremely popular, so it's worth discussing.
Pranay: If you're working with Kubernetes, there's something called an "Operator." OpenTelemetry has created default operators for you to use in your Kubernetes cluster. Currently, it offers three ways to set them up.
Firstly, there's the deployment mode. In this mode, it operates across the entire Kubernetes cluster.
Secondly, there's the sidecar mode that we mentioned earlier. In this mode, a collector is connected to a specific application pod.
Lastly, there's the daemon set mode where the collector is linked to a node.
If you see this graph,

here we have a single pod and here we have multiple application pods, what happens is if you have multiple says 100 or such application pods, it becomes difficult to manage the OTel collector parts.
You have several OTel collectors running. How can we manage them? How do we make sure that if they stop working, they start again? And how do we allocate their resources correctly? That's where the OpenTelemetry operator comes in. You can choose to run this operator in different ways: deployment mode, sidecar mode, or daemon set mode.
For example, in sidecar mode, it can automatically add the instrumentation SDKs and begin sending data to you. I've included a link to a tutorial on our website that explains how to use this. If you're using Kubernetes and are interested in OpenTelemetry, you should take a look. For most programming languages, like JavaScript, Java, and Python, the auto instrumentation works well. It's a quick way to get started.
Nica: Yes, this is a powerful tool that's gaining traction for what it can do. We have a couple more questions to address.

"Could you please discuss the resiliency aspect? In situations where the OpenTelemetry collector is not operational, data loss occurs despite the use of multiple pods. During the transition, some data loss happens.
At the main level, there's a single collector involved at a specific point. While that collector is offline, you generally experience data gaps. It's worth noting that these relatively short outages aren't usually the primary concern. However, I'd like to address this matter briefly.
Pranay: Each OpenTelemetry collector has a queue associated with it. Although I referred to it as a single entity, it's important to understand that the OpenTelemetry collector can scale horizontally. Typically, you run a group of these collectors together. In the context of observability, the usual setup involves a fleet of OpenTelemetry collectors, not just a single one. These collectors are managed with queues in front of them.
Many solutions revolve around horizontal scalability and the related queue. Sometimes, if the outages are longer, a recommended approach is to introduce a Kafka queue or a similar type of queue in front of the OpenTelemetry collector. This ensures that even when the collector is down, certain types of data can still be captured. This is a common pattern we've observed.
Nica, I think it would be beneficial to explore this topic in more detail. The example we've discussed revolves around a single OpenTelemetry collector. However, in reality, it's often a fleet of collectors working together. So, even if one collector goes offline, there's a load balancer directing data to other collectors.
Nica: Indeed. The next question brings us back to an earlier query: 'Can we use Kafka in front of the central collector to provide some level of resilience in case the backend (the central collector) becomes unavailable?'"

and so I think we're going to cover this more in-depth in the future, I think that the short version is yes, it is possible to use Kafka. There's a great deal of lift there because OTLP is not super native there, but there is a bit more resiliency than you see in this initial version of this chart.
Let's get back to that one about resiliency and the kind of advanced conceptualization. There's another great question "Is there any OpenTelemetry operator available for ec2 host metrics in specific?"

The answer is not exactly a "yes." It might not always catch or include a specific build of Kubernetes OTeloperator for ec2. Instead, there is a collector called AWS distro for OpenTelemetry collector. This collector directly captures certain ec2 metrics and also includes some AWS-related features, like a receiver for x-ray data.
So, what you should consider looking into is the AWS version of the OpenTelemetry collector.
Pranay: Yes, just examine the OpenTelemetry collector receiver or repository. It lists all the receivers. I'm unsure if there are operators specifically available, but the default setup includes the host metrics receiver.
Nica: Many of the necessary ec2 monitoring aspects are available directly through host metrics from the standard collector. Additionally, exploring the receiver libraries of the OTel collector will provide more options. Moreover, the AWS version of the OTel collector is more focused on some of the cloud watch features you'd want to integrate into OpenTelemetry.
Pranay: Yes.
Nica: If you have more questions, we'd encourage you to join our Community Slack to discuss this further.
We would like to discuss this a bit, especially if many people are interested in doing this on AWS; that's the main topic.
If you're reading this on LinkedIn, please consider following us there. If you're watching this on YouTube, you can subscribe and enable notifications. We'll also share this in our community Slack and during CNCF events for our next sessions. Any final thoughts or things we want to share?
Pranay: No, I think this is excellent. We've received many good questions and suggestions for more topics to discuss. If anyone is interested, we are very active in a Slack community. Feel free to join us there to continue the conversation.
Nica: Thank you everyone for joining us. We're ending it here. If you have any questions, please leave them as comments on the video, especially for future episodes. We'll be in touch soon.
Pranay: Yeah, thanks a lot bye.
Thank you for taking out the time to read this transcript :) If you have any feedback or want any changes to the format, please create an issue
Feel free to join our Slack community and say hi! 👋


