FluentD vs Logstash - Choosing a Log collector for Log Analytics
When we have large-scale, distributed systems, Logging becomes essential for observability, monitoring, and security. No matter what architecture (Monolith/Microservices) our systems have, they are complex due to the number of moving parts they have and the challenges they face around management, deployment, and scaling.

In this scenario, Log management tools rescue the DevOps and SRE teams in order to help them monitor and improve performance, debug errors, and visualize events.
In layman's terms, a log analysis tool has the following major components:
- Logs exporter (Configure logs per host)
- Logs collector
- Logs storage
- Logs visualization
In this article, we will be discussing two very famous open-source log collectors that are Logstash and Fluentd. The hidden gems of any log analysis tool are the log collectors. They run on servers, pull server metrics, parse all the logs, and then transfer them to the systems like Elasticsearch or Postgresql. It's their routing mechanism that eventually makes log analysis possible.
Both Logstash and Fluentd are open-source data collectors under the Apache 2 license. Logstash is popularly known as the ‘L’ part of the ELK stack managed by Elastic itself. Whereas Fluentd is built, and managed by Treasure Data and is a part of CNCF.
Comparing FluentD and Logstash
We have prepared a table to give you a brief overview of the key differences. Later on, we will discuss each point in detail.
| Logstash | Fluentd | Comment | |
|---|---|---|---|
| Endorsing company | It is a part of the popular ELK stack managed by Elastic itself. | Built and managed by Treasure Data and is a part of the CNCF. | Both are open-source, and Fluentd has support for Elastic as well. For Kubernetes or Docker projects, Fluentd is preferred. |
| Language written in | Written in JRuby hence does require Java runtime on the host machine. | Written in CRuby hence no need for Java run-time dependencies. | In cases where you don’t want to be dependent on JVM or Java runtime, go for Fluentd. |
| Platform | Runs on Windows and Linux both. Naturally cross-platform. | It wasn’t available on Windows until 2015. Now it runs on Windows as well. | Both are cross-platforms. |
| Ecosystem and Plugins | It has approx 200 plugins. | It has approx 500 plugins. | Logstash is centralized i.e. has all the plugins in one central git repository, whereas Fluentd is decentralized. The official repository only hosts 10 plugins. |
| Transport | It does not support an in-built buffering system. Only limited to an in-memory queue that can hold up to 20 events (fixed) and relies mainly on external queues like Redis or Kafka for consistency | It provides an in-built buffering system that can be configured based on the needs. It can be an in-memory or on-disk system. | When you don’t want to deal with a more complicated configuration, then go for Logstash but do deploy it with Redis or Kafka to ensure reliability. |
| Performance | Logstash consumes more memory than Fluentd. | It is more memory-efficient. | But based on this talk at Open Source Summit 2015, both perform well in most use cases and consistently grok through 10,000+ events per second. |
| Event routing | Events are routed based on if-else conditions. It can be a bit tedious though. | Events are routed based on tags. | Fluentd has a better routing approach, as tagging events is easier than using if-else conditions. |
Key differences between FluentD and Logstash in detail
Ecosystem and Plugins
Plugins help any tool extend its functionality. Fluentd and Logstash have a rich ecosystem for plugins, including various input systems (files and TCP/UDP), filters, and output destinations (Elasticsearch, AWS, GCP, etc).
The main difference here is how plugins are managed. Logstash has a single centralized repository where all the plugins are managed. There are 199 plugins under the logstash-plugins GitHub repo.
On the other hand, Fluentd follows a decentralized approach and does not host all the plugins under one single repository. Its official repository hosts only 10 plugins. Yet it has 500 plugins support.
You can check out Logstash Github repo here having all Logstash plugins. Here’s an example of FluentD plugin repo.
Memory usage / Performance
Performance can be a subjective point depending totally upon the user’s use case. But it is still found that Logstash consumes more memory of 120 MB than Fluentd’s 40 MB. Now if we consider modern machines, this does not create much difference, but when used across 1000s of machines of infrastructure, it is a big difference of 80*1000, implying 80GB of additional memory use.
But in Logstash, you can avoid this problem by running ElasticBeats instead of running Logstash on a single leaf node. ElasticBeats are resource-efficient, purpose-built log shippers where each Beat focuses on one data source only and does that well. Fluentd uses Fluent Bit, an embeddable low-footprint version of Fluentd written in C.
If you're running small applications, it is recommended to use Fluent-bit. On the other hand, Elastic beats are the lightweight version of Logstash. For smaller workloads, Elasticbeats are preferred. But if your use case involves more data processing apart from data transport, you will need to use both Logstash and Elastic beats.
Transport
Logstash lacks an in-built buffer system for data transport. It is only limited to an in-memory queue that holds up to 20 events (fixed). It relies upon external queues like Redis or Kafka for persistence across restarts. Redis is considered a ‘broker’ in a centralized Logstash installation, queuing Logstash events from remote Logstash shippers.
Fluentd has an in-built configurable buffer system and does not rely on external queues for persistence. But the configuration is pretty complicated. However, it is safer to use Fluentd than Logstash regarding data transport.
Event routing
Event routing means sending data and messages between applications and systems. It plays a very important role in evaluating a logging system and how event routing is managed.
Fluentd uses a tagging approach, whereas Logstash uses if-then-else statements for event routing. This way, we can define certain criteria with If..Then..Else statements – for performing actions on our data. Tagging approach seems a bit easier to use than using conditional statements. With Fluentd, you’ll have to tag each of your data sources (inputs). Fluentd uses tags to match inputs against different outputs and then routes events to the corresponding output.
Log Parsing
The components for log parsing differ tool per tool. Fluentd uses standard built-in parsers(JSON, regex, CSV, etc.), and Logstash uses plugins for this. This makes Fluentd more favorable over Logstash as we don’t have to deal with any external plugin for this feature.
Docker support
Docker provides an in-built fluentd logging driver. The logging driver sends container logs to the fluentd collector as structured log data. In the case of Logstash, an extra agent (filebeat) is required on the container to push logs to Logstash.
So if you're running your applications with Docker, FluentD is a more natural choice. Logs can be directly shipped to FluentD service from STDOUT. FluentD makes the overall Docker logging architecture less complex, and less risky.
When to prefer Fluentd over Logstash or vice-versa
For the Kubernetes environments or teams working with Docker, Fluentd is the ideal candidate for a logs collector. Fluentd has a built-in Docker logging driver and parser. You don't need an extra agent on the container to push logs to FluentD. Because of this feature, Fluentd makes the architecture less complex and less risky for logging errors. Moreover, when memory is your pain point, then go for Fluentd as it is more memory-efficient due to the lack of JVM and java runtime dependencies.
On the other hand, Logstash works well with Elasticsearch and Kibana. So, if you already have Elasticsearch and Kibana in your infrastructure then Logstash would be your best bet for a log collector. In general, if you are looking for a more managed and supported system, then always go for Logstash.
If you have come this far, you surely are looking to try your hands at a log management system or looking for one for your application. You might want to try out SigNoz as well. It is an open-source APM that supports logs, metrics, and traces under a single pane of glass. It also supports both FluentD and Logstash as a log collector.
Log management in Signoz
SigNoz is a full-stack open source Application Performance Monitoring tool that you can use for monitoring logs, metrics, and traces. Having all the important telemetry signals under a single dashboard leads to less operational overhead. Users can also access telemetry data with richer context by correlating these signals.
SigNoz uses a columnar database ClickHouse to store logs, which is very efficient at ingesting and storing logs data. Columnar databases like ClickHouse are very effective in storing log data and making it available for analysis.
Big companies like Uber have shifted from the Elastic stack to ClickHouse for their log analytics platform. Cloudflare too was using Elasticsearch for many years but shifted to ClickHouse because of limitations in handling large log volumes with Elasticsearch.
SigNoz uses OpenTelemetry for instrumenting applications. OpenTelemetry, backed by CNCF, is quickly becoming the world standard for instrumenting cloud-native applications.
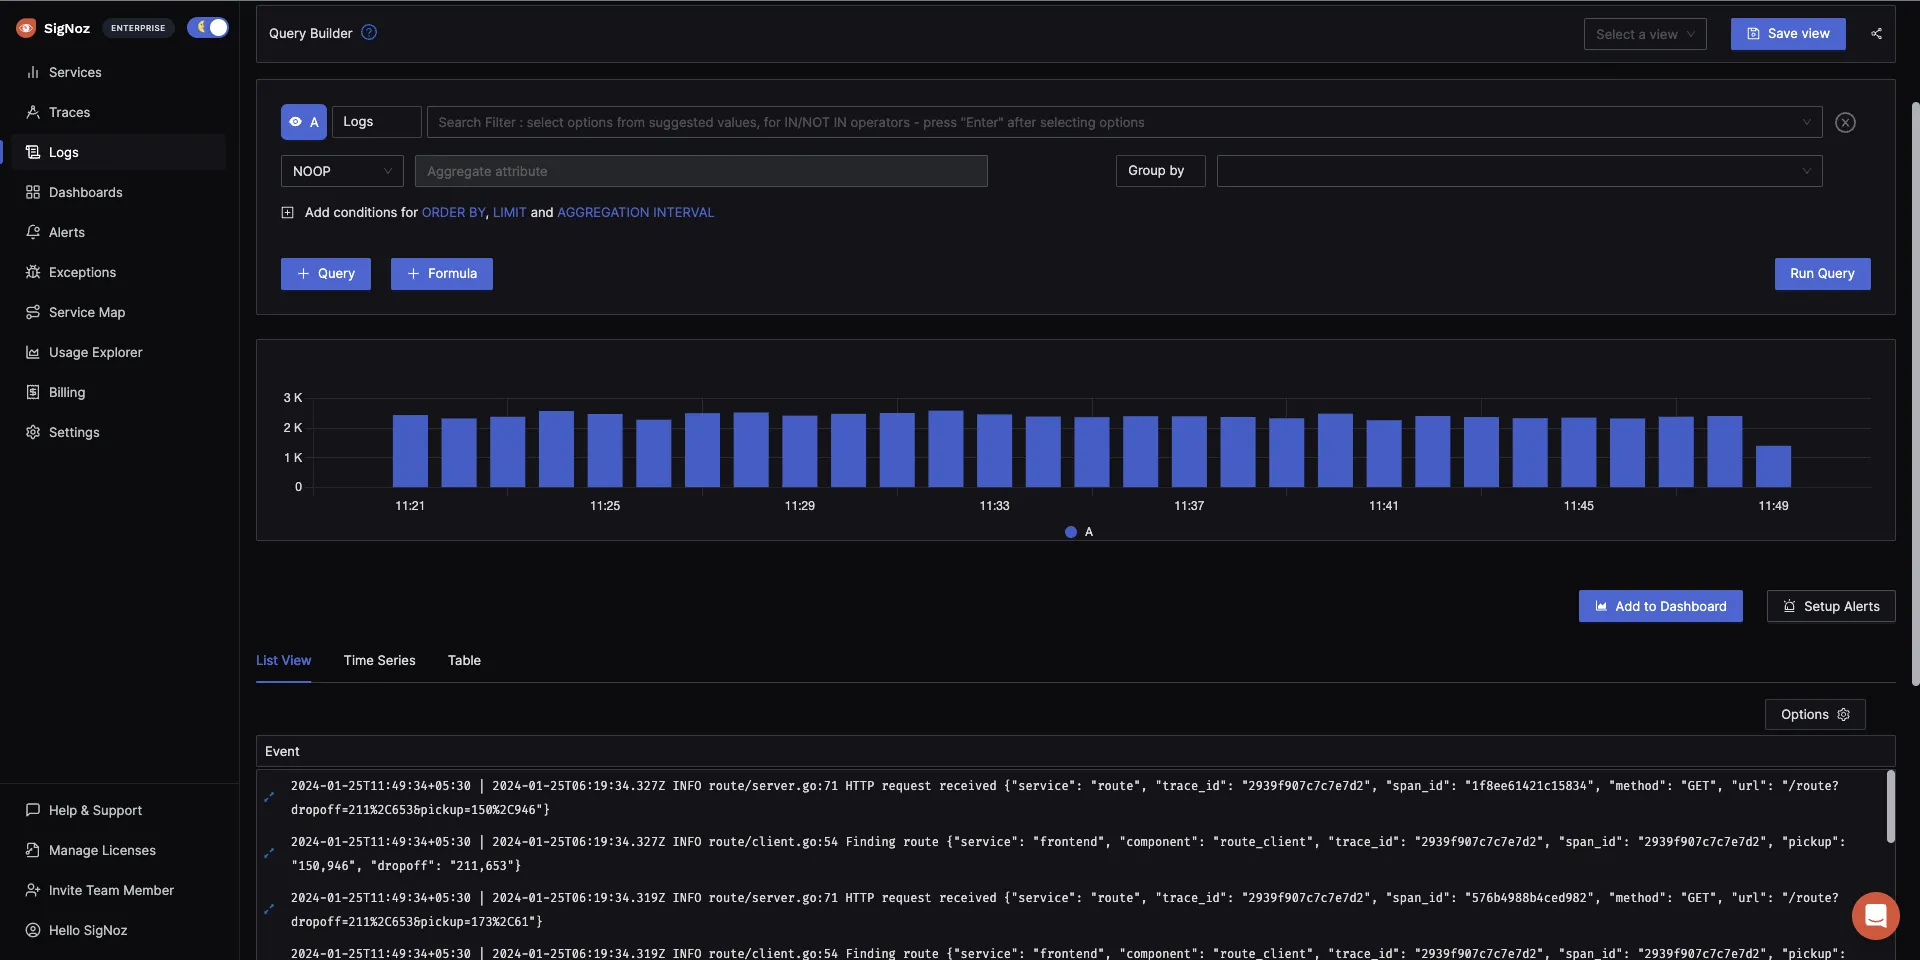
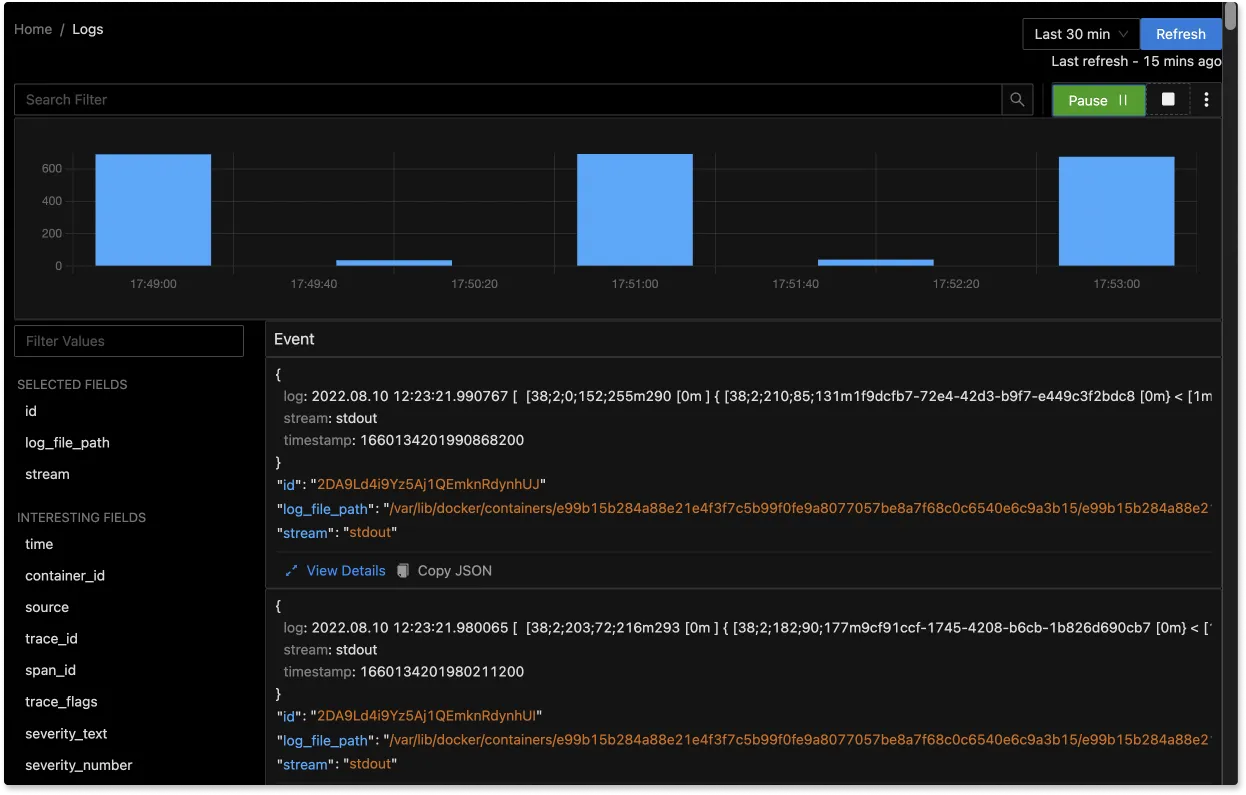
The logs tab in SigNoz has advanced features like a log query builder, search across multiple fields, structured table view, JSON view, etc.

You can also view logs in real time with live tail logging.

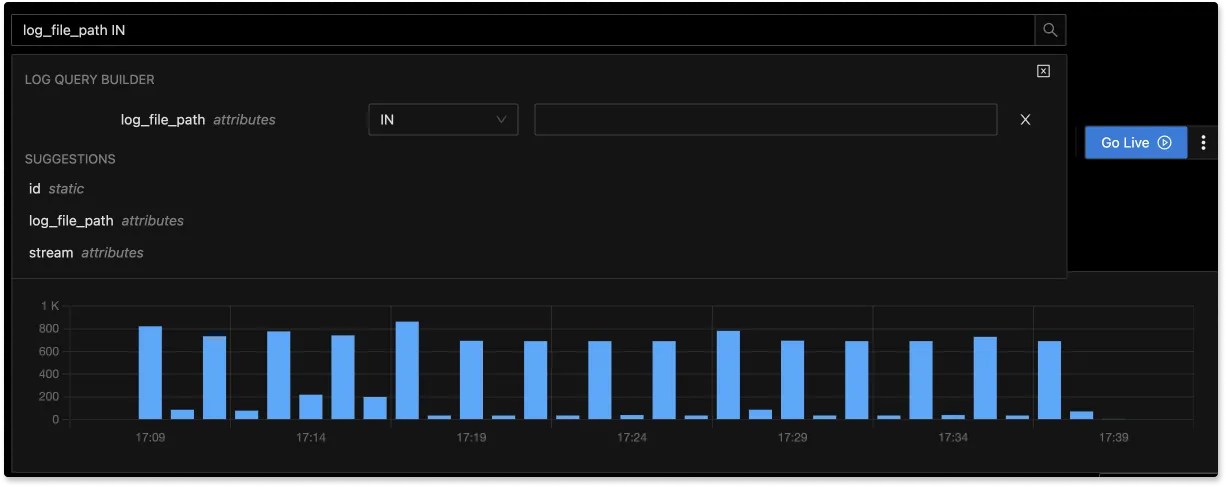
With advanced Log Query Builder, you can filter out logs quickly with a mix and match of fields.

Getting started with SigNoz
SigNoz cloud is the easiest way to run SigNoz. Sign up for a free account and get 30 days of unlimited access to all features.
You can also install and self-host SigNoz yourself since it is open-source. With 16,000+ GitHub stars, open-source SigNoz is loved by developers. Find the instructions to self-host SigNoz.
Related Posts


