Latest Top 13 Distributed Tracing Tools [perfect for microservices]
Modern digital organizations have rapidly adopted microservices-based architecture for their applications. Distributed tracing tools help monitor microservices-based applications. Choosing the right distributed tracing tool is critical. How do you know which is the right one for you? In this post, we will cover the top 13 distributed tracing tools in 2024 that can solve your monitoring and observability needs.
What is a distributed tracing tool?
A distributed tracing tool enables you to track user requests across multiple servers and services in a microservice architecture. It gives you a central overview of how user requests are performing in different services.
Distributed tracing tools have become a critical component in a distributed and microservices-based architecture.
So why is distributed software so popular?
There are three major reasons for the popularity of distributed software: scalability, reliability, and maintainability.
But it also comes with its own challenges. Distributed software becomes complex with scale, and no single team can fully comprehend how all services interact. Although engineering teams own single services, they become implicitly responsible for many services.
A single user request can travel through hundreds or thousands of microservices. So to quickly identify where things are going wrong, you need a central overview of how requests are performing across services.
Distributed tracing tools capture user requests as they travel through every service and measure things like latency.
A great distributed tracing tool can improve your team's response to performance issues, thereby improving the end-user experience.
Here's the list of the top 13 distributed tracing tools we will be looking at in this article:
- SigNoz (Open-Source)
- Jaeger (Open-Source)
- Zipkin (Open-Source)
- Grafana Tempo
- Serverless360
- Dynatrace
- New Relic
- Honeycomb
- ServiceNow Cloud Observability
- Instana
- DataDog
- Elastic APM
- Splunk
Before we deep dive into each of these distributed tracing tools, let's take a short detour to understand distributed tracing.
What is Distributed Tracing?
In the world of microservices, a user request travels through hundreds of services before serving a user what they need. To make a business scalable, engineering teams are responsible for particular services with no insight into how the system performs as a whole. And that's where distributed tracing comes into the picture.
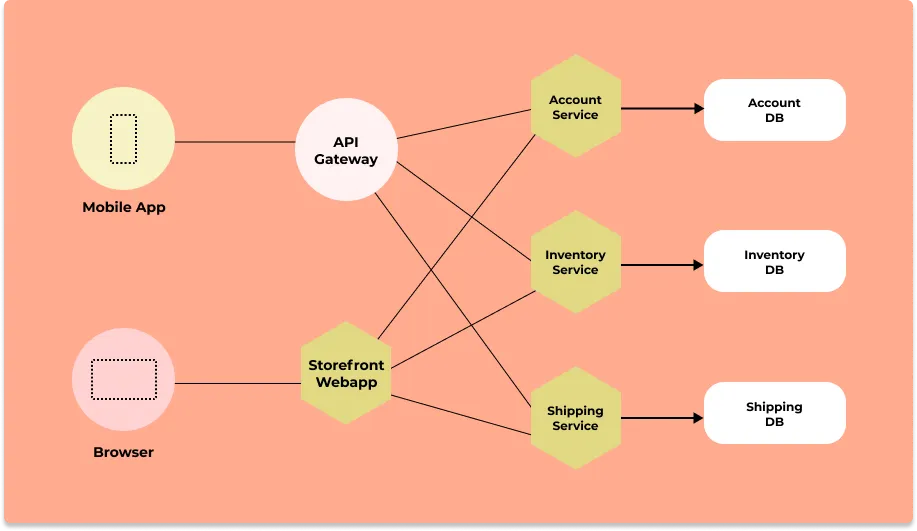
Distributed tracing gives you insight into how a particular service is performing as part of the whole in a distributed software system. There are two essential concepts involved in distributed tracing: Spans and trace context.
Read our complete guide on Distributed Tracing
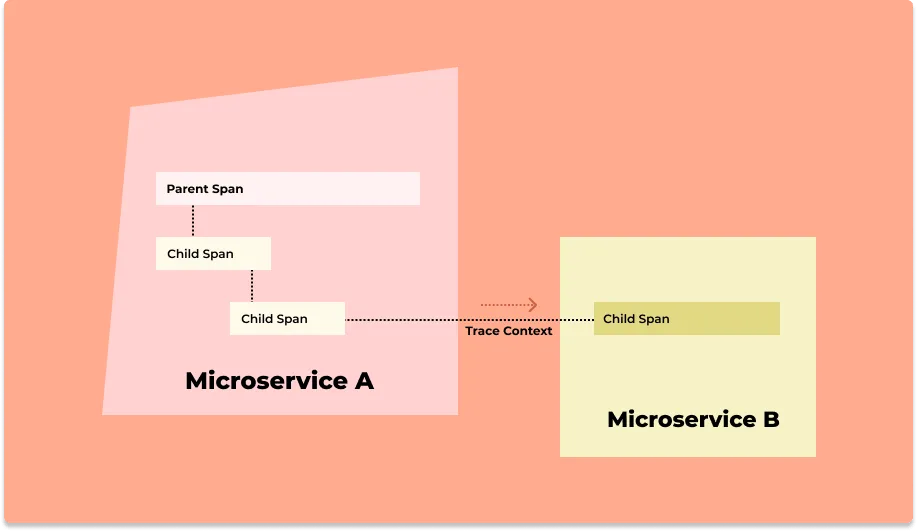
User requests are broken down into spans.
What are spans?
Spans represent a single operation within a trace. Thus, it represents work done by a single service which can be broken down further depending on the use case.
A trace context is passed along when requests travel between services, which tracks a user request across services. Thus, you can see how a user request performs across services and identify what exactly needs your attention without manually shifting through multiple dashboards.
Why do we need a tracing tool?
Tracing tools are needed for the following reasons:
- Debugging and Troubleshooting: They show the sequence of events leading to a problem, making it easier to find out what went wrong.
- Root Cause Analysis: Tracing tools provide a complete view of a request, helping to identify where and why a failure occurred.
- Performance Monitoring and Optimization: Tracing tools reveal timing details for each service or track how long each part of the process takes, helping to spot delays and fix performance issues.
- Complexity Management: In systems with many parts (microservices), tracing helps understand how everything works together, showing how requests move through each microservice.
- Service Dependency Mapping: Tracing tools create visual maps of service dependencies and their relationship, helping to understand the impact of changes or failures.
Top 13 Distributed Tracing Tools
Now let's explore the top 13 distributed tracing tools in 2024.
SigNoz (Open-Source)

SigNoz is a full-stack distributed tracing tool that you can use for tracing your application. You can monitor logs, metrics, and traces and correlate signals for better insights into application performance. Logs, metrics, and traces are considered to be the three pillars of observability in modern-day distributed systems.
SigNoz is a very good choice for distributed tracing based on OpenTelemetry. With SigNoz, you can do the following:
- Visualise Traces, Metrics, and Logs in a single pane of glass
- Monitor application metrics like p99 latency, error rates for your services, external API calls, and individual endpoints.
- Find the root cause of the problem by going to the exact traces which are causing the problem and see detailed flamegraphs of individual request traces.
- Run aggregates on trace data to get business-relevant metrics
- Filter and query logs, build dashboards and alerts based on attributes in logs
- Monitor infrastructure metrics such as CPU utilization or memory usage
- Record exceptions automatically in Python, Java, Ruby, and Javascript
- Easy to set alerts with DIY query builder
SigNoz is a great fit for engineering teams looking for an open-source distributed tracing tool. SigNoz also offers cloud and enterprise plans. This makes it a great choice for teams that want the flexibility of having their dev and staging environment on open-source and their prod services monitored by SigNoz cloud.
SigNoz uses OpenTelemetry for code instrumentation. OpenTelemetry provides vendor-agnostic instrumentation libraries and is quietly becoming the world standard for generating and managing telemetry data.
Jaeger (Open-Source)
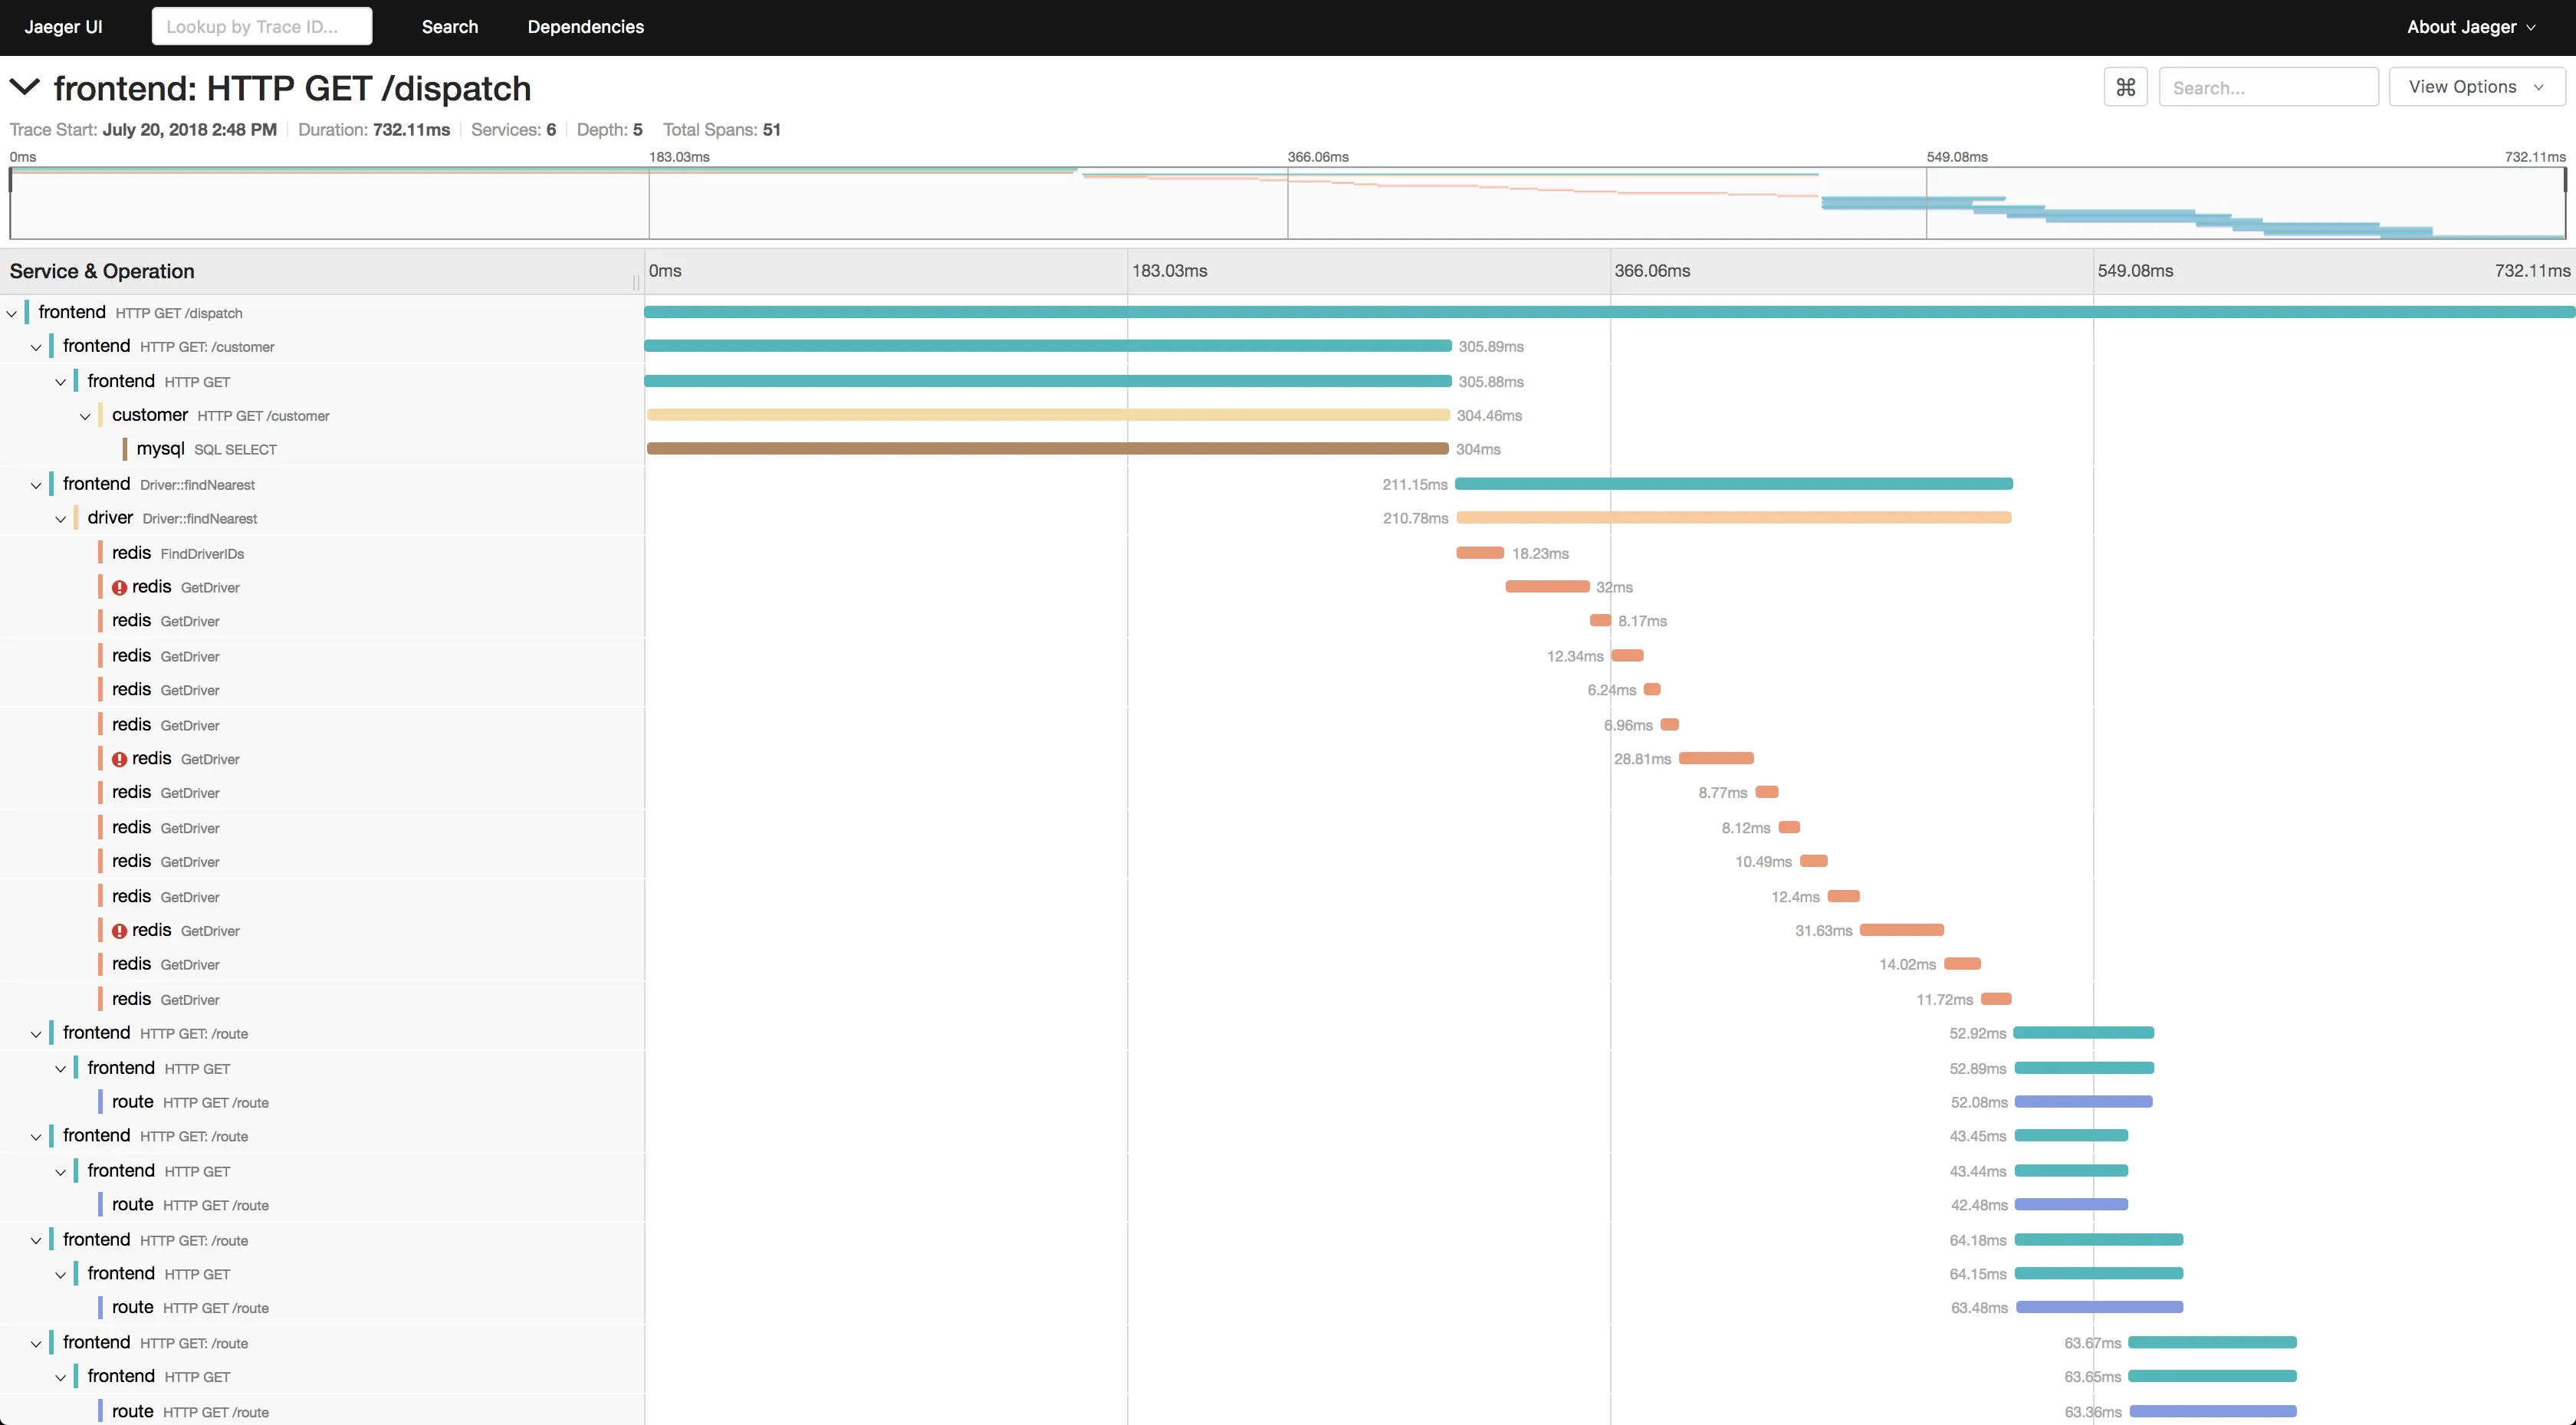
Jaeger is an open-source APM tool developed at Uber, later donated to Cloud Native Computing Foundation(CNCF). Inspired by Google's Dapper, Jaeger is a distributed tracing system.
It is used for monitoring and troubleshooting microservices-based distributed systems. Some of its key features include:
- Distributed context propagation
- Distributed transaction monitoring
- Root cause analysis
- Service dependency analysis
- Performance / latency optimization
Jaeger supports two popular open-source NoSQL databases as trace storage backends: Cassandra and Elasticsearch. Jaeger's UI can be used to see individual traces. You can also filter the traces based on service, duration, and tags. However, Jaeger's UI is a bit limited for users looking to do more sophisticated data analysis.
Zipkin (Open-Source)
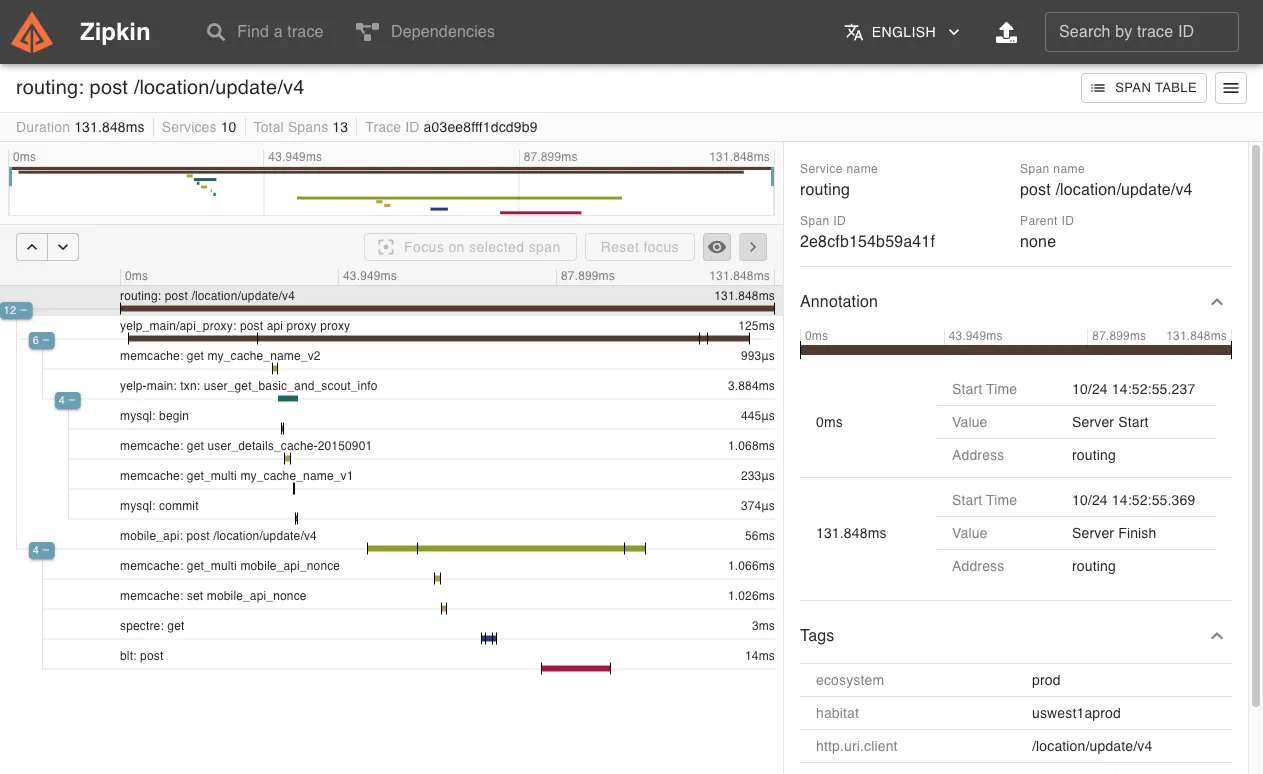
Zipkin is an open-source APM tool used for distributed tracing. Zipkin captures timing data need to troubleshoot latency problems in service architectures.
Zipikin was initially developed at Twitter and drew inspiration from Google's Dapper. Unique identifiers called Trace ID are attached to each request which then identifies that request across services.
Zipkin's architecture includes:
- Reporters to send data to Zipkin
- Collectors which persist trace data to storage
- API to query data
- UI
Zipkin's in-built UI is limited, and you can use Grafana or Kibana from the ELK stack for better analytics and visualizations.
It also includes a dependency diagram that shows how many user requests went through each service. It can help you to identify error paths and calls to deprecated services.
Grafana Tempo
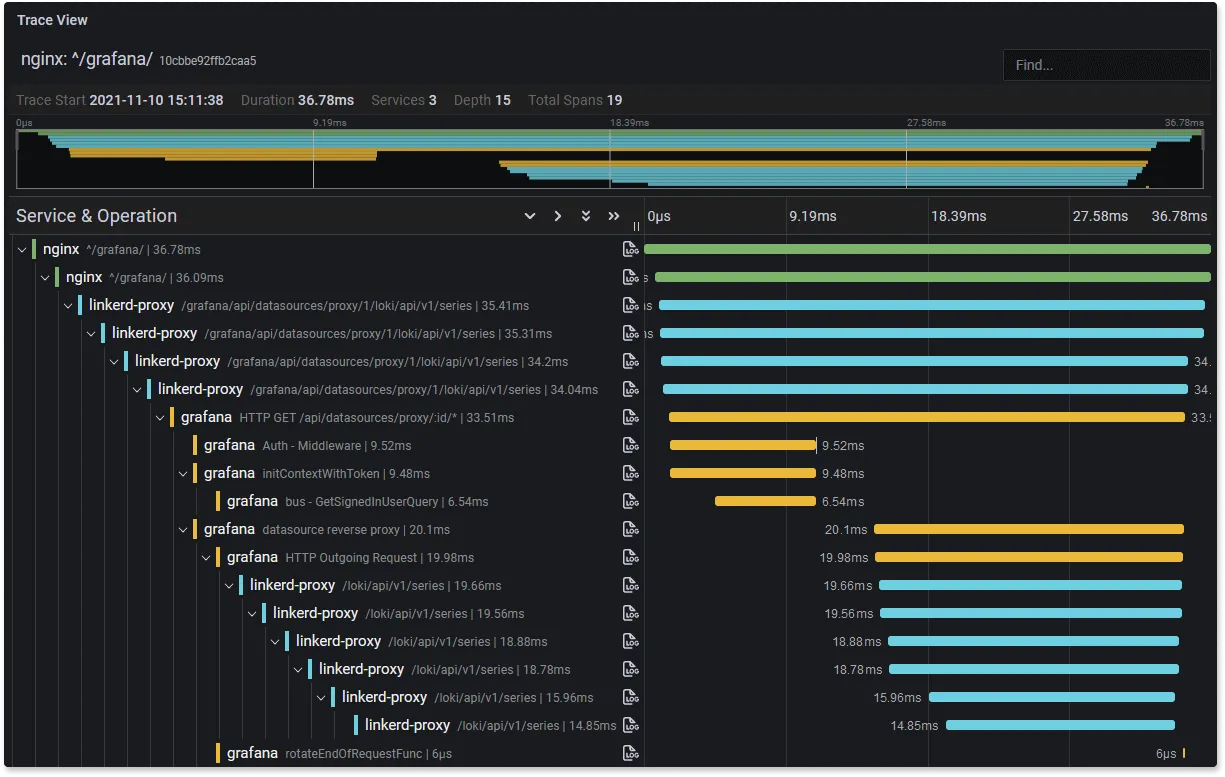
Grafana Tempo is an open-source tracing backend which was started by Grafana Labs. It was announced at Grafana ObservabilityCON in October 2020, and became generally available in June 2021.
Some of the key features of Grafana Tempo includes:
- compatible with popular open source tracing protocols like Zipkin and Jaeger
- Supported by Grafana as a separate data source for trace visualizations
- Available as self-hosted and cloud version
- Provides service graph
Serverless360
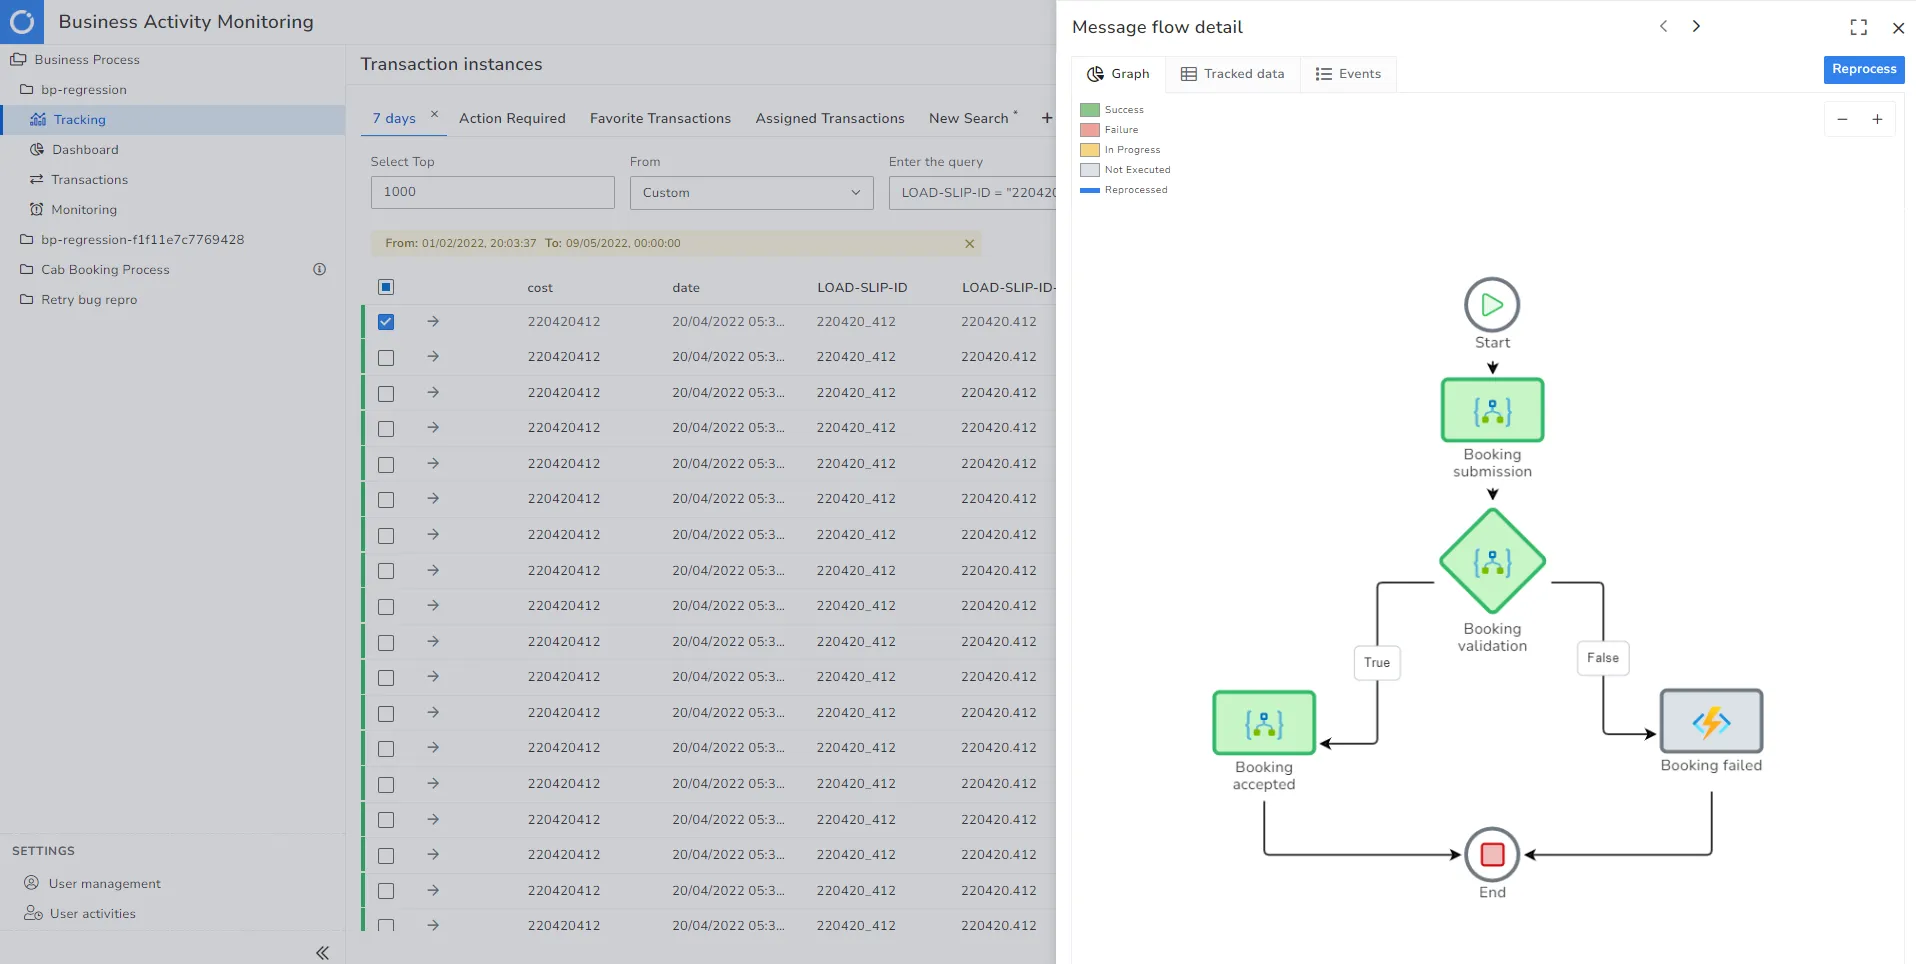
Serverless360 is an enterprise tool ideal for distributed tracing in cloud-native and hybrid microservice architectures.
For distributed tracing, it provides checkpoints that act as a milestone and indicate the business process's completion. It provides message-level insights, including the metadata and properties of the message flowing across the applications.
The platform provides a simplified end-to-end representation of underlying complex architecture, to help the business users and support operators troubleshoot bottlenecks at ease.
Some of its key features include:
- End-to-end tracking of message flow
- Intuitive UI to see individual transactions with an advanced filter on Id, tags, property names, durations & more
- Provides simplified live performance tracking for microservices
- Ideal for scenarios like correlation, dynamic reprocessing, de-batching transactions, and more
- Facilitates team collaboration in resolving issues.
With Serverless360 BAM, track key properties and allow users to locate a transaction by querying for the property value. This also enables dynamic monitoring of transaction exceptions and any violations in the threshold limits set.
Dynatrace
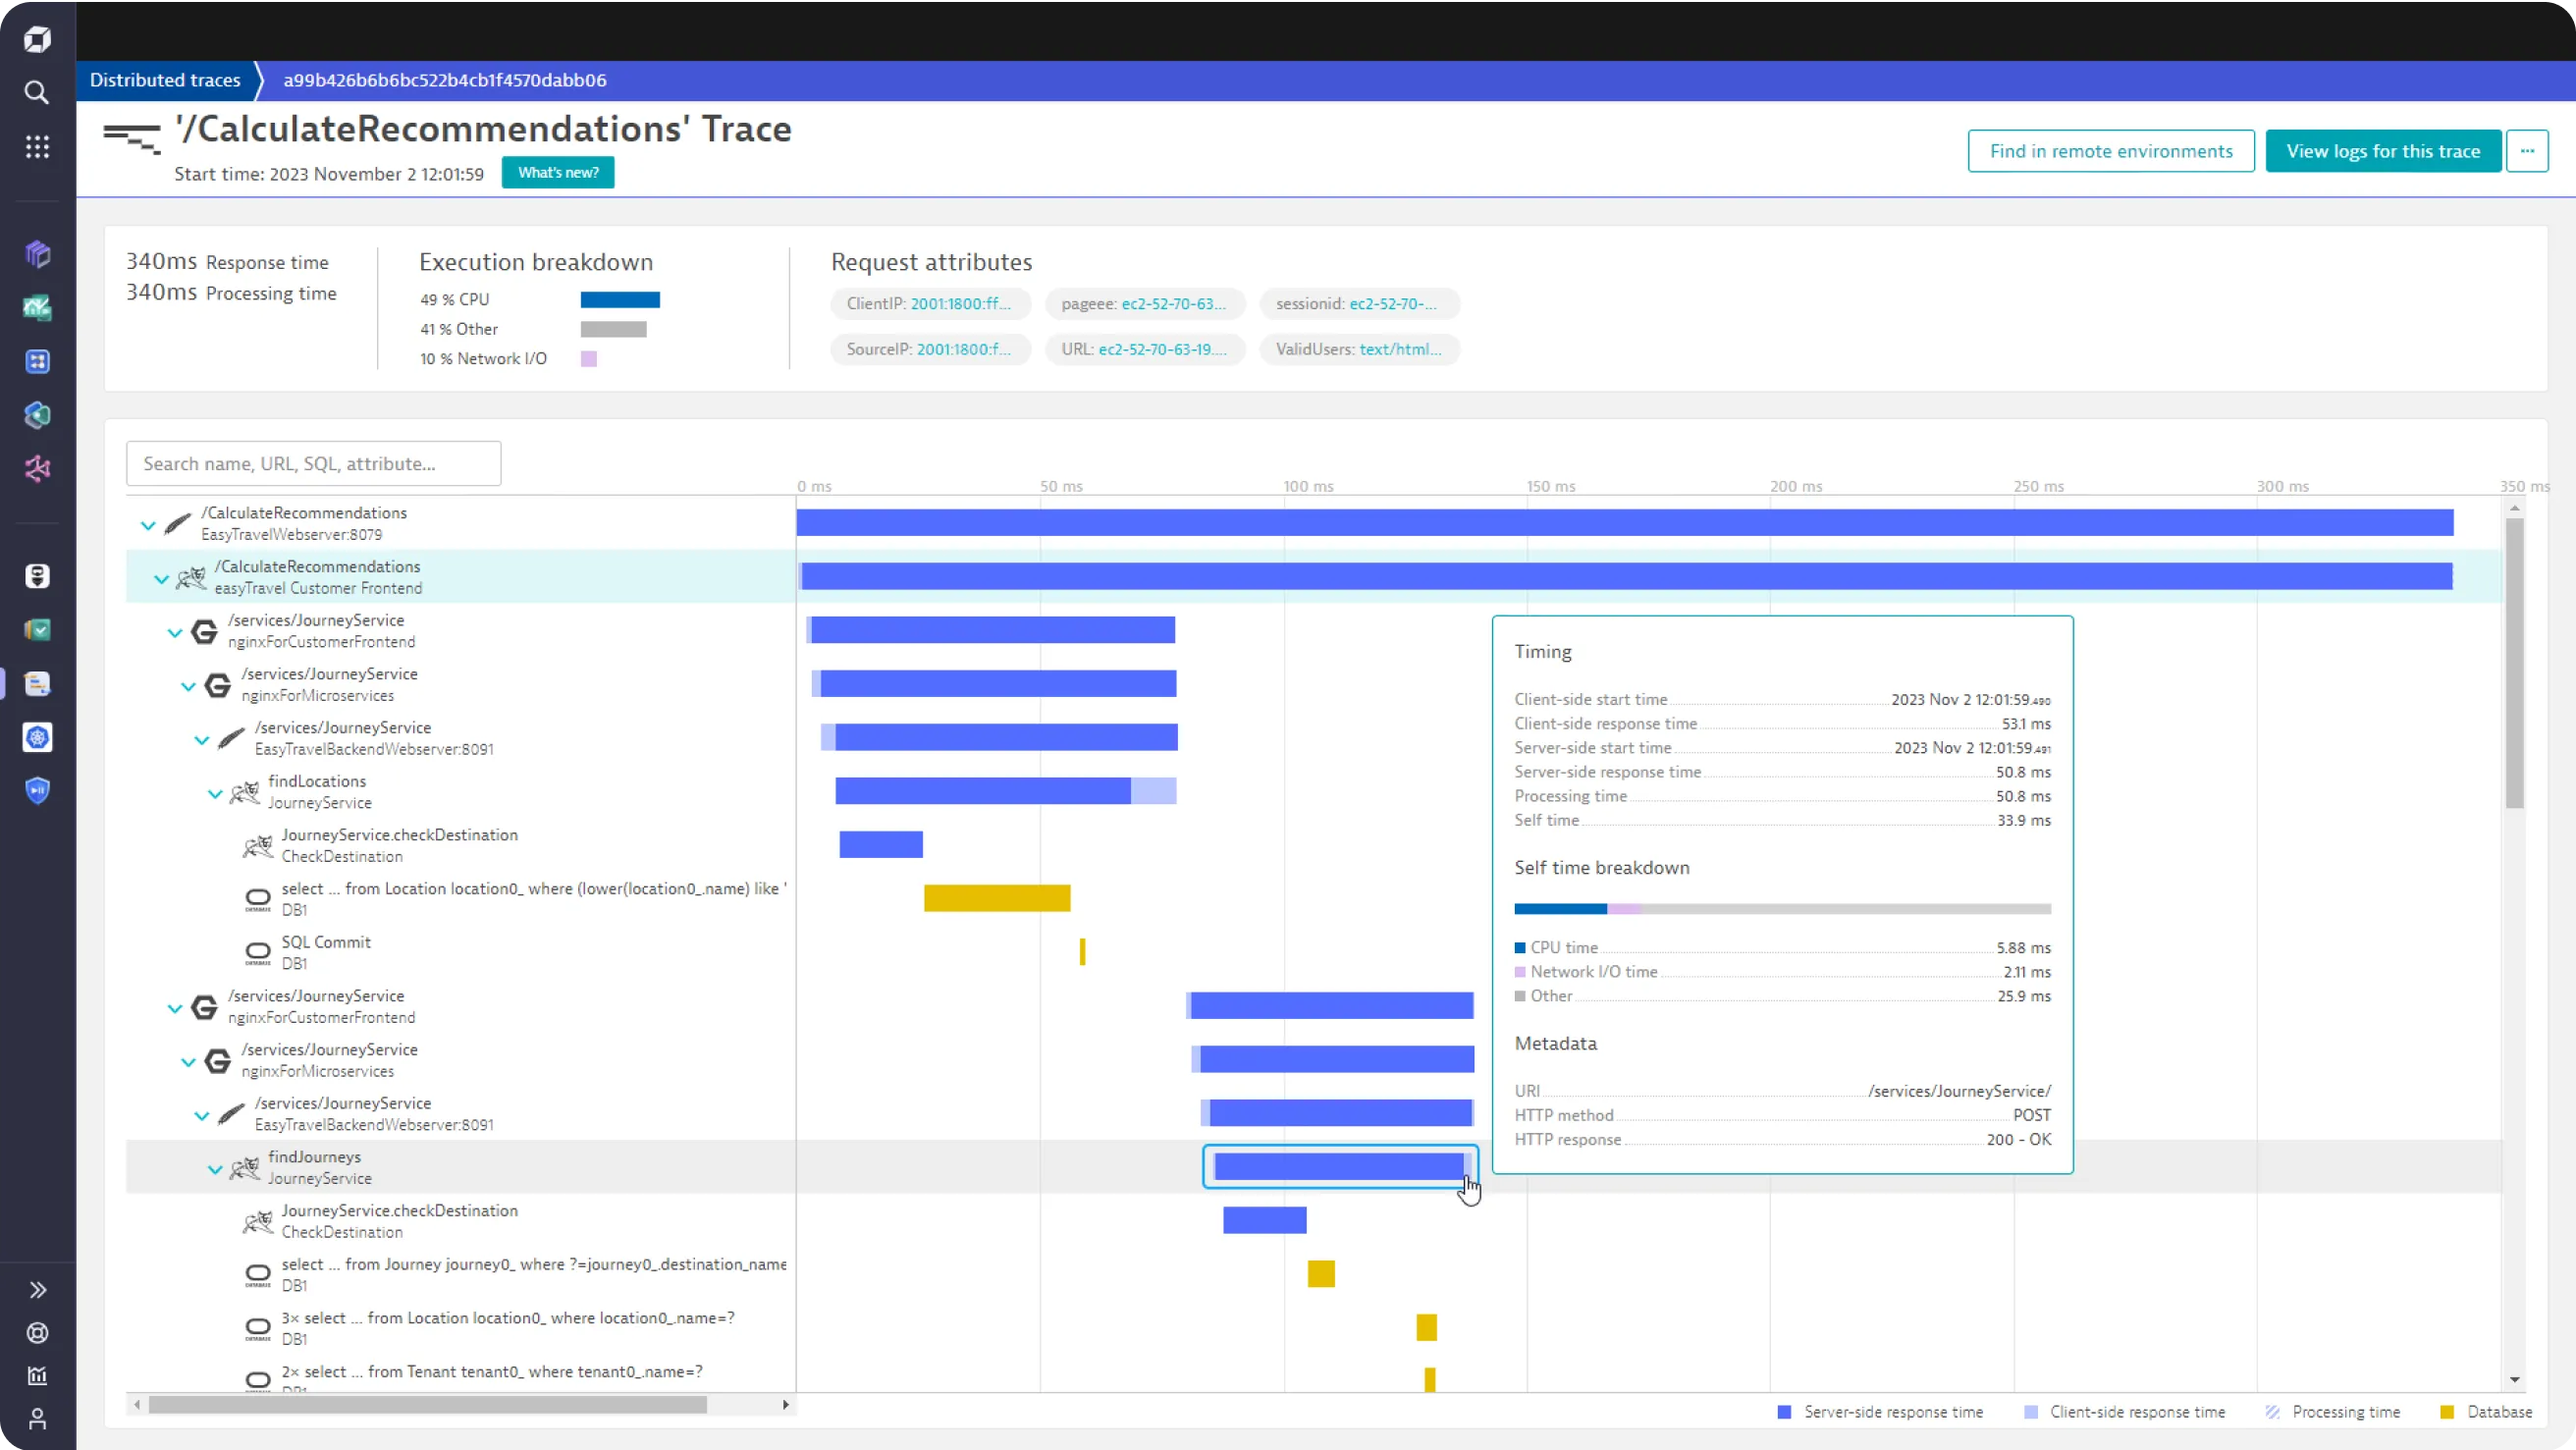
Dynatrace is an extensive SaaS enterprise tool targeting a broad spectrum of monitoring needs of large-scale enterprises. For distributed tracing, it provides a technology called [Purepath](https://www.dynatrace.com/platform/purepath/), which combines distributed tracing with code-level insights. When a user initiates a transaction with the application, PurePath gives the transaction a unique ID.
Some of the key features provided by the Dynatrace distributed tracing tool includes:
- Automatic injection and collection of data
- Code-level visibility across all application tiers for web and mobile apps together
- Always-on code profiling and diagnostics tools for application analysis
New Relic
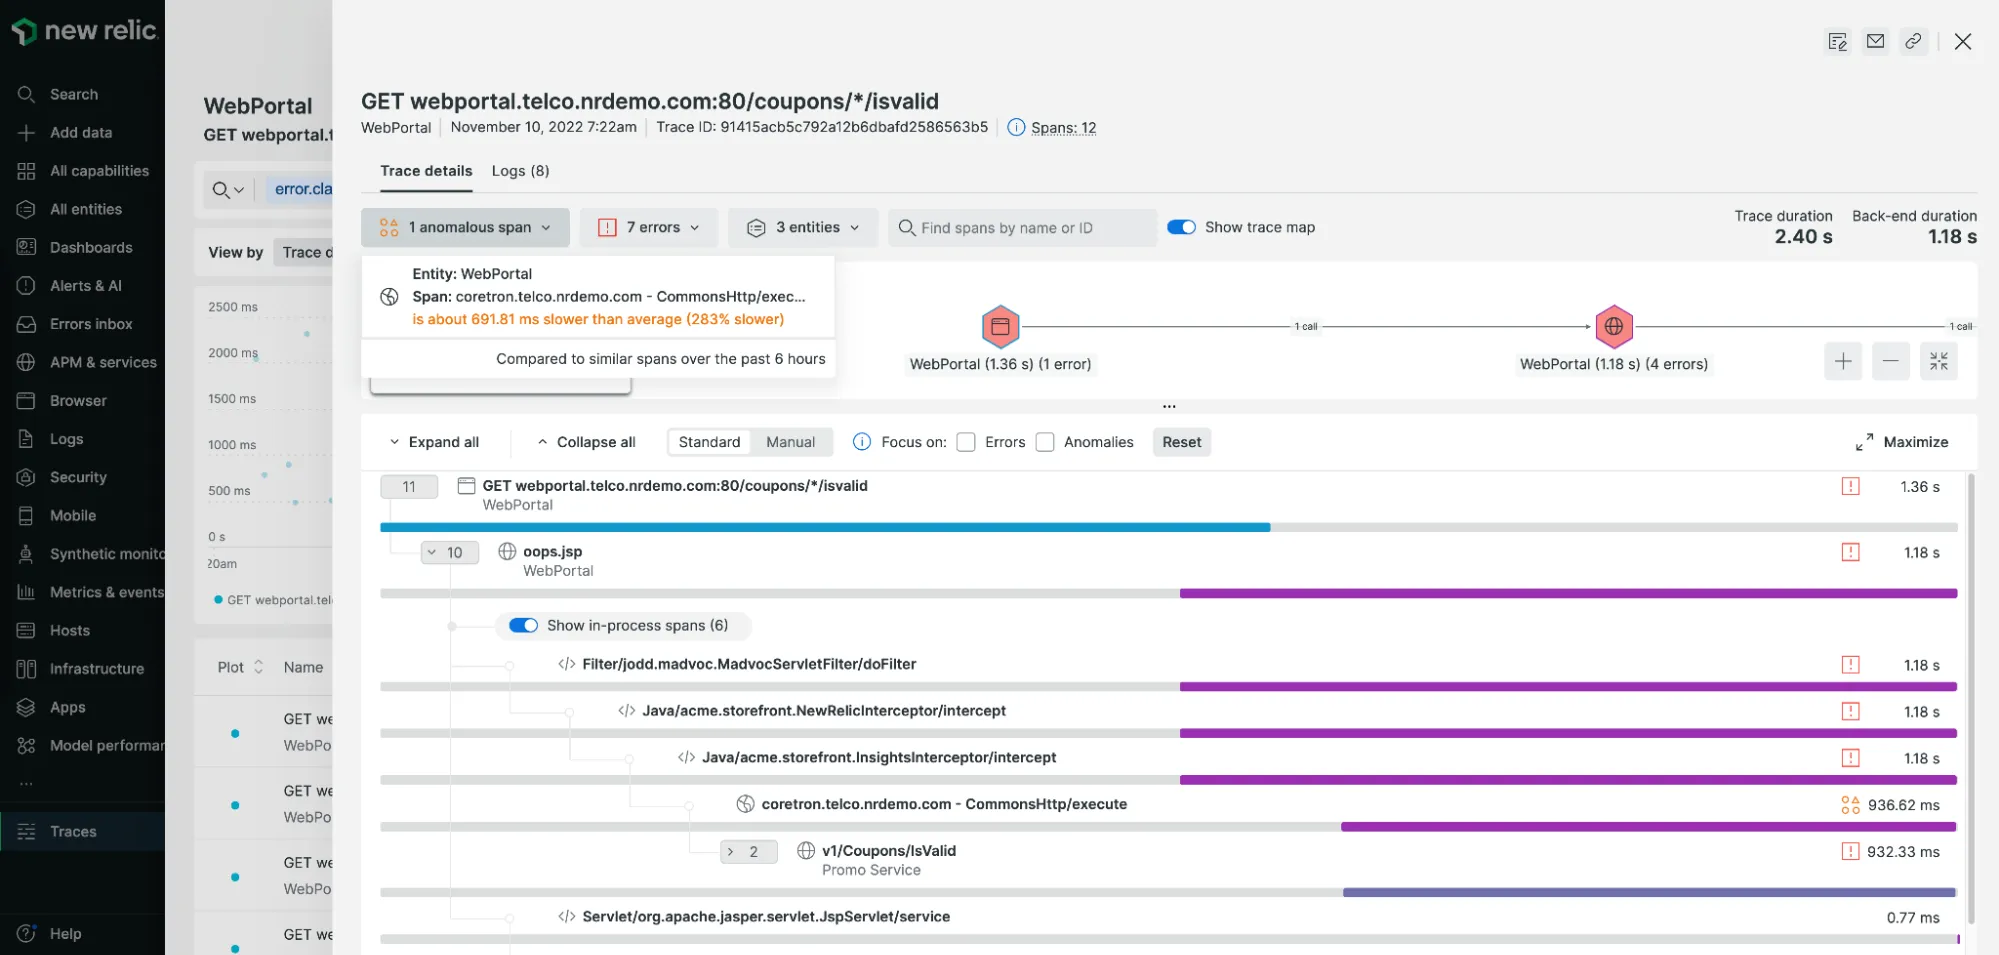
New Relic is one of the oldest companies in the application performance monitoring domain. It offers multiple solutions to enterprises for performance monitoring. For distributed tracing, it offers New Relic Edge, which can observe 100% of an application's traces.
Some of the key features of the New Relic distributed tracing tool includes:
- Distributed tracing and sampling options for a wide range of technology stack
- Support for open-source tracing tools and standards like OpenTelemetry
- Correlation of tracing data with other aspects of application infrastructure and user monitoring
- Fully managed cloud-native experience with on-demand scalability
Honeycomb
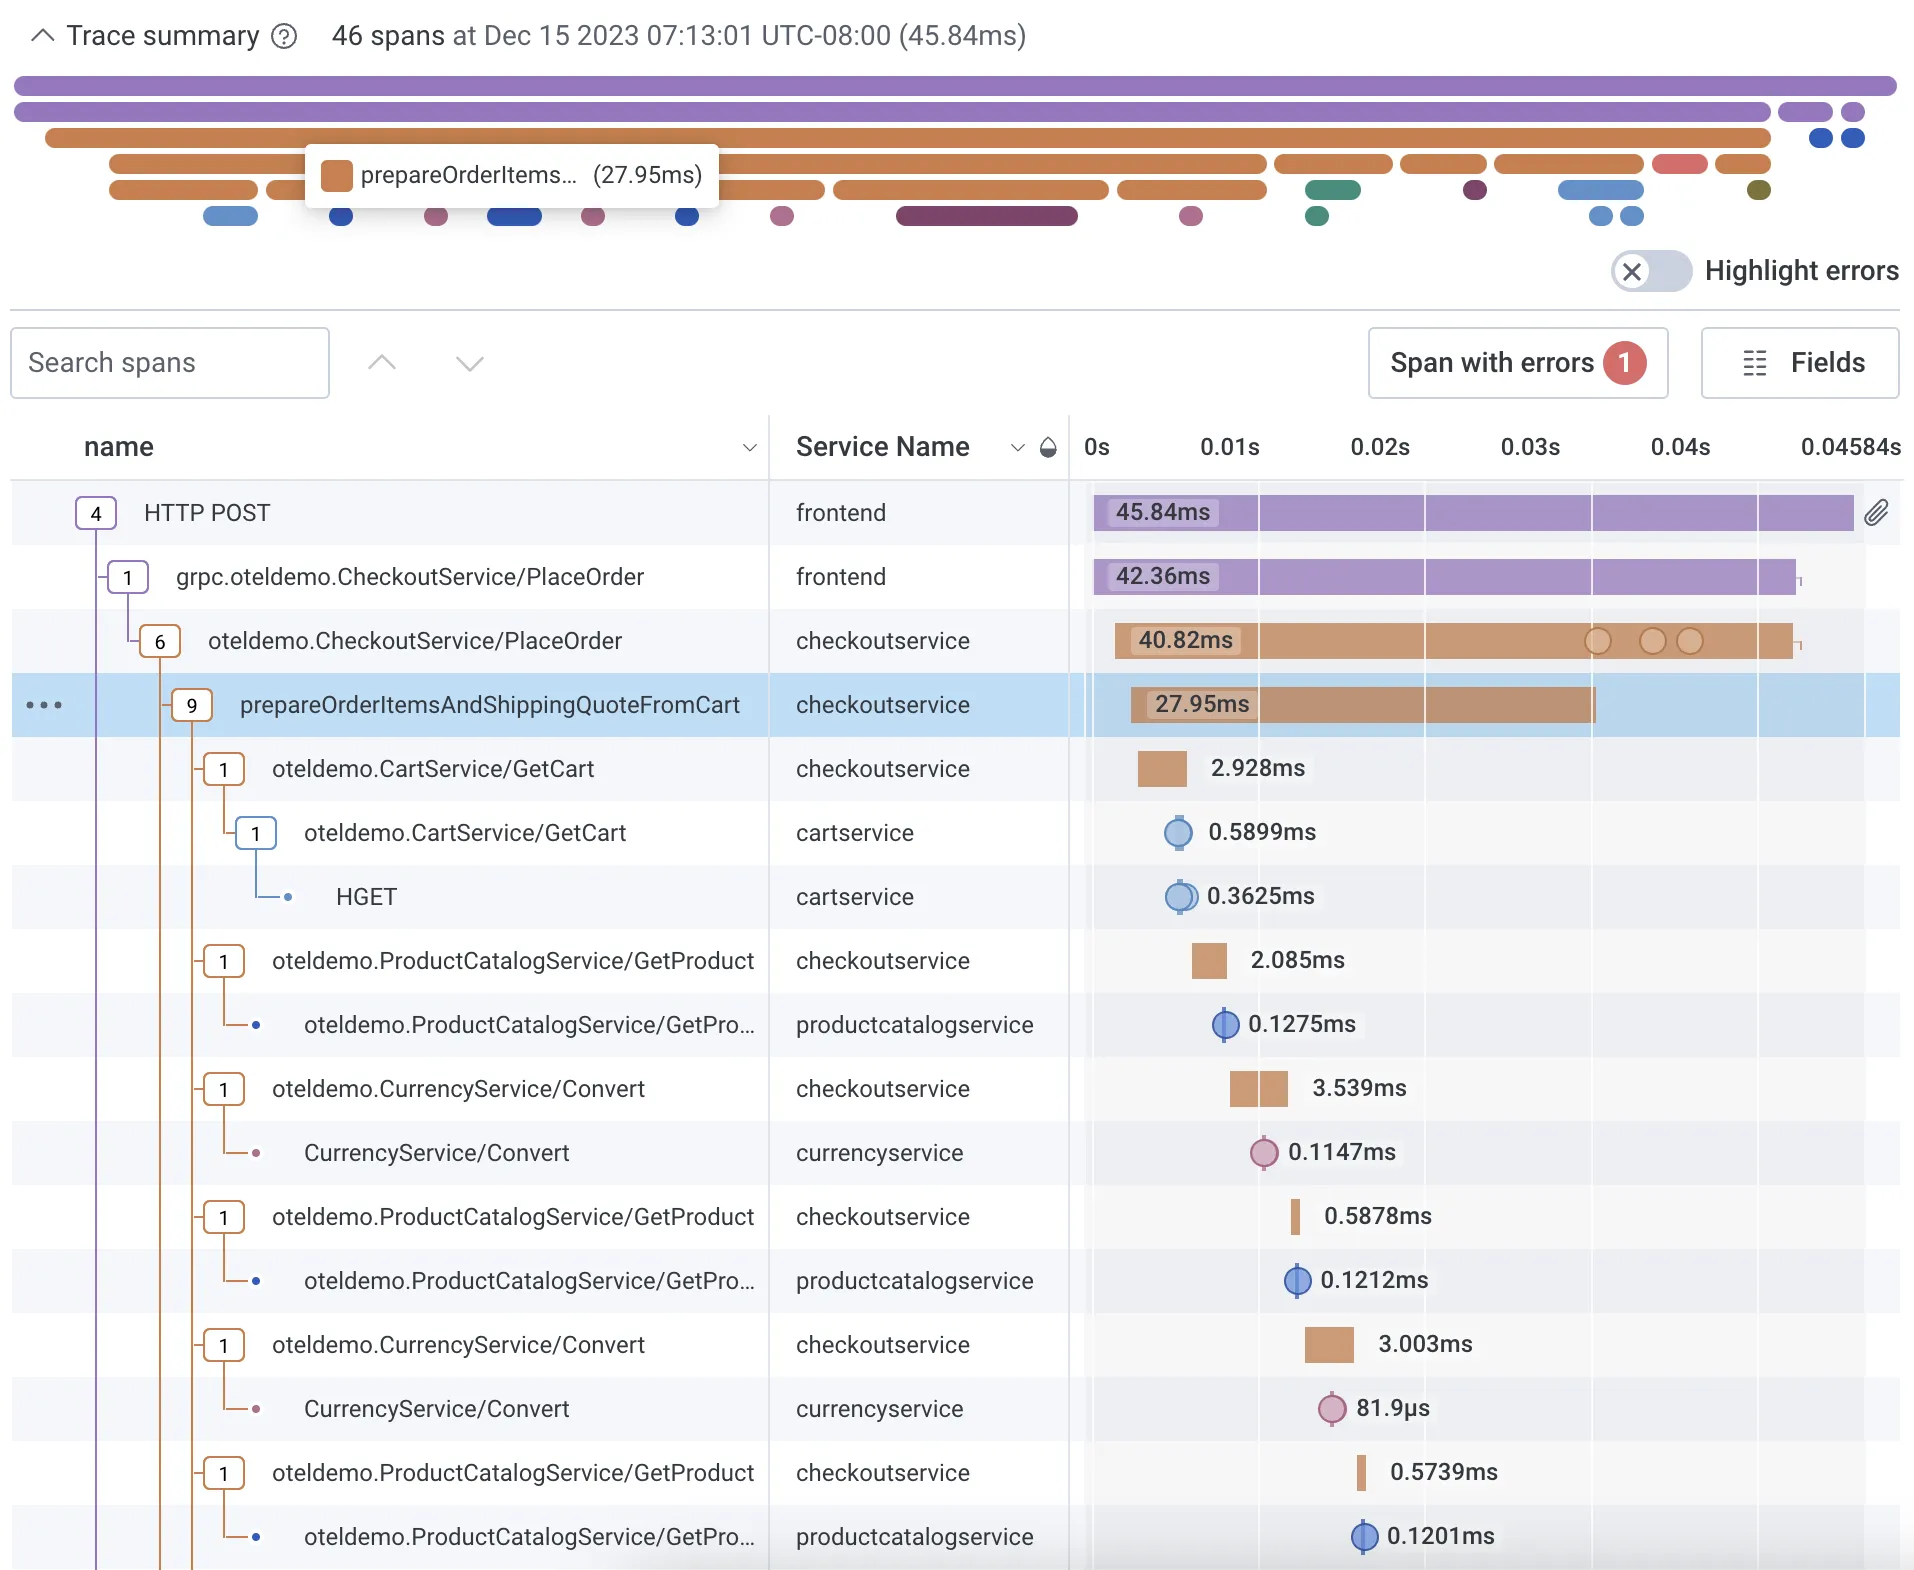
Honeycomb is a full-stack cloud-based observability tool with support for events, logs, and traces. Honeycomb provides an easy-to-use distributed tracing solution.
Some of the key features of the Honeycomb distributed tracing tool includes:
- Quickly diagnose bottlenecks and optimize performance with a waterfall view to understand how your system is processing service requests
- Full-text search over trace spans and toggle to collapse and expand sections of trace waterfalls
- Provides Honeycomb beelines to automatically define key pieces of trace data like serviceName, name, timestamp, duration, traceID, etc.
ServiceNow Cloud Observability
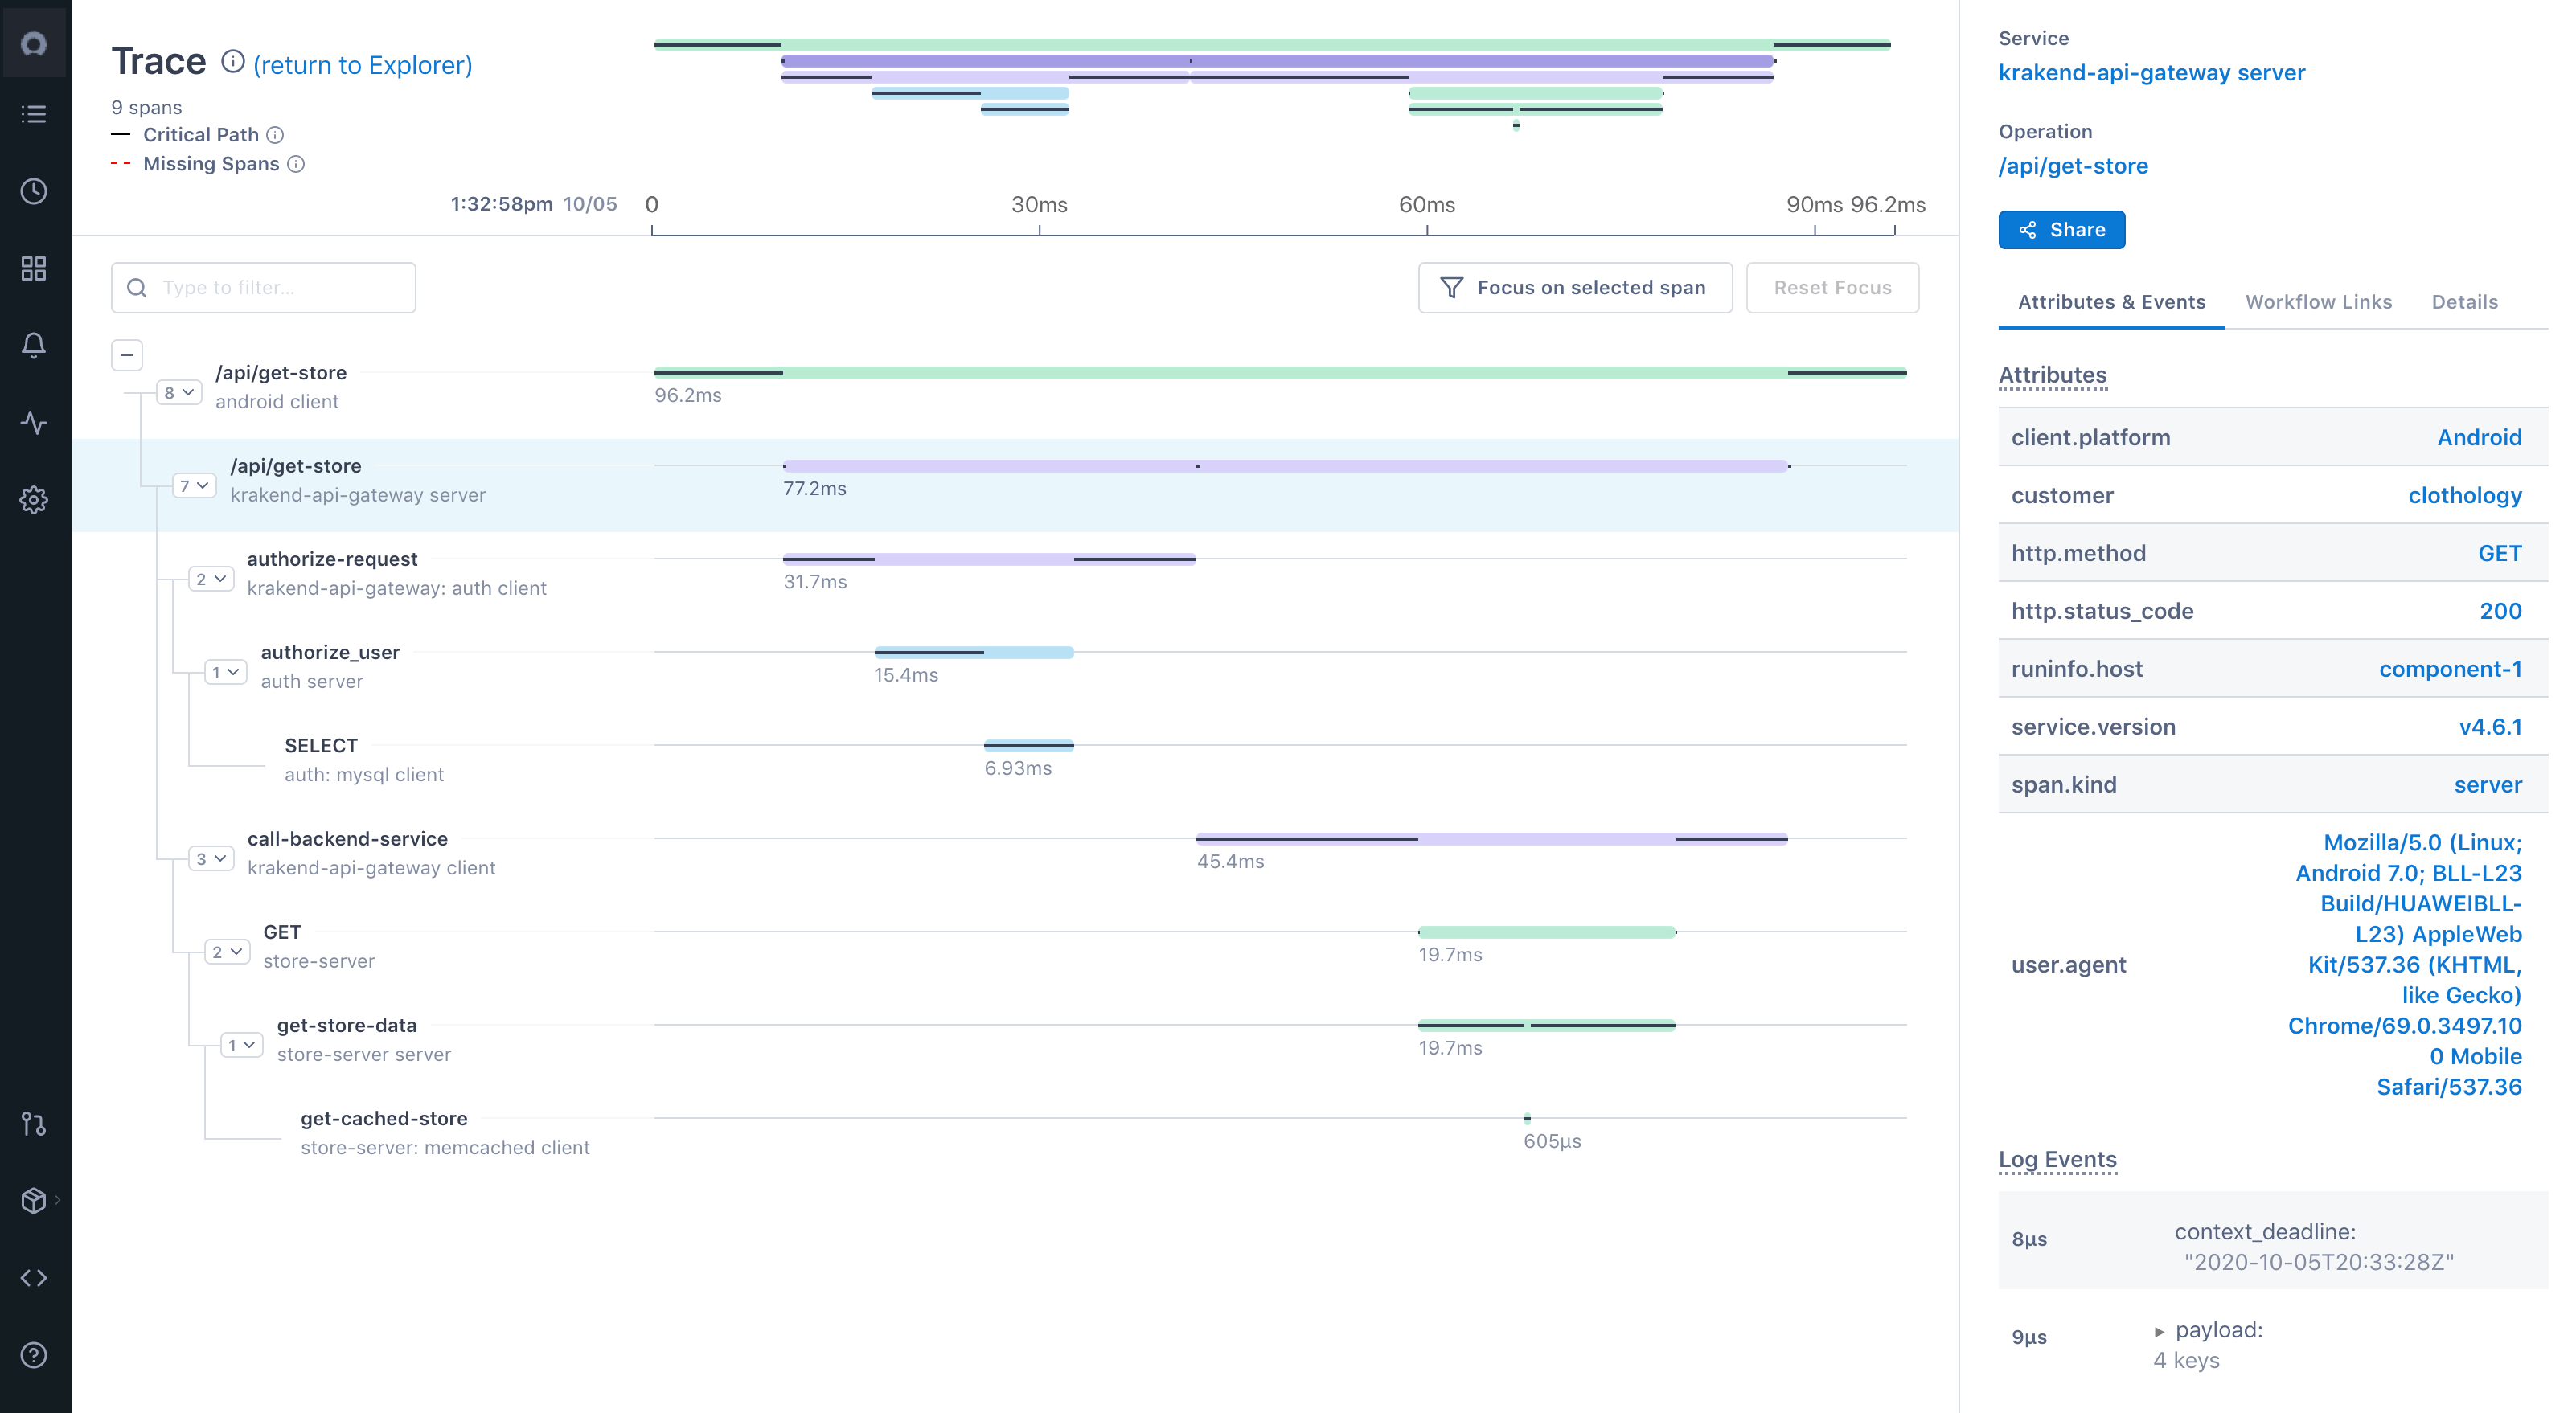
ServiceNow Cloud observability is a distributed tracing tool that provides complete visibility to distributed systems based on microservices and multi-cloud environment. It uses open-source friendly data ingestion methods and is built to support applications of any scale.
Some of the key features of the Lightstep distributed tracing tool includes:
- Move seamlessly from a high-level view of dependencies to specific services, operations, traces, or any other signals contributing to issues in production
- Provides full-context root cause analysis with exact logs, metrics, and traces to simplify and solve complex investigations
- Auto-instrumentation libraries powered by OpenTelemetry
Instana
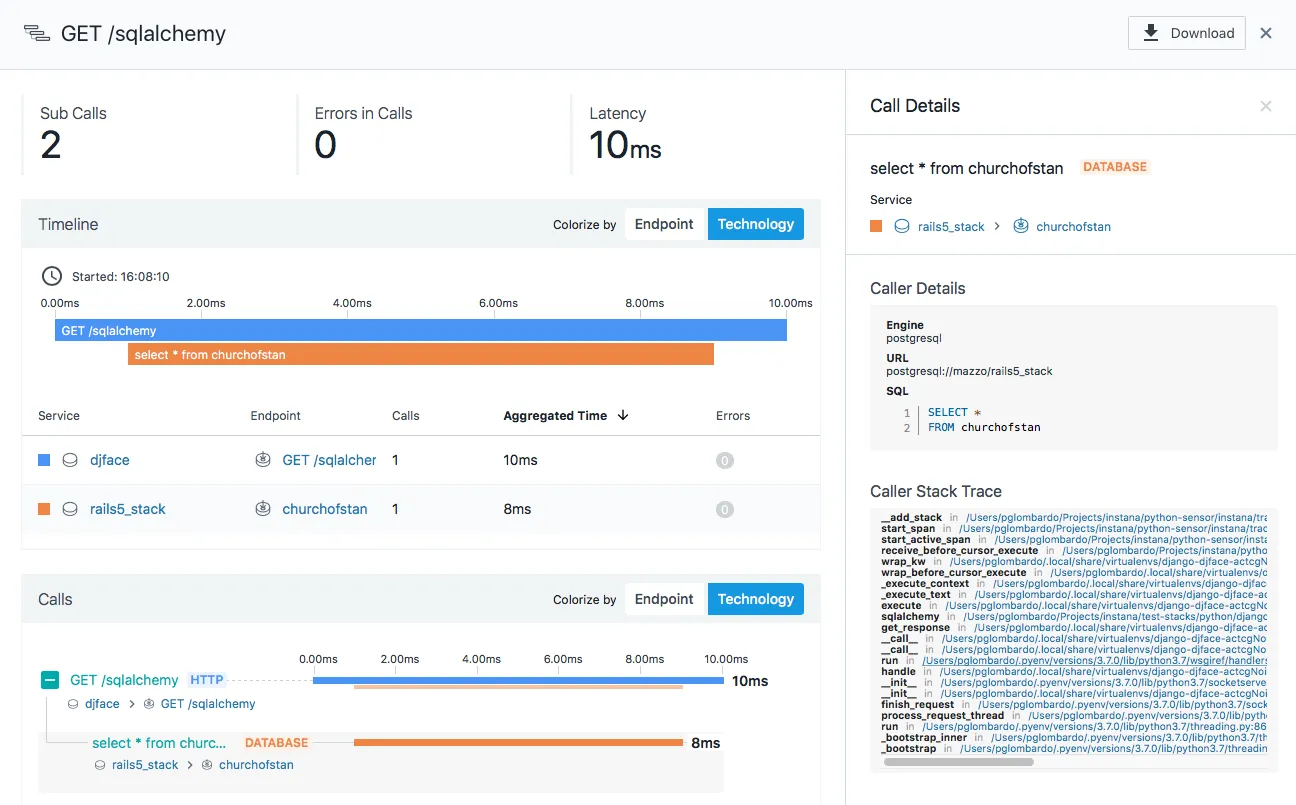
Instana is a distributed tracing tool aimed at microservice applications. The Instana platform offers website monitoring, cloud & infrastructure monitoring, observability platform apart from distributed tracing of microservice applications.
Some of the key features of the Instana distributed tracing tool includes:
- A single, lightweight agent per host to continually discover and monitor all components of the technology stack
- Dependency Map to continuously model application services and infrastructure
- Enriched trace data with information about the underlying service, application, and system infrastructure
- Root cause analysis with a correlated sequence of events and issues identifying the exact source of the problem
DataDog
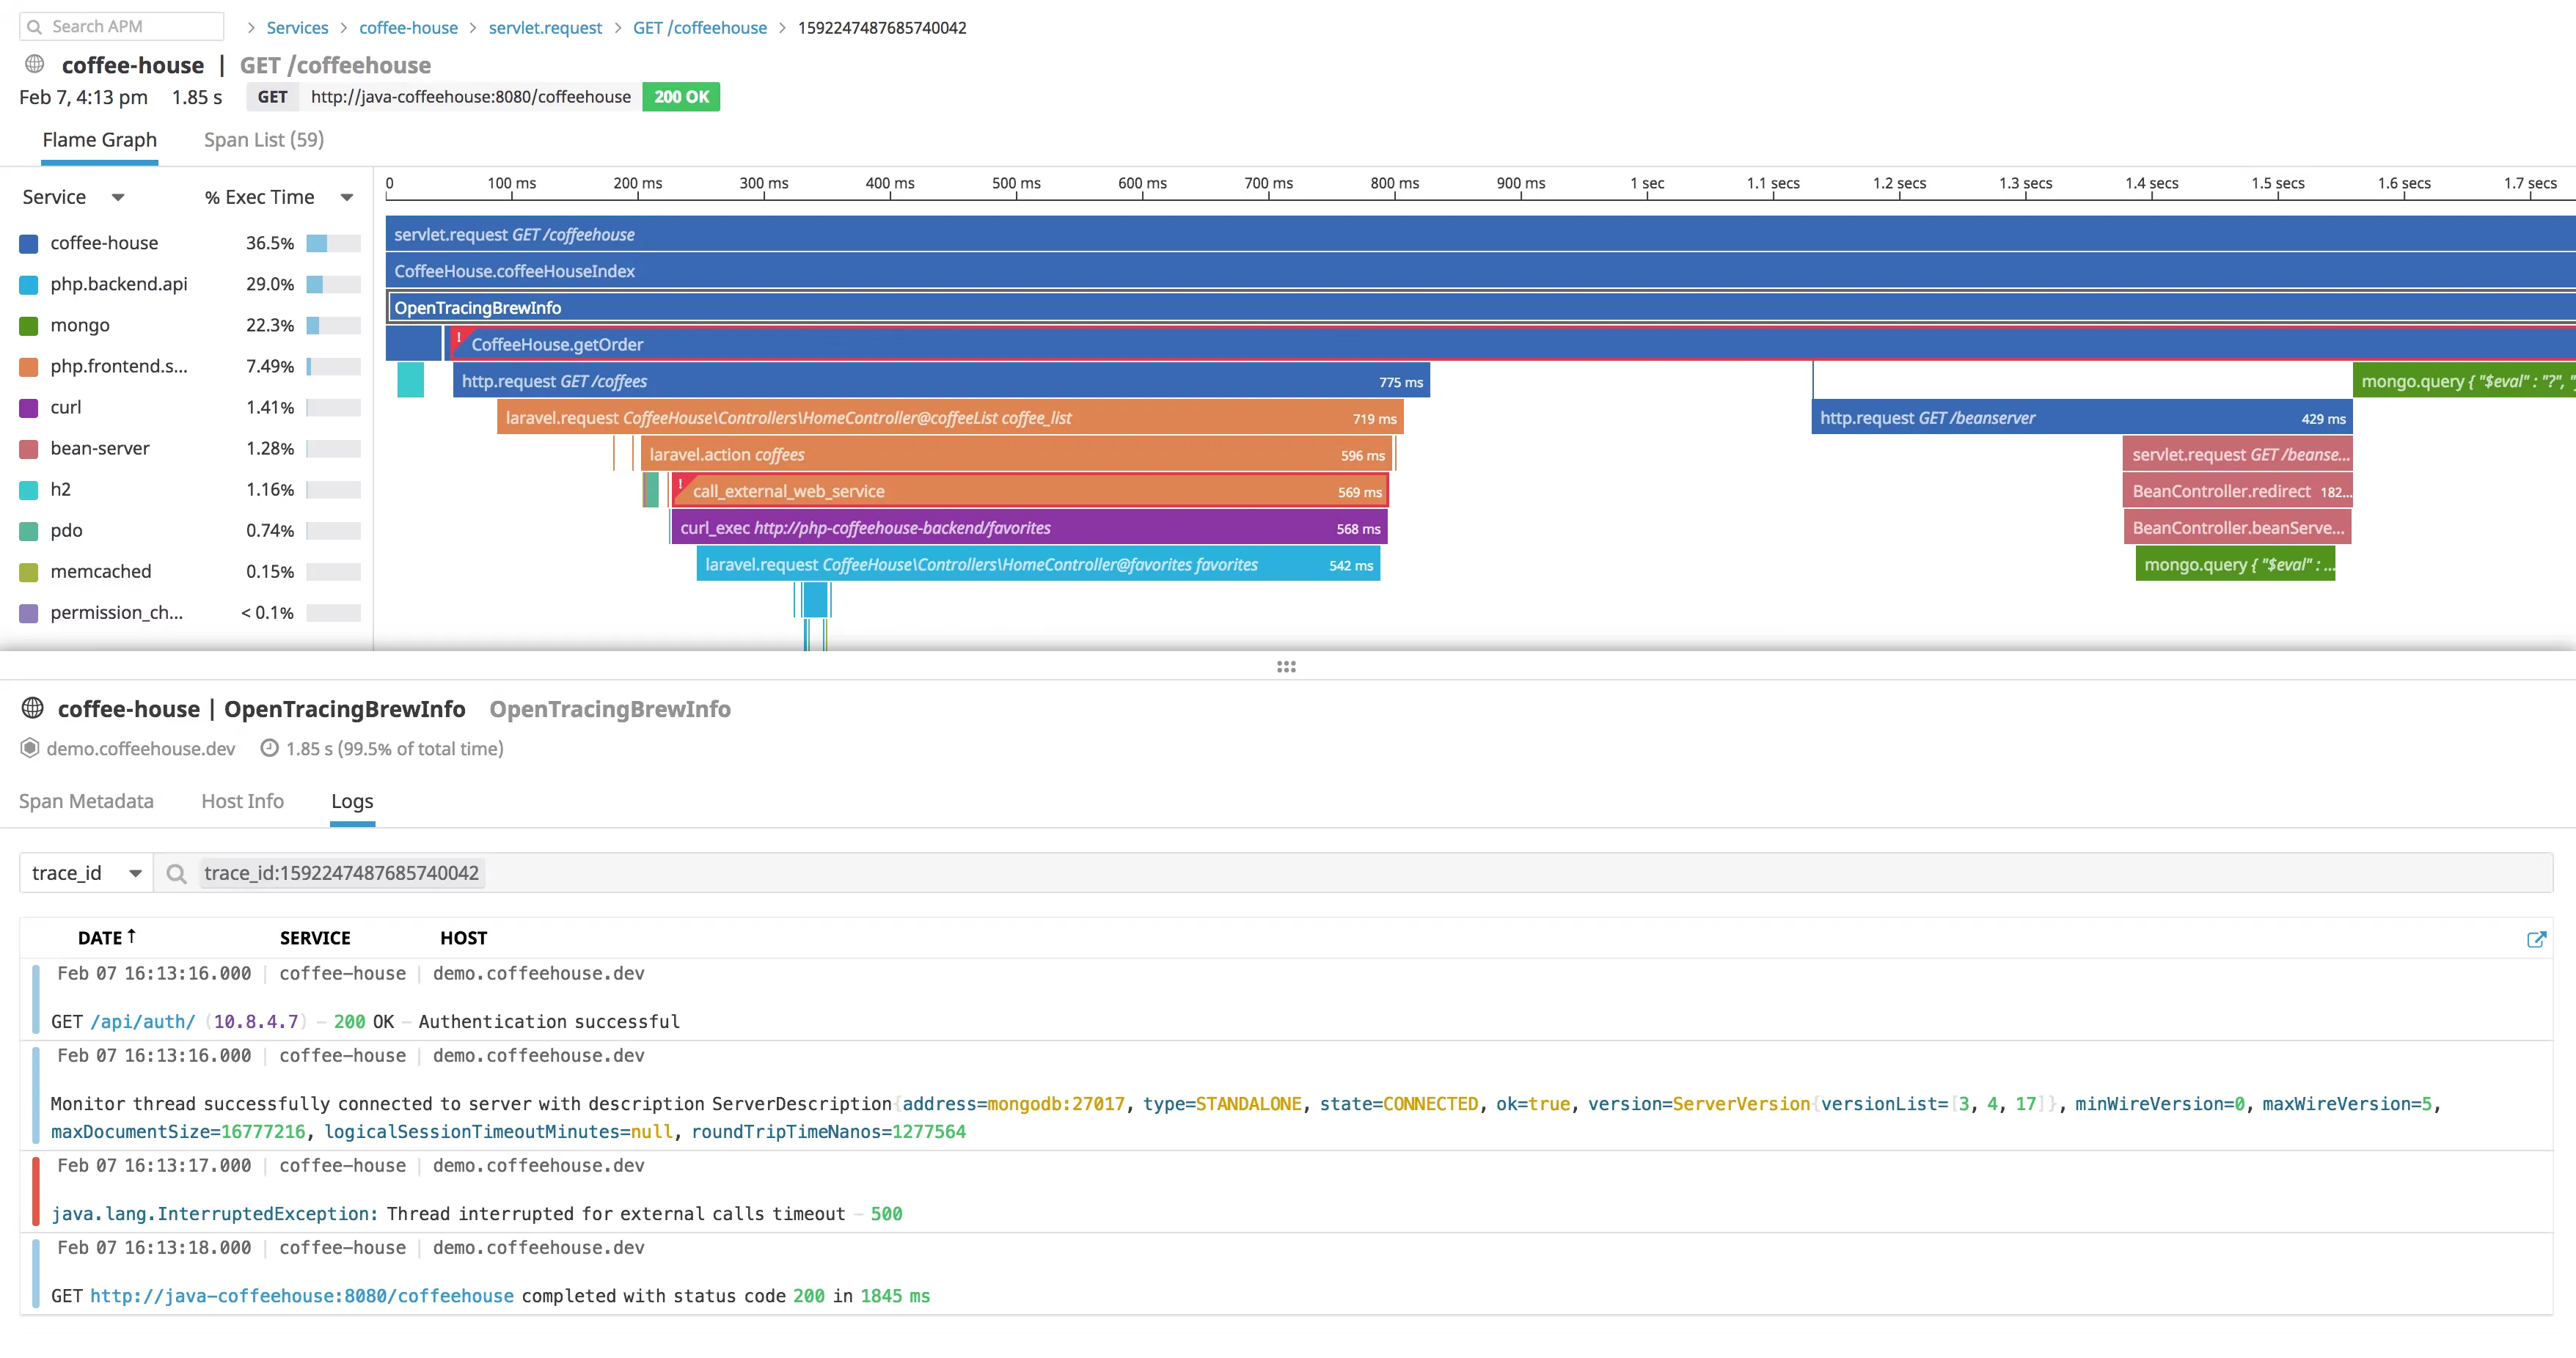
DataDog is an enterprise APM tool that provides monitoring products ranging from infrastructure monitoring, log management, network monitoring to security monitoring. Its application performance monitoring tool has distributed tracing capabilities.
Some of the key features of DataDog APM, which provides distributed tracing capabilities, includes:
- Out of box performance dashboards for web services, queues, and databases to monitor requests, errors, and latency
- Correlation of distributed tracing to browser sessions, logs, profiles, network, processes, and infrastructure metrics
- Can ingest 50 traces per second per APM host
- Service maps to understand service dependencies
Elastic APM
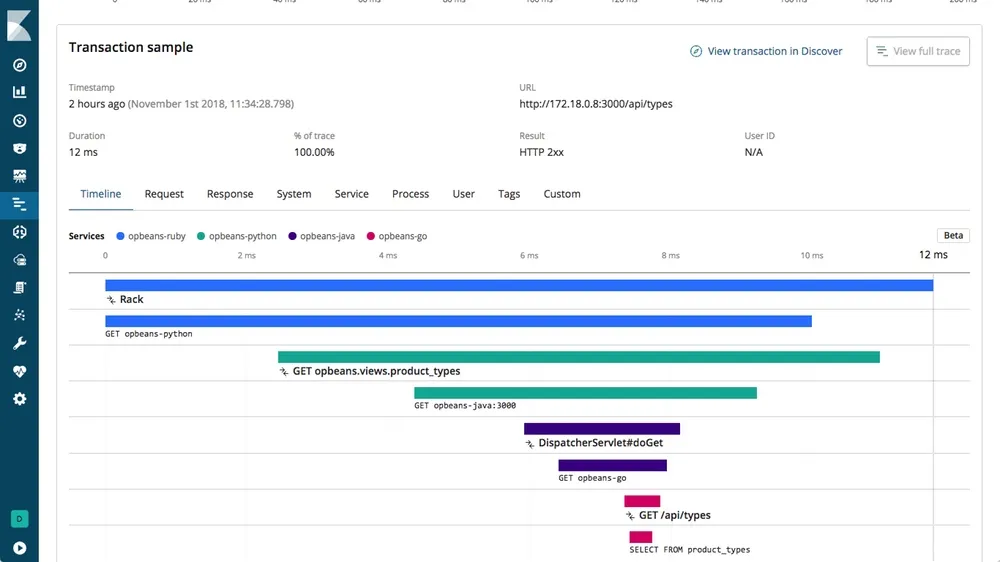
Elastic APM is an Application Performance Monitoring system built on the Elastic Stack - ElasticSearch, Logstash, and Kibana. It consists of four components:
- Elasticsearch - For data storage and indexing
- Kibana - For analyzing and visualizing the data
- APM agents - Collects the data to send to the APM server
- APM server - Receives data from APM agents and process it for storing in Elasticsearch
Splunk
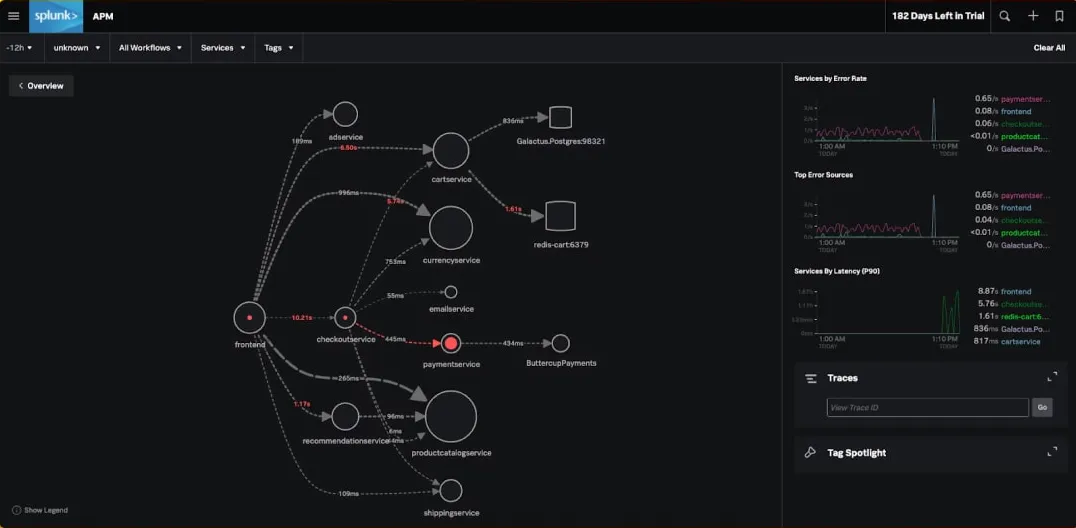
Splunk provides a distributed tracing tool that can ingest all application data for a high-fidelity analysis. It stores all trace data in Splunk Cloud's offering.
Some of the key features of the Splunk distributed tracing tool includes:
- No sample full fidelity trace data ingestion
With Splunk, you can capture all trace data to ensure your cloud-native application work the way it is supposed to. - Full-stack observability
Splunk APM provides a seamless correlation between infrastructure metrics and application performance metrics. - AI-Driven troubleshooting
Splunk APM provides uses an AI-driven approach to identify error-prone microservices.
How to choose the right distributed tracing tool?
Tracing user requests is now critical for maintaining an exemplary user experience. Yes, distributed tracing directly impacts end-user experience as it gives your teams the right insights in the right amount of time to act on issues affecting application performance.
In our view, distributed tracing tools should be developer first tools. As developers directly utilize these tools in critical situations, the codebase of the tools should be open-source. Open-source is the future of all software tools.
Transparency and collaboration are some key benefits of open-source software tools. Developers want to see the code first hand, and if there are issues they want to address, they prefer to reach out to an active developer community than a customer support team.
At the same time, most open-source tools don't provide the same user experience as provided by SaaS vendors. But it doesn't have to be that way. With that objective, we created SigNoz.
SigNoz is a full-stack open-source application performance monitoring and observability tool. It provides a unified UI for both metrics and traces. Log management is also in the product roadmap and will be launched seen.
Getting started with SigNoz
SigNoz cloud is the easiest way to run SigNoz. Sign up for a free account and get 30 days of unlimited access to all features.
You can also install and self-host SigNoz yourself since it is open-source. With 16,000+ GitHub stars, open-source SigNoz is loved by developers. Find the instructions to self-host SigNoz.


