DataDog vs New Relic - The Real Winner [2024 Guide]
Both DataDog and New Relic are popular monitoring tools that provide a wide range of products covering different aspects of application and infrastructure monitoring. In this post, I have compared Datadog and New Relic on important features like APM, log management, infrastructure monitoring, OpenTelemetry support, etc.
💡 I instrumented a sample Spring Boot Application and sent data to Datadog and New Relic to evaluate my experience. Some takeaways are subjective and based on personal preference.

Datadog vs New Relic: Overview
For application monitoring, both Datadog and New Relic offer the same features. The difference lies in the actual user experience. Datadog has features for security management like Cloud SIEM, which is lacking in New Relic.
My research found that Datadog gives you more granular controls, while New Relic feels simpler to start with.
Here’s a quick overview of the overall platform features and functionality of Datadog and New Relic.
| Feature | DataDog | New Relic |
|---|---|---|
| APM | ✅ | ✅ |
| Log Management | ✅ | ✅ |
| Infrastructure Monitoring | ✅ | ✅ |
| Network Monitoring | ✅ | ✅ |
| Cloud SIEM | ✅ | ❌ |
| Real User Monitoring | 🟡 | ✅ |
| Application Security | ✅ | 🟡 |
| Log Archives | ✅ | 🟡 |
| Container Monitoring | ✅ | 🟡 |
| Free Tier | ❌ | ✅ (100GB free data per month) |
✅ - Available
❌ - Not Available
🟡 - Limited
APM: Datadog for more control, New Relic for Simplicity
I instrumented a sample Java application and sent data to both Datadog and New Relic for APM. The steps are almost the same in both Datadog and New Relic, with New Relic having a few extra steps. Both New Relic and Datadog require you to install their agent as well as a programming language-specific agent, which, in my case, was a Java agent.
In Datadog, I had a hard time figuring out whether my setup was complete or not, and I found the onboarding flow of New Relic much better.
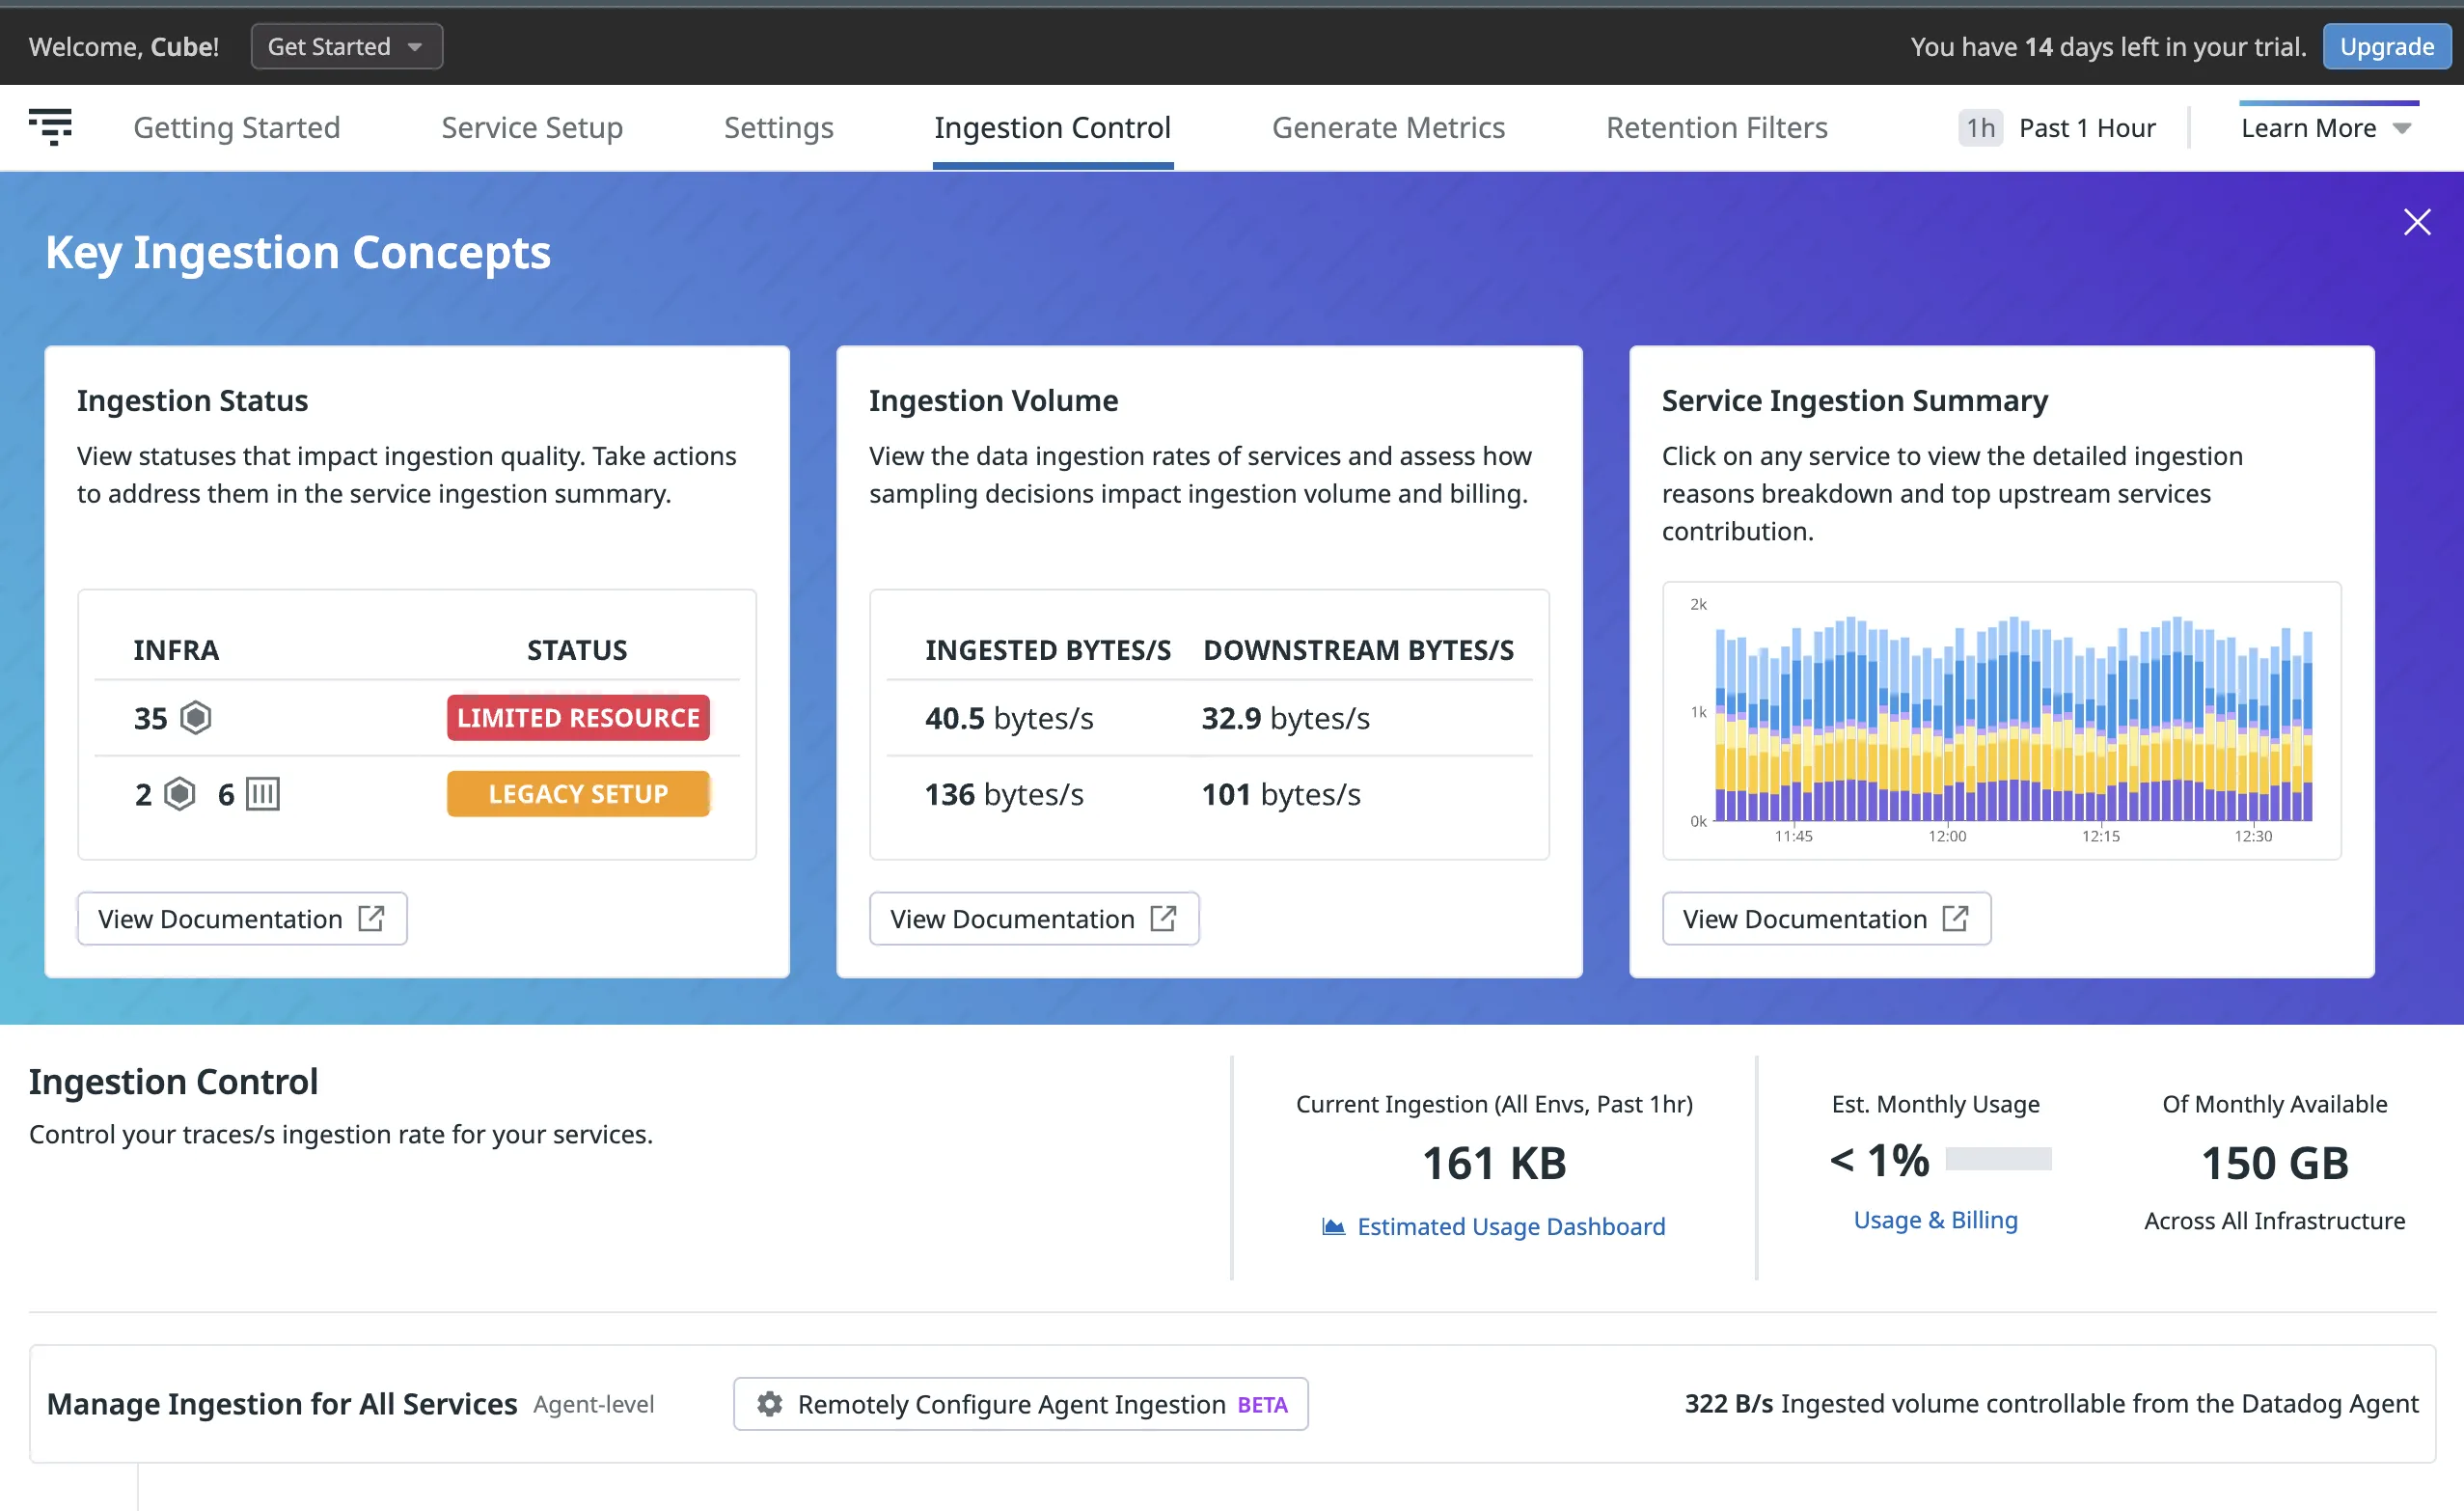
The good thing about Datadog is it gives you a lot of control. You can set up things like collecting custom metrics (which might be expensive), sampling rate, and telemetry correlation between traces and logs right from the beginning.
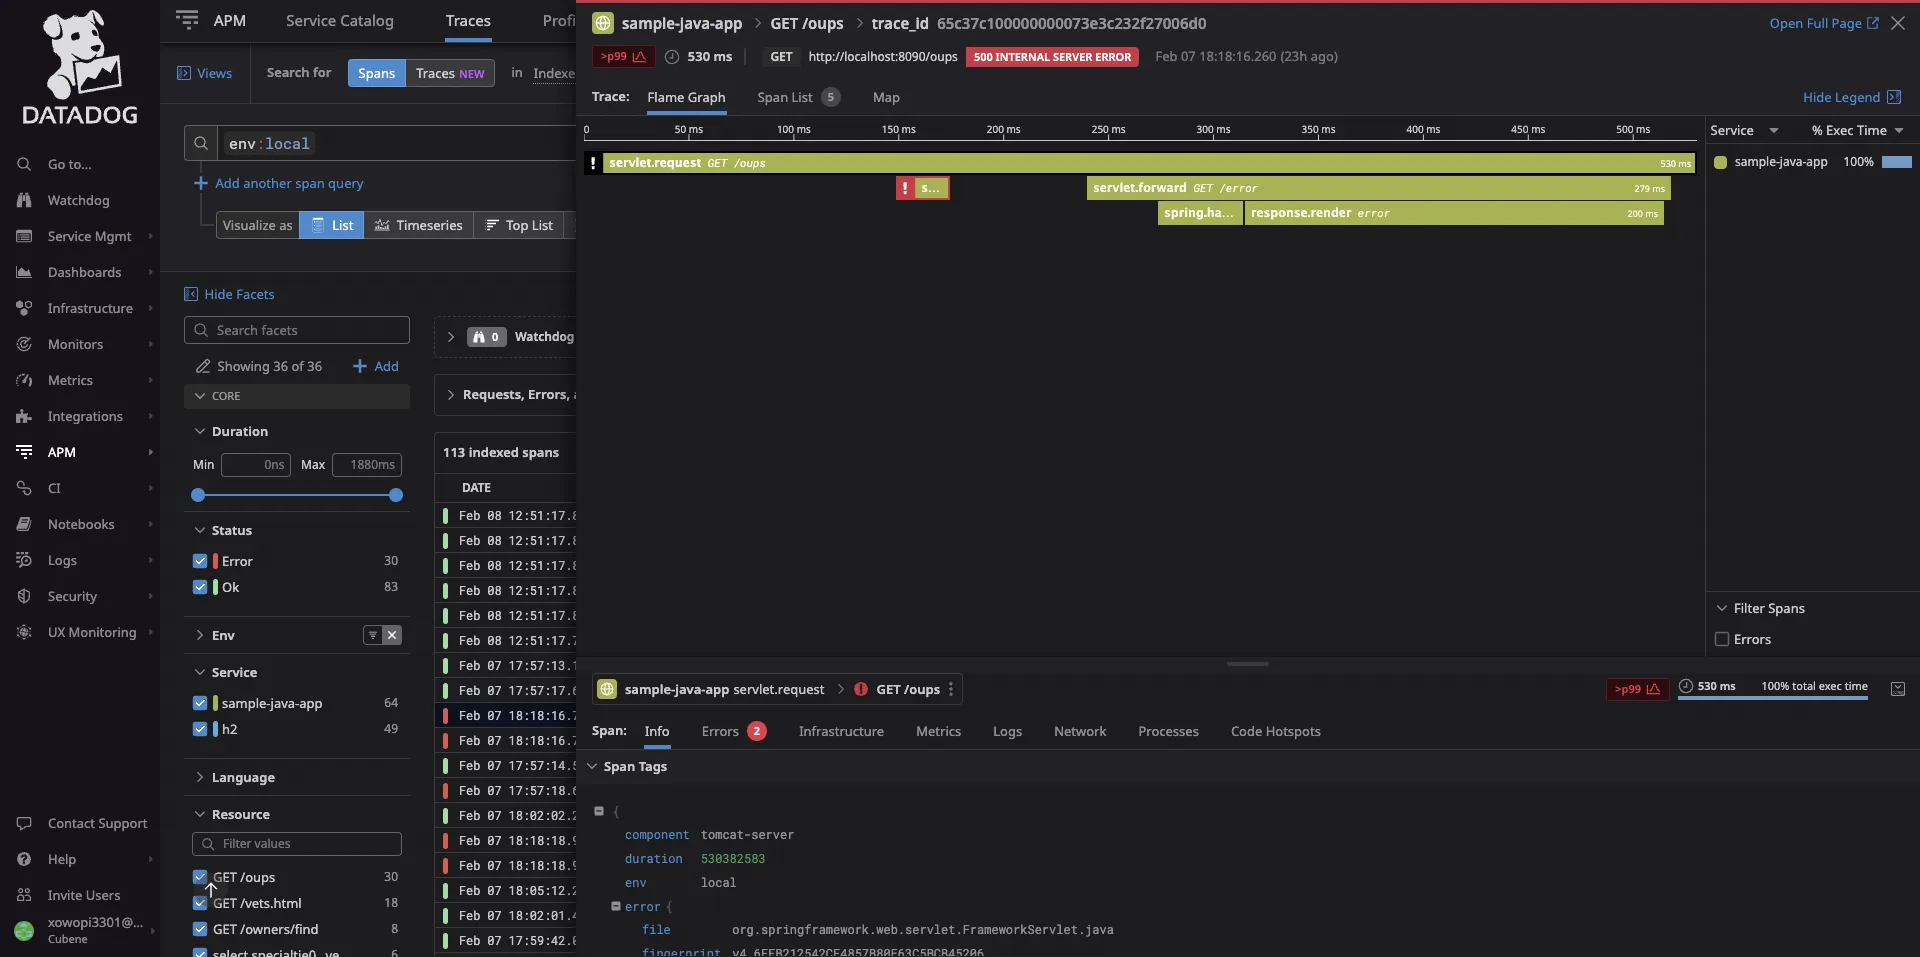
Once the setup is done, you can see your list of spans and corresponding flamegraphs for your traces. Datadog does a good job of correlating different types of signals. You can relate info from infrastructure, metrics, network, etc., right from trace data if you have those products enabled.
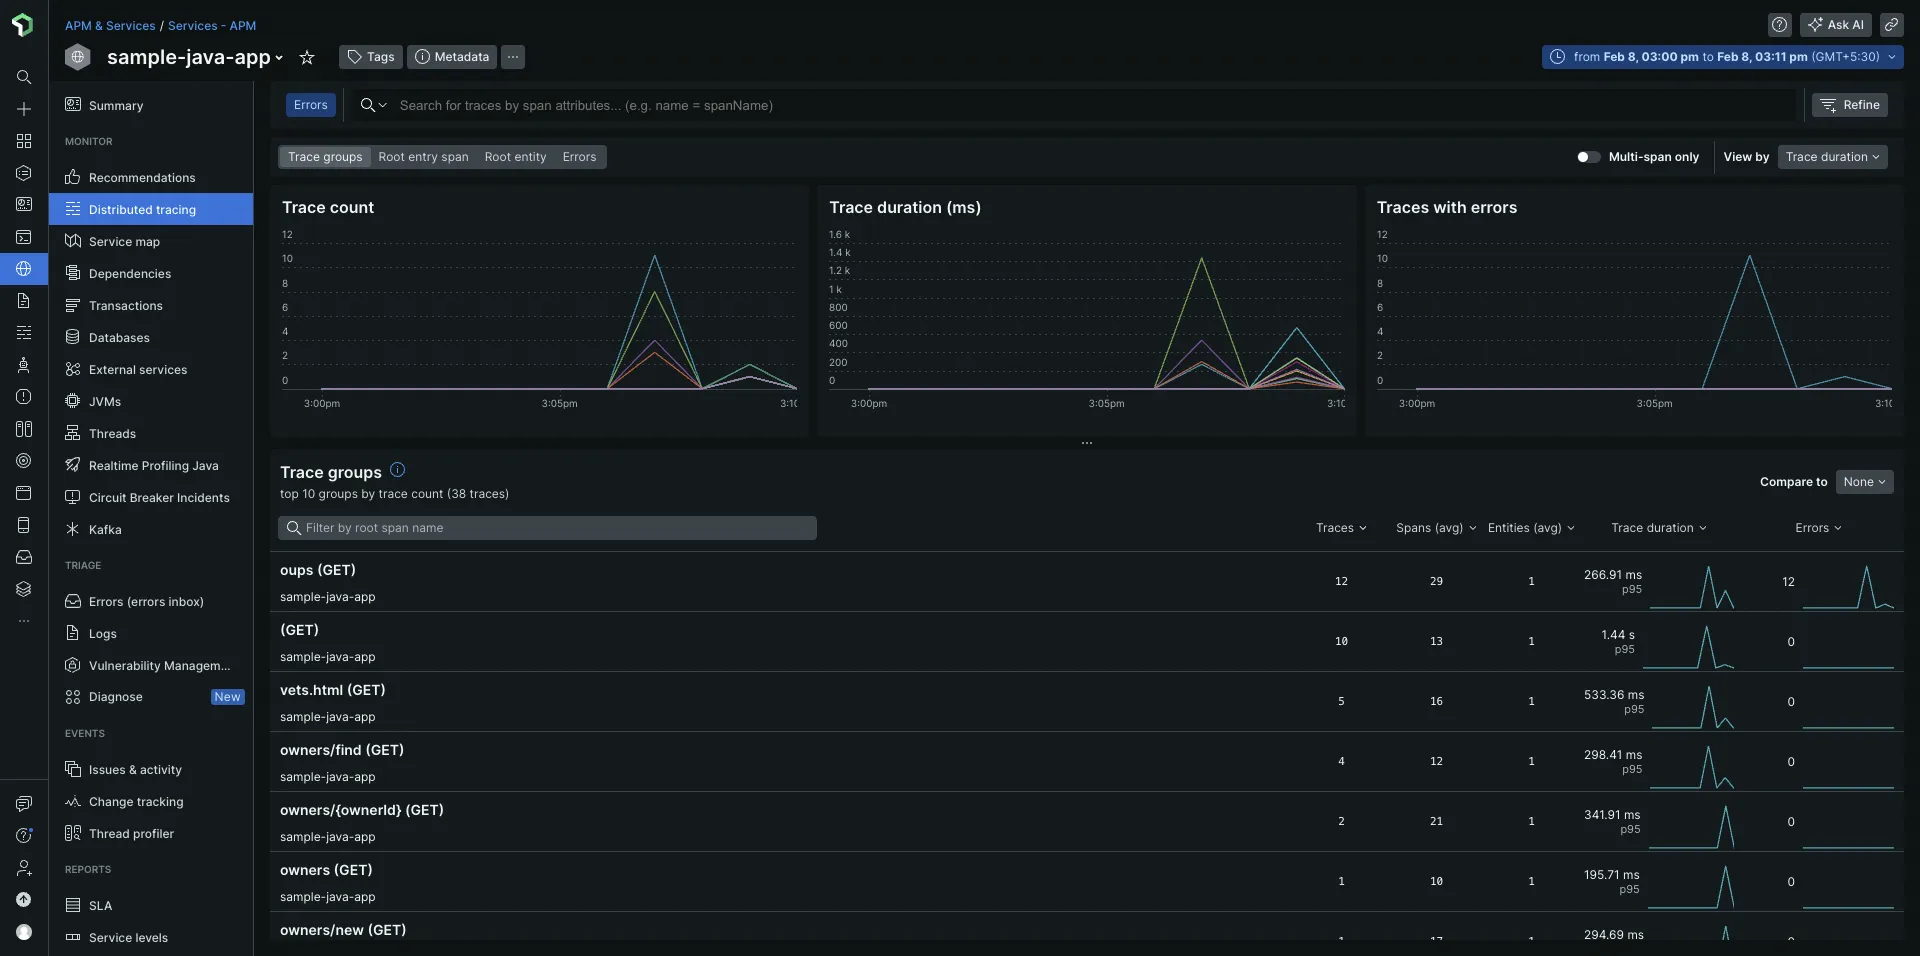
New Relic’s traces page shows Trace groups instead of a list of spans, which feels like a cleaner representation, and you can filter by root spans, which comes in handy in case of large trace groups.
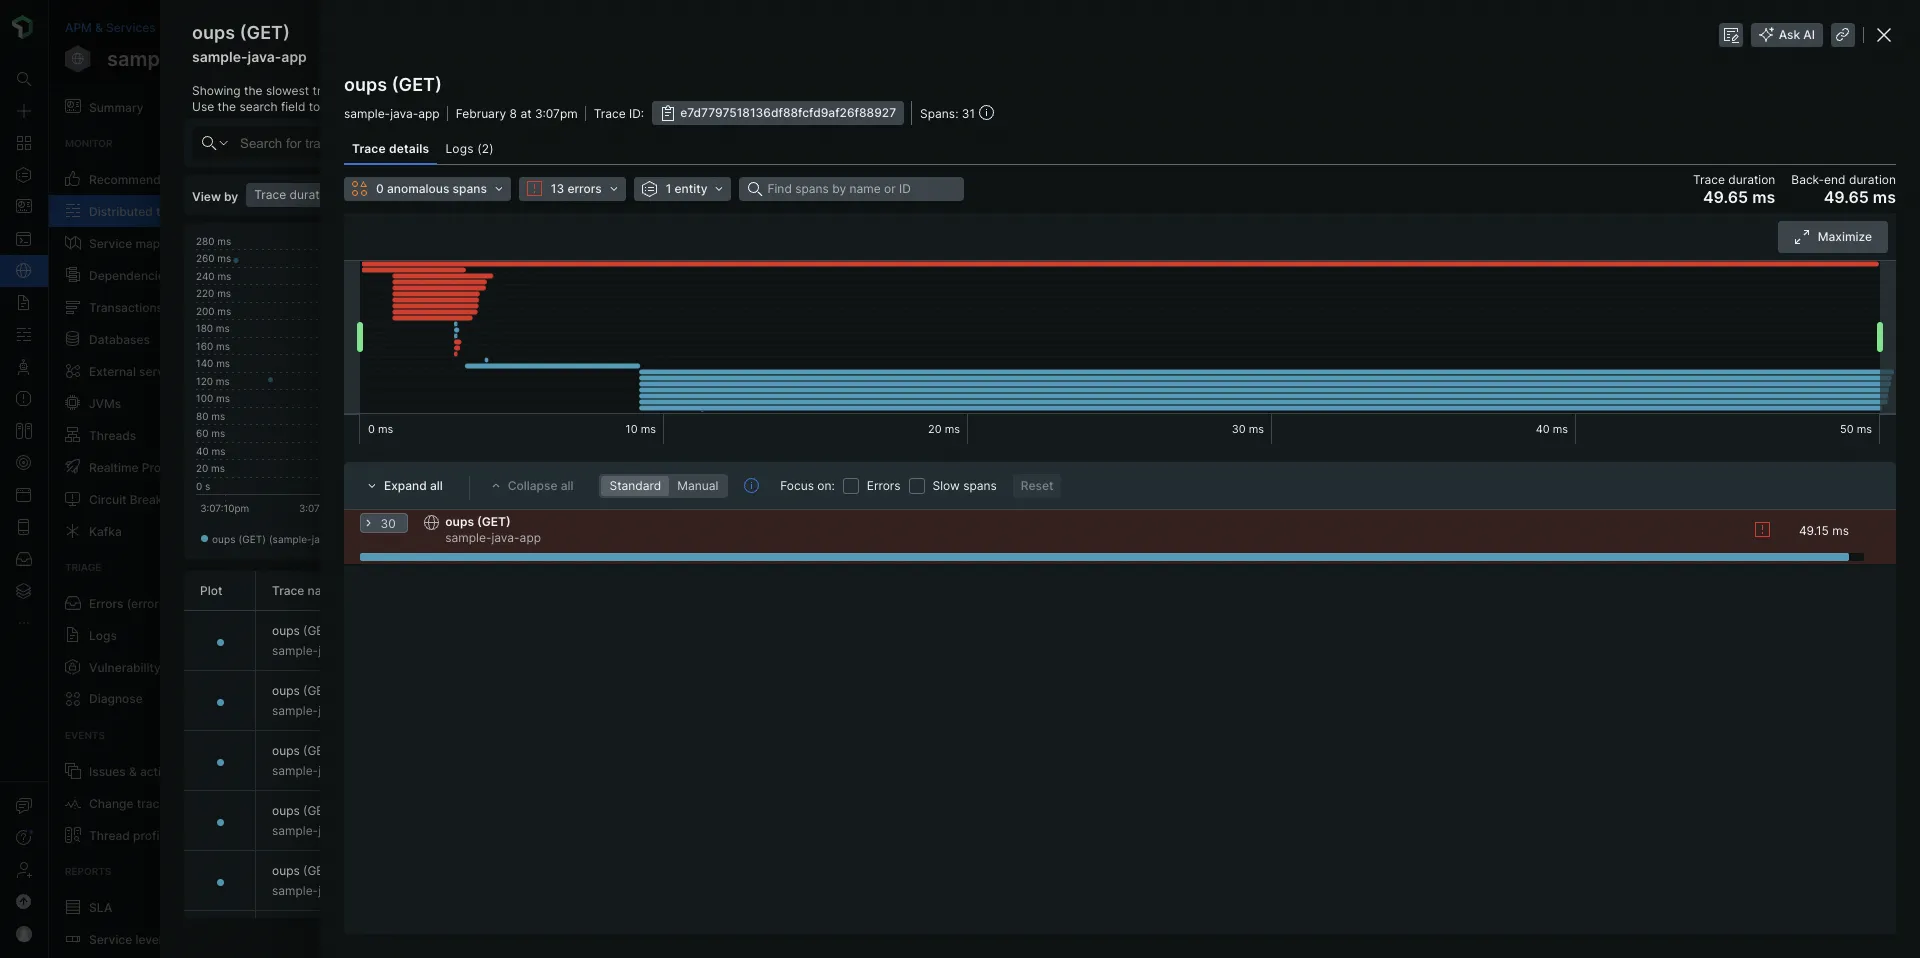
You can get flamegraphs for your traces in New Relic, too. Compared to Datadog, New Relic has fewer options for correlation. But it is interesting to note that New Relic shows much more spans for the same call in my Java application.
Overall, if you need a simpler experience, then choose New Relic’s APM. But if you need more control over what things you can do with your data, then choose Datadog’s APM.
Log Management: Datadog for more filters, New Relic for quick-start
New Relic
New Relic automatically collected logs from my Java application and showed them in their logs tab. It allows you to search your logs using Lucene, an open-source search library that allows for indexing and searching of text by breaking down text into searchable terms.
New Relic also gives you the option to query your log data using NRQL. It’s a query language developed by New Relic which has a SQL-like syntax.
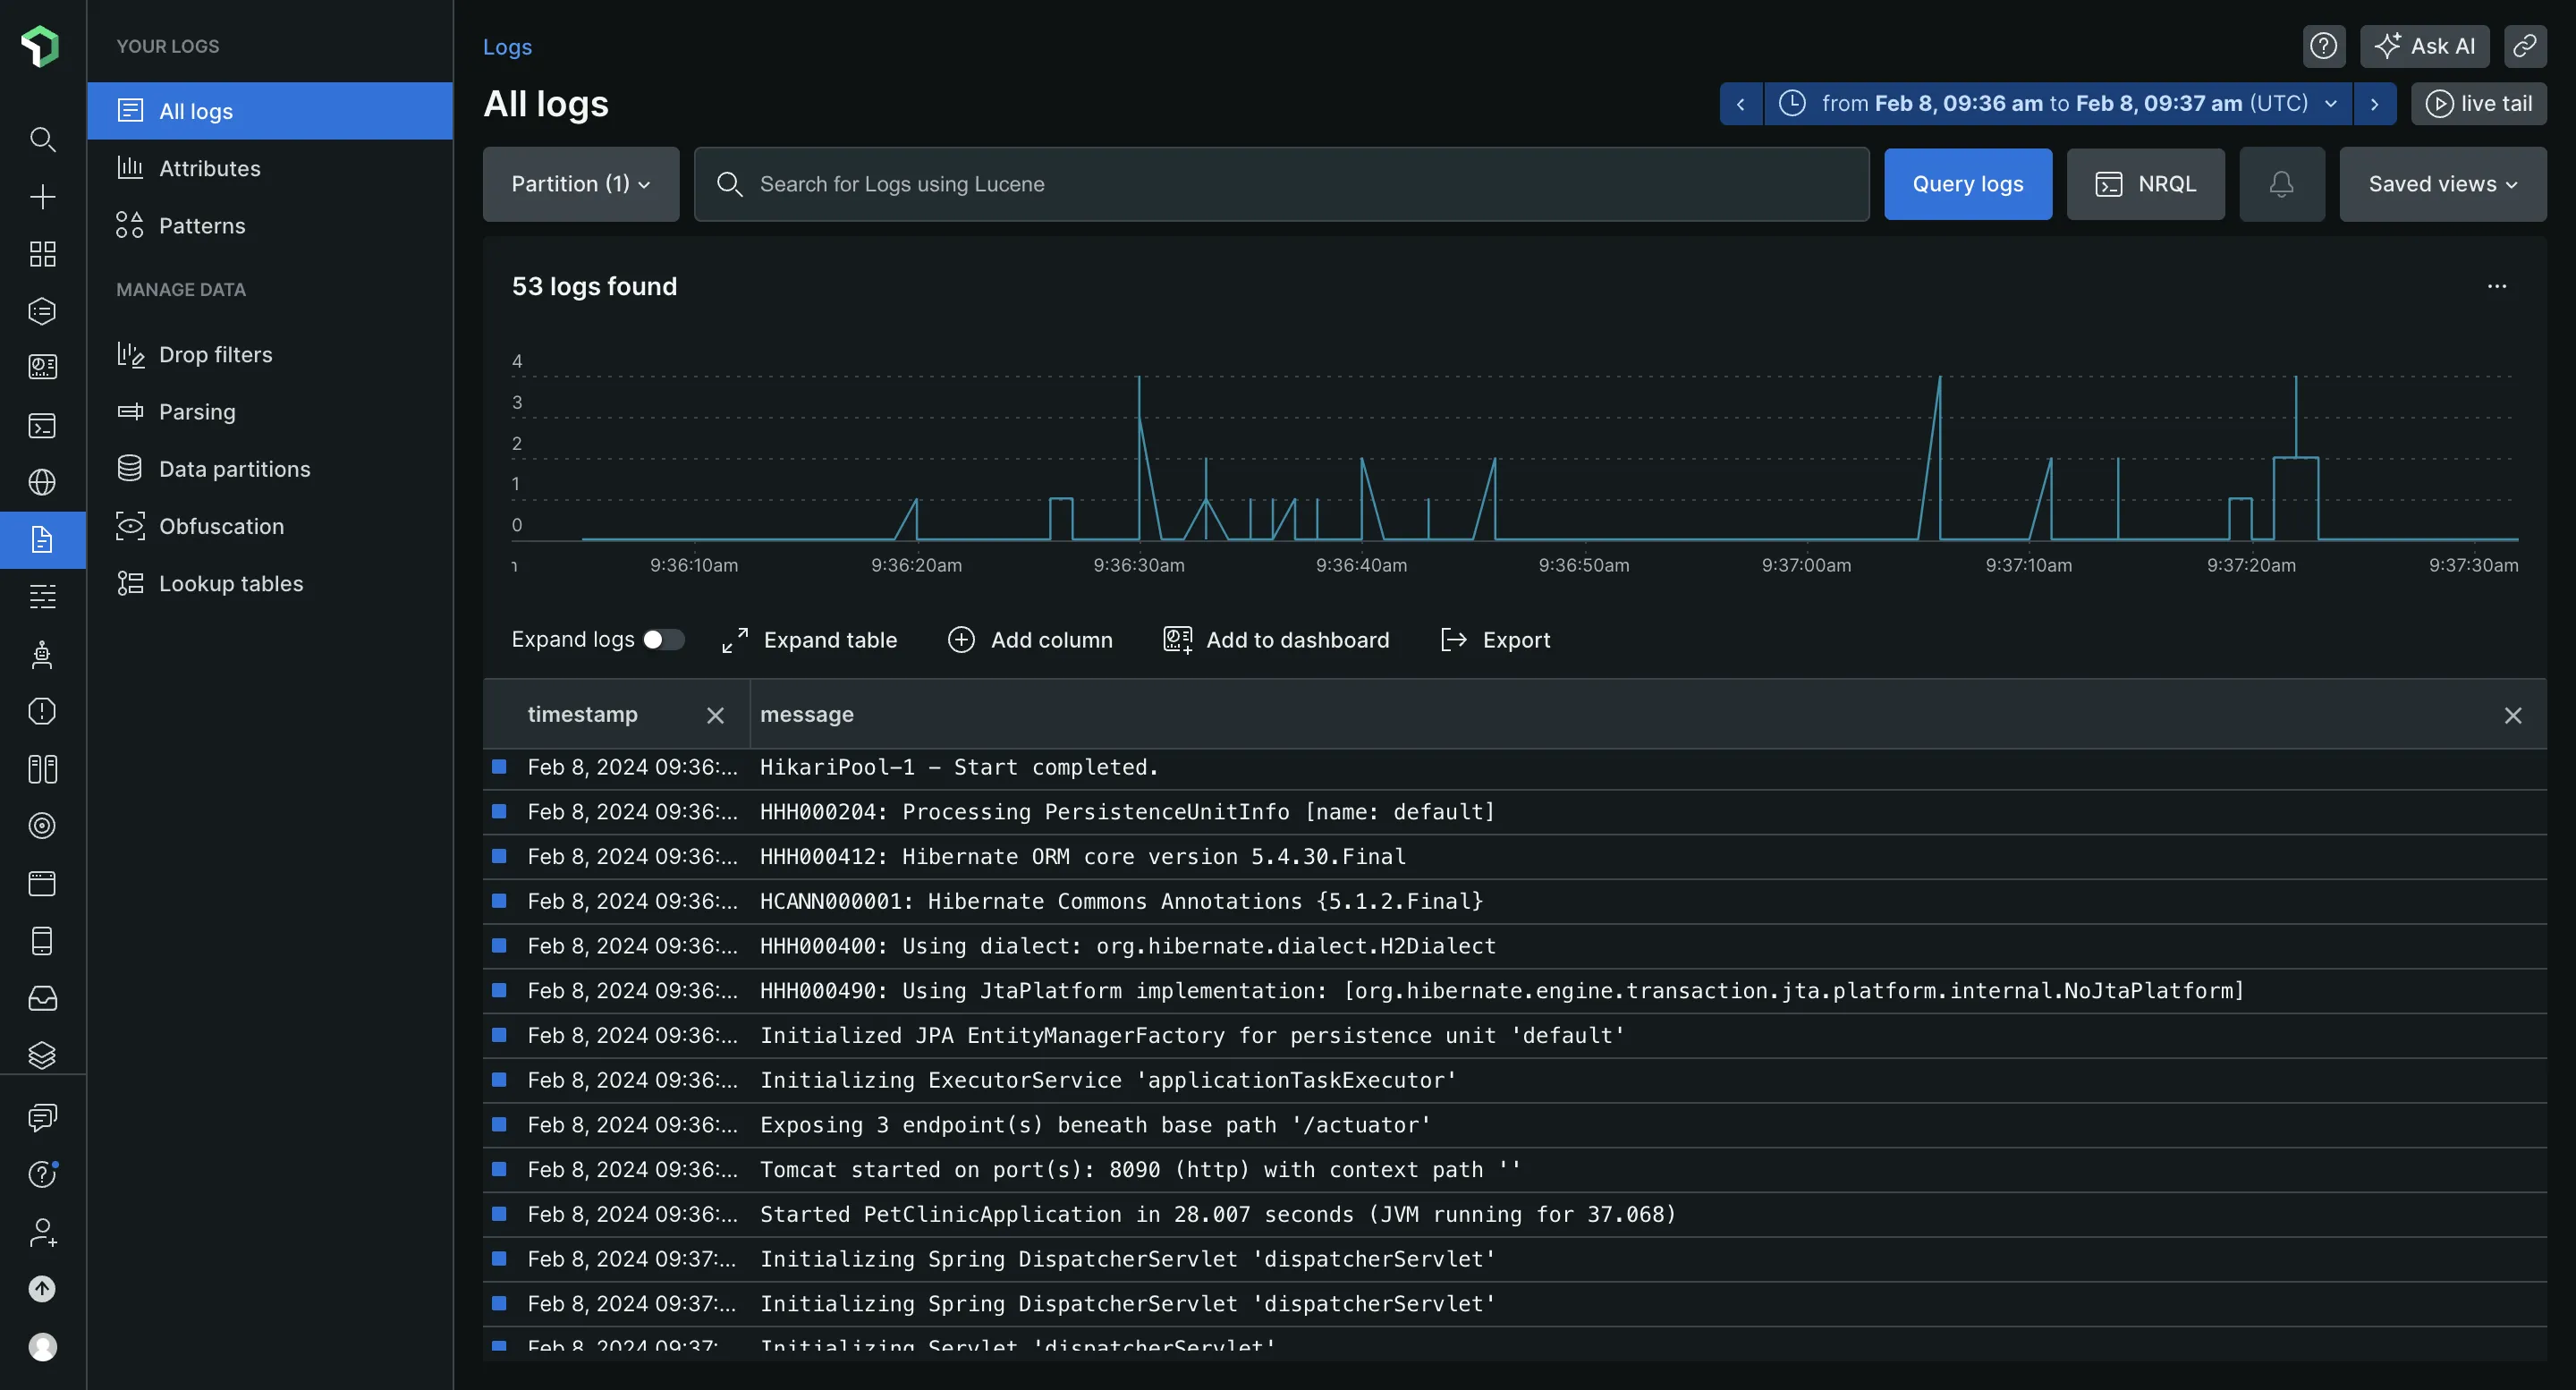
Other key features in New Relic’s log management and how they worked with my Java application logs are:
Takes out attributes automatically from logs.

Attributes filtered from Java application logs in New Relic It provides a feature called patterns, which claims to make log data discoverable without spending a lot of time. However, it couldn’t detect any pattern in my Java application logs.
Gives you tools to manage your log data by optimizing for storage by dropping filters.
Datadog
For Datadog, there was no automatic collection of logs. Collecting logs is disabled by default in the Datadog agent, and you need to enable it in the agent’s config file. You also need to activate a java integration that will collect application logs from a file.
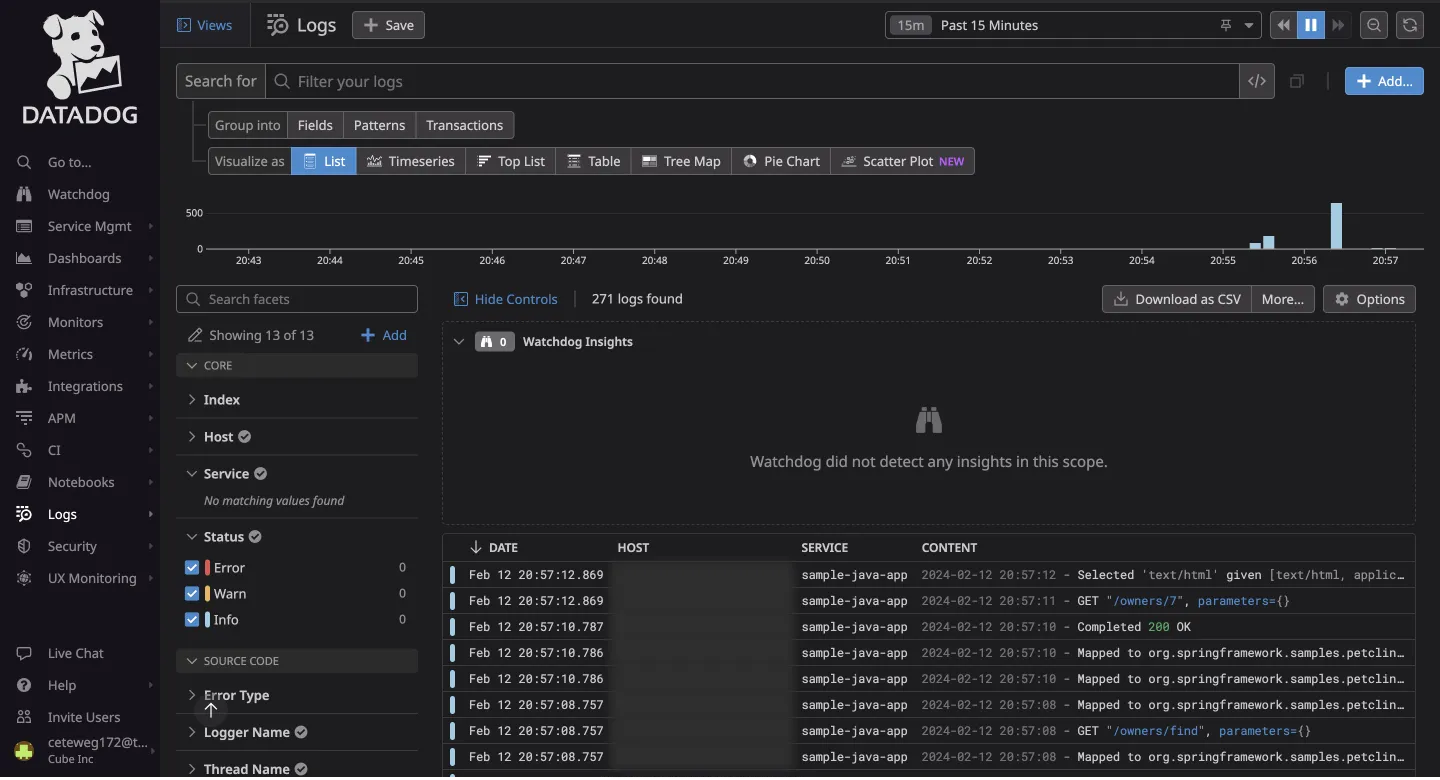
Both Datadog and New Relic have a feature to find patterns in logs automatically. While Datadog showed some patterns from my application logs, New Relic did not. Datadog offers more options to slice and dice your log data in its UI.
Both tools provide ways to optimize log data ingestion at scale. Datadog allows you to use your own cloud storage for logs, which seems to be a handy feature for storing logs for the long term.
Compared to New Relic, setting up log collection took more time in Datadog. But Datadog provides more visualization options to see your logs.
Infrastructure Monitoring: Tie, decide based on cost
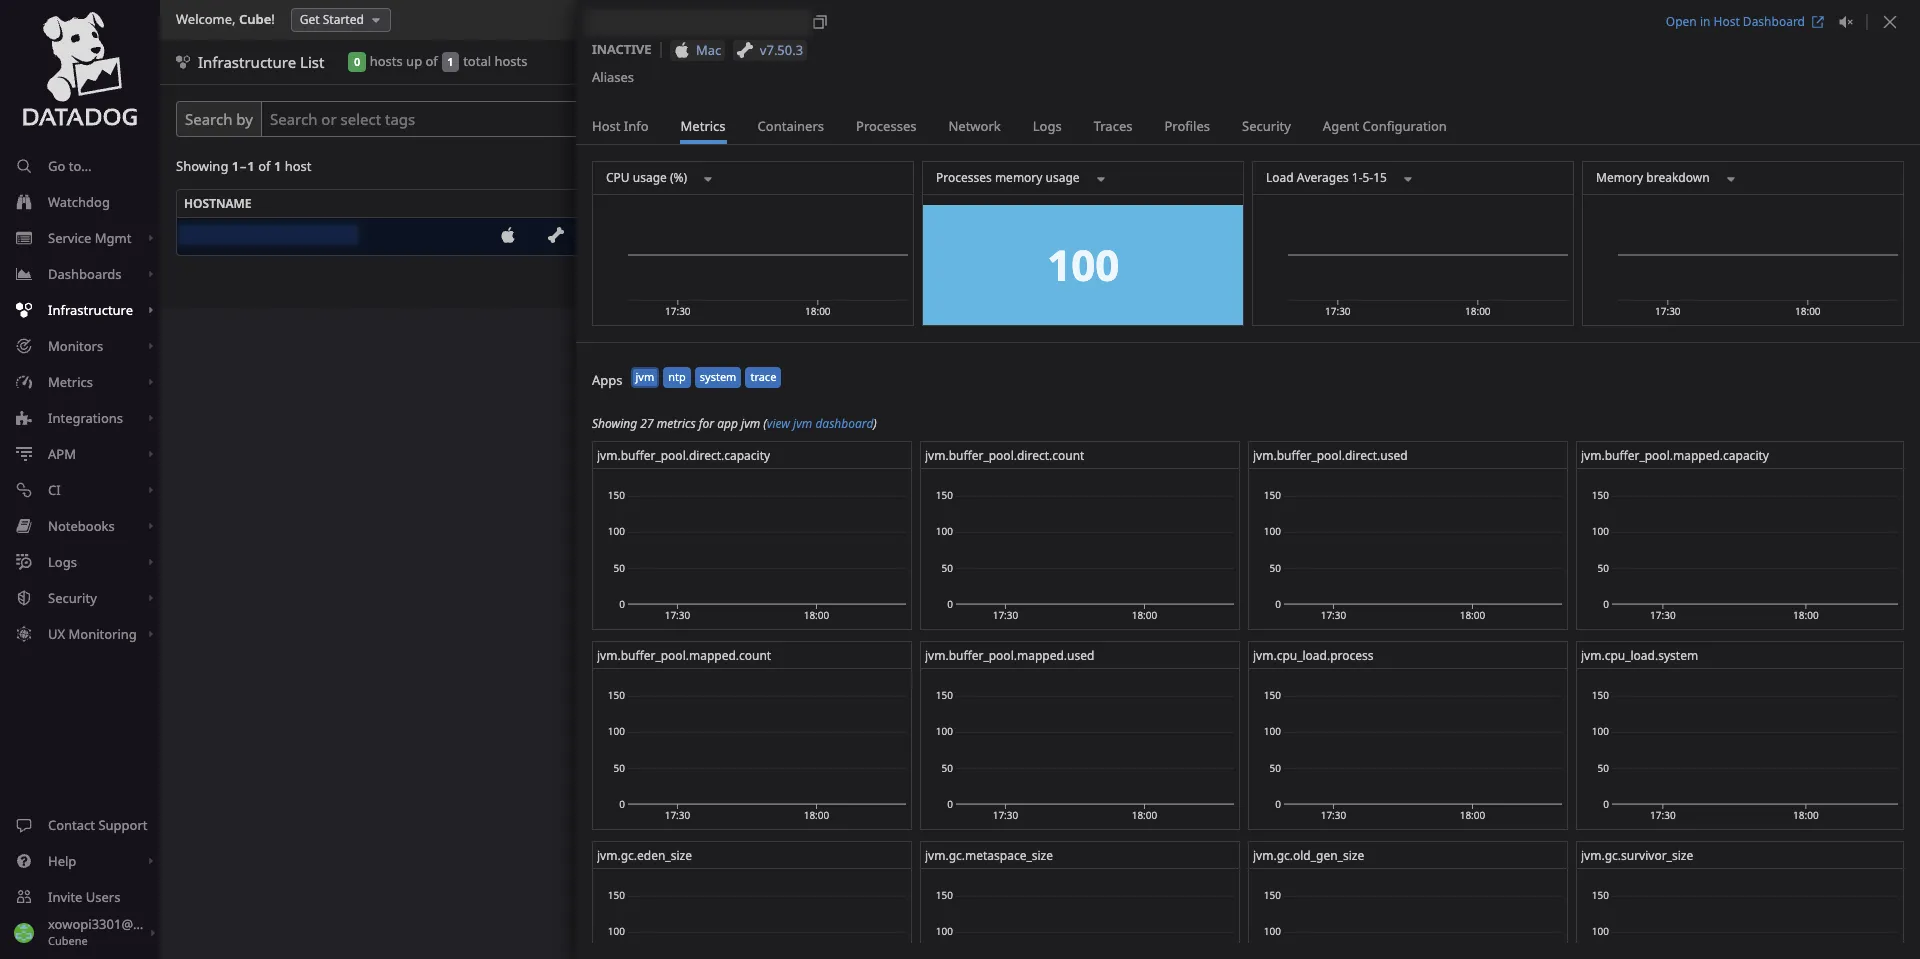
Host monitoring in both Datadog and New Relic is good, and choosing one over the other can be a matter of personal choice. I personally like the color theme of New Relic and the representation of things like Disk usage in a table.
What’s interesting about Datadog is that it showed me a glimpse of the JVM metrics dashboard while clicking on my host. Datadog has done a really good job at correlating different types of information collected from your application and host.
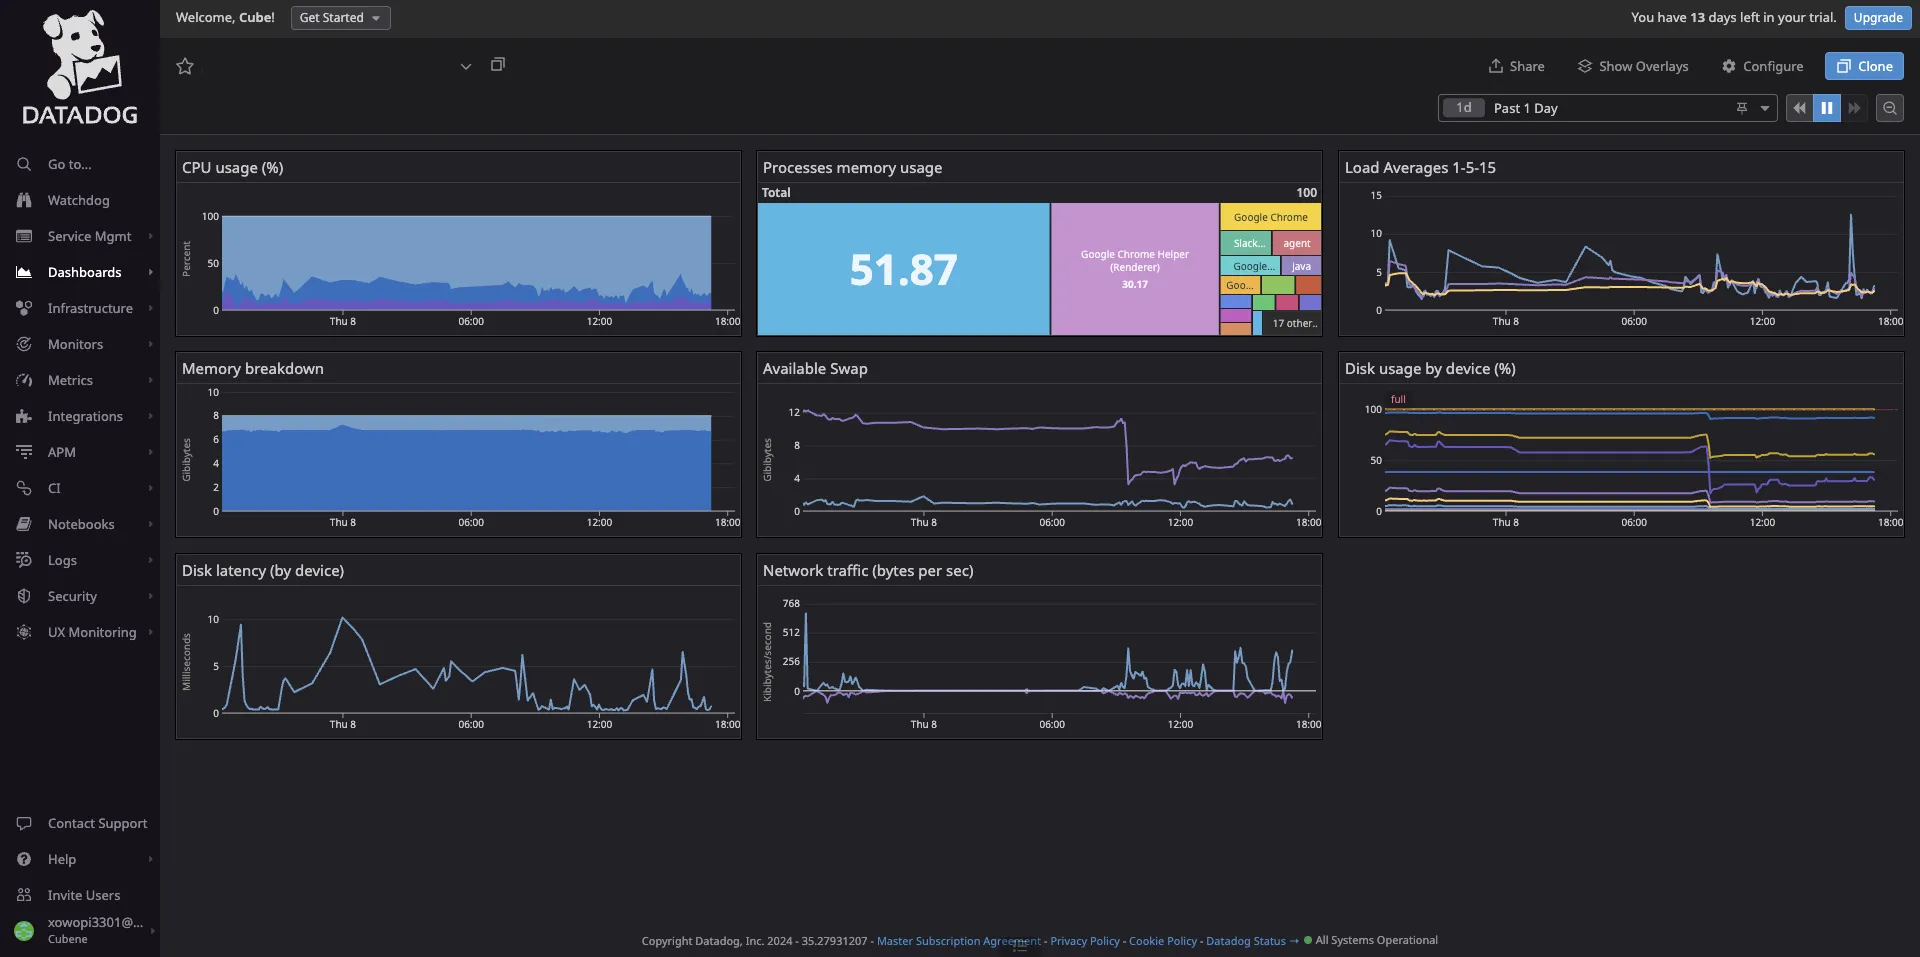
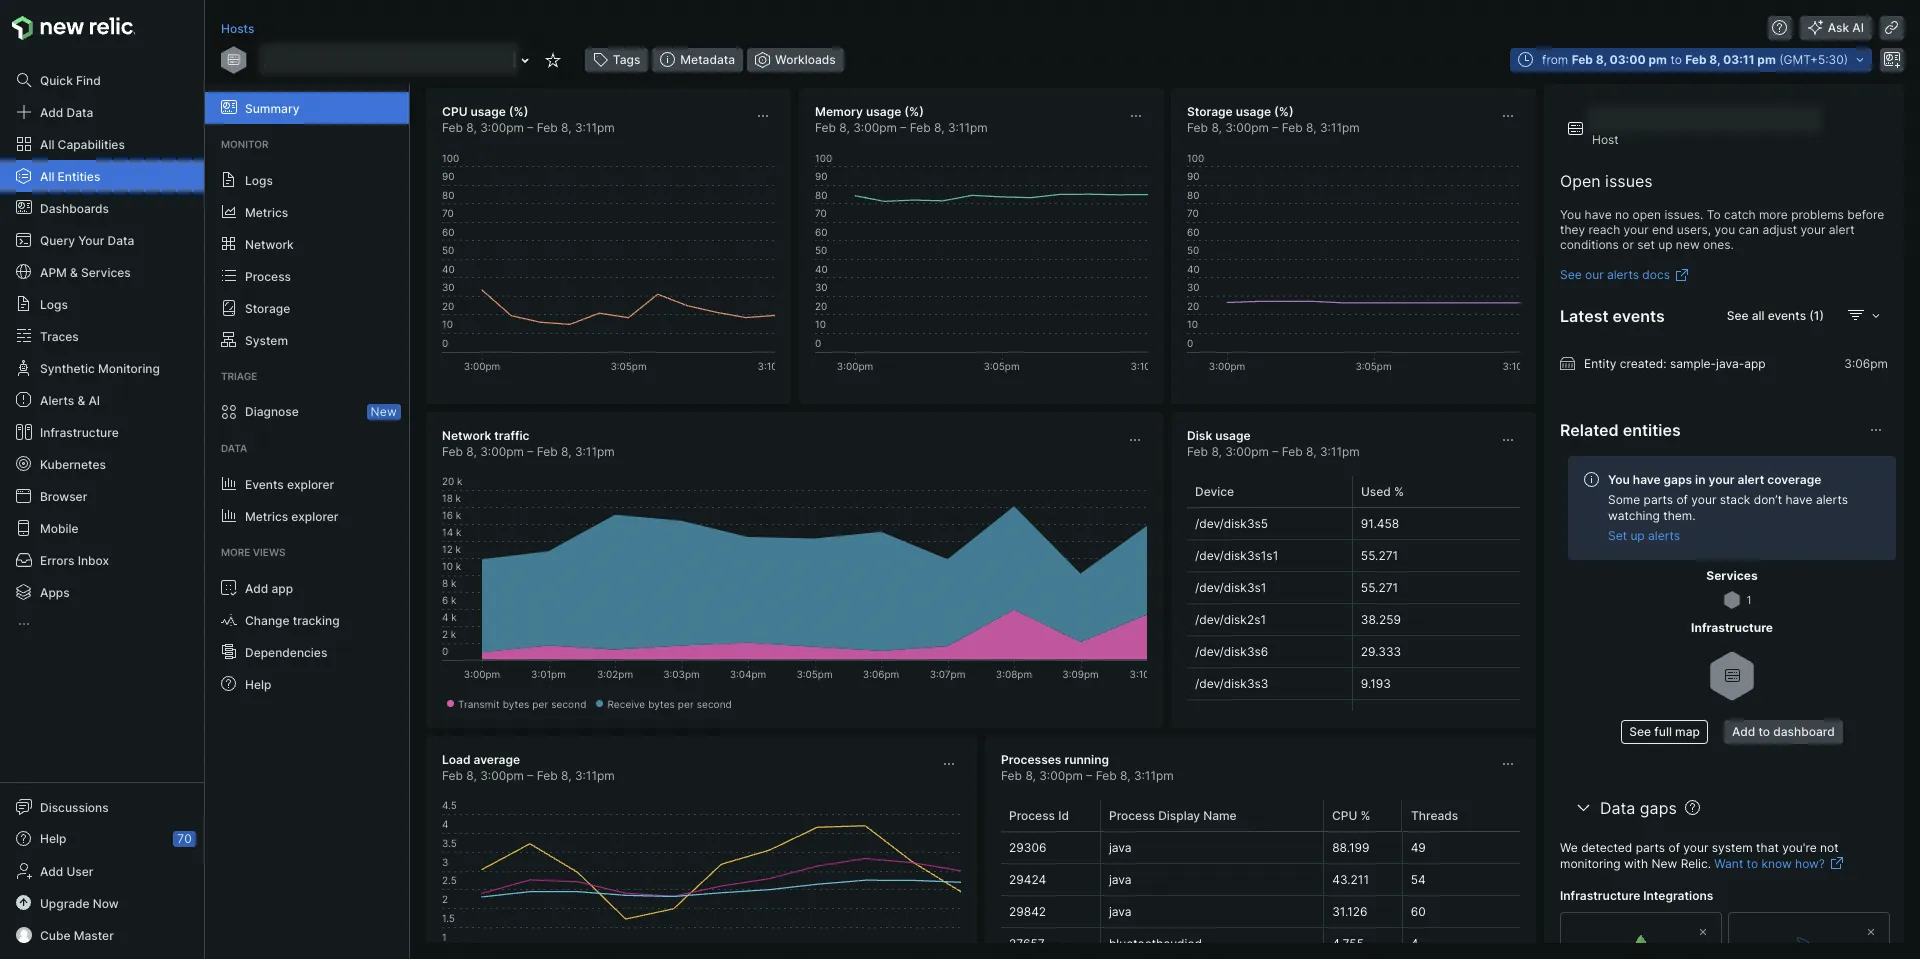
If your use case is only infrastructure monitoring, then the decision comes down to cost. However, it’s not easy to figure out how much each tool will cost on a head-to-head basis as their pricing structures are very different. I recommend you sign up and do a trial for both tools, including factors like user seats(New Relic charges for user seats).
Pricing: Beware of these things
Both Datadog and New Relic are expensive tools. The following points might help you decide which tool is better suited for your needs:
New Relic
- Pricing is based on two things:
- Amount of data ingested
- User Seats
- You get 100GB of free data ingest each month.
- Post 100GB, you need to pay $0.3/GB or $0.5/GB ingested based on your plan.
- User seats can get expensive. New Relic allows only 5 full platform users in its standard plan, and the cost of full platform users can be up to $549/user per month for enterprise plans.
Datadog
- Datadog is known for being very expensive - here’s a scoop on Datadog’s 65 million dollar bill.
- Complex SKU-based pricing. Each product(like APM, logs, infra) is priced differently, and it’s very hard to predict your actual usage.
- Datadog defines its standard set of metrics; anything outside that definition falls under the category of custom metrics. If you’re not careful, the cost of custom metrics can be a significant component of your billing.
OpenTelemetry Support: Not Great in Both Datadog & New Relic
OpenTelemetry is quietly emerging as the open-source standard for collecting all types of telemetry signals. There are numerous benefits to using OpenTelemetry for collecting telemetry data from your applications and host.
Both Datadog’s and New Relic’s support for OpenTelemetry is not up to the mark, which seems reasonable as their entire product is anchored around their specific agents.
For example, Datadog cannot link traces and logs automatically with the DataDog OpenTelemetry tools. New Relic’s documentation is better for using OpenTelemetry, but once the data gets reported, you can see the difference again.
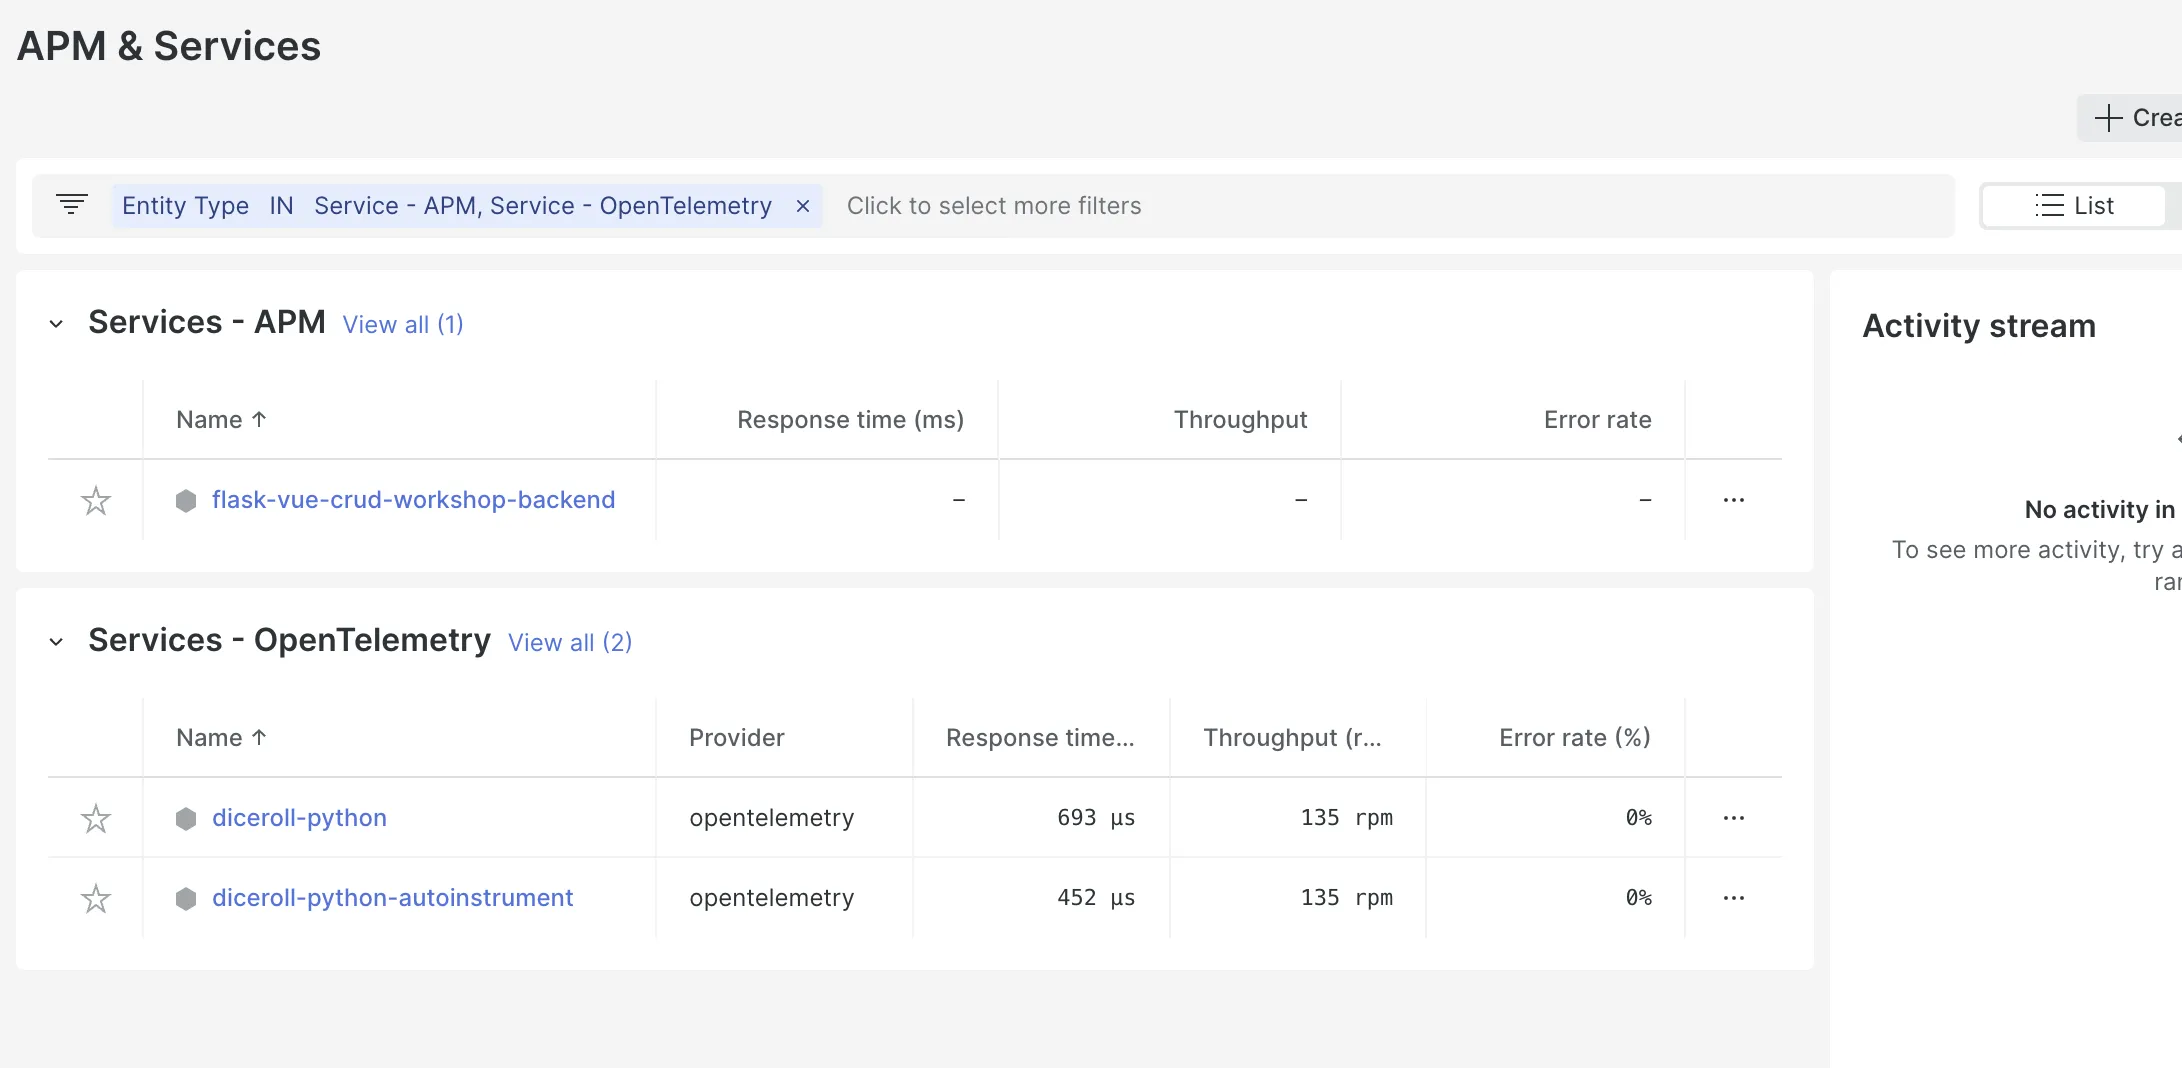
If you are looking to use OpenTelemetry, then I would recommend SigNoz (of course) - an OpenTelemetry-native APM. And just like OpenTelemetry, SigNoz is also open-source. So you can have a full-stack open-source observability stack with SigNoz and OpenTelemetry.
Datadog vs New Relic: Final Verdict
You should choose Datadog over New Relic if you are an observability expert and want more granular control over your data. That said, New Relic is not far behind in terms of features offered and can be a good solution for application observability.
Here’s a use-case-based guide for Datadog vs New Relic:
If you want a better correlation between your signals, then choose Datadog.
If you want to use the entire platform without worrying too much about billing, then choose New Relic, as the pricing is based on usage.
If you want more granular controls over your data, choose Datadog.
If your use case is Cloud SIEM, then choose Datadog.
If your use case is real-user monitoring, then choose New Relic.
Datadog and New Relic are great products for application monitoring and observability, but they are mostly suited for bigger enterprises. And if you’re looking to use OpenTelemetry, then neither product is that well-suited. SigNoz is an OpenTelemetry-native APM that can be used as an alternative to Datadog and New Relic.
Advantages of using SigNoz over Datadog and New Relic
Datadog and New Relic have been leaders in the application monitoring domain for many years. But they are not suited for everyone. SigNoz can be a great choice as an alternative to Datadog or New Relic. Some of the advantages of using SigNoz over Datadog and New Relic are:
Open-Source
SigNoz is open-source, just like OpenTelemetry. Being open-source, SigNoz is more suited to use cases where privacy is a concern, as it can be self-hosted. It can also be used in a hybrid way - using open-source for the dev and staging environment and cloud for the production environment.OpenTelemetry-native
OpenTelemetry is one of the leading open-source projects backed by CNCF and second only to Kubernetes when it comes to popularity. It is also safer to have an open-source standard deeply integrated with your application and infrastructure rather than a vendor-specific agent. OpenTelemetry frees you from vendor lock-in.SigNoz is built to support OpenTelemetry from day 1. Our APM experience is based fully on OpenTelemetry data, and we provide features that utilize OpenTelemetry data well.
No user-based & host-based pricing
You can add as many team members as you like when using the SigNoz cloud service. There is no charge for user seats in SigNoz. There is also no host-based pricing. You only pay for the amount of data you send.No special pricing for custom metrics
Custom metrics are important for getting application-specific insights. You understand your business best, so only you will be able to decide what things need to be monitored. Sending custom metrics in Datadog can get really expensive, and there are many horror stories about unpredictable billing in Datadog.
Getting Started with SigNoz
SigNoz cloud is the easiest way to run SigNoz. Sign up for a free account and get 30 days of unlimited access to all features.
You can also install and self-host SigNoz yourself since it is open-source. With 16,000+ GitHub stars, open-source SigNoz is loved by developers. Find the instructions to self-host SigNoz.
Frequently Asked Questions
Q: Is New Relic better than Datadog?
In some aspects, New Relic is better than Datadog. But overall, Datadog provides more granular control over your data that can provide better insights about your application performance.
Q: What is the difference between Datadog and New Relic?
Datadog and New Relic offer majorly similar features. The main difference between Datadog and New Relic is the lack of Cloud SIEM in New Relic. On the other hand, New Relic provides better features for real user monitoring.
Q: Datadog vs New Relic Cost
Datadog is a more expensive product. It has complex SKU-based pricing, which makes it difficult for engineering teams to use the platform freely. While New Relic provides free access to its entire platform and charges based on usage. But New Relic has user-based pricing - and that can be a significant portion of your entire bill at scale.
Related Content
9x more value for money than Datadog and New Relic
SigNoz vs Datadog
SigNoz vs New Relic


