Comparing The Top 9 Datadog Alternatives in 2024
Are you looking for a DataDog alternative? Then you have come to the right place. In this article, we will go through top 9 DataDog alternatives. One of the biggest challenge users face with DataDog is its pricing policies. Its complex SKU-based pricing policy leads to unpredicatble bills.

DataDog is a cloud monitoring software that provides an array of tools for monitoring different aspects of your application and infrastructure. For bigger enterprises it might make sense to shell out huge monitoring bills, but it's often out of question for small and medium size enterprises.
In one of the earning calls of Datadog, it was revealed that they charged a cryptocurrency company a bill of $65 million USD. A Hacker News thread discussing the report went viral, and there was an outpour of user stories around Datadog’s unpredictable billing practices.
A lot of users also pointed out how the sales team of Datadog relentlessly pursue engineers for signing up for their services.

We have come across many other horror stories around Datadog billing while interacting with our users.
Datadog's billing has two key issues:
- Very complex SKU-based pricing, which makes it impossible to predict how much it would cost.
- Custom metrics billing ($0.05 per custom metric) - we found that custom metrics can account for up to 52% of the total billing, which just does not make sense.
The monitoring space is highly competitive, but there are a few products that stand out. In this article we will go through the best DatDog alternatives which you can explore while selecting your vendor for application monitoring.
List of top DataDog alternatives in 2024:
SigNoz (Open-Source)
The first tool we want to discuss is, of course, SigNoz.
SigNoz is a great Datadog alternative. It is a full-stack open-source APM tool. Logs, metrics, and traces are three important signals needed to set up a robust observability stack. SigNoz provides all three signals under a single pane of glass.
One of the real challenges of using open source tools to set up an observability stack is to stitch together multiple tools like Jaeger for tracing and Prometheus for metrics. SigNoz is an open source APM that provides a SaaS-like experience.
SigNoz is built to support OpenTelemetry natively. OpenTelemetry is quietly becoming the world standard for instrumenting cloud-native applications.
Let us see some of the features of SigNoz.
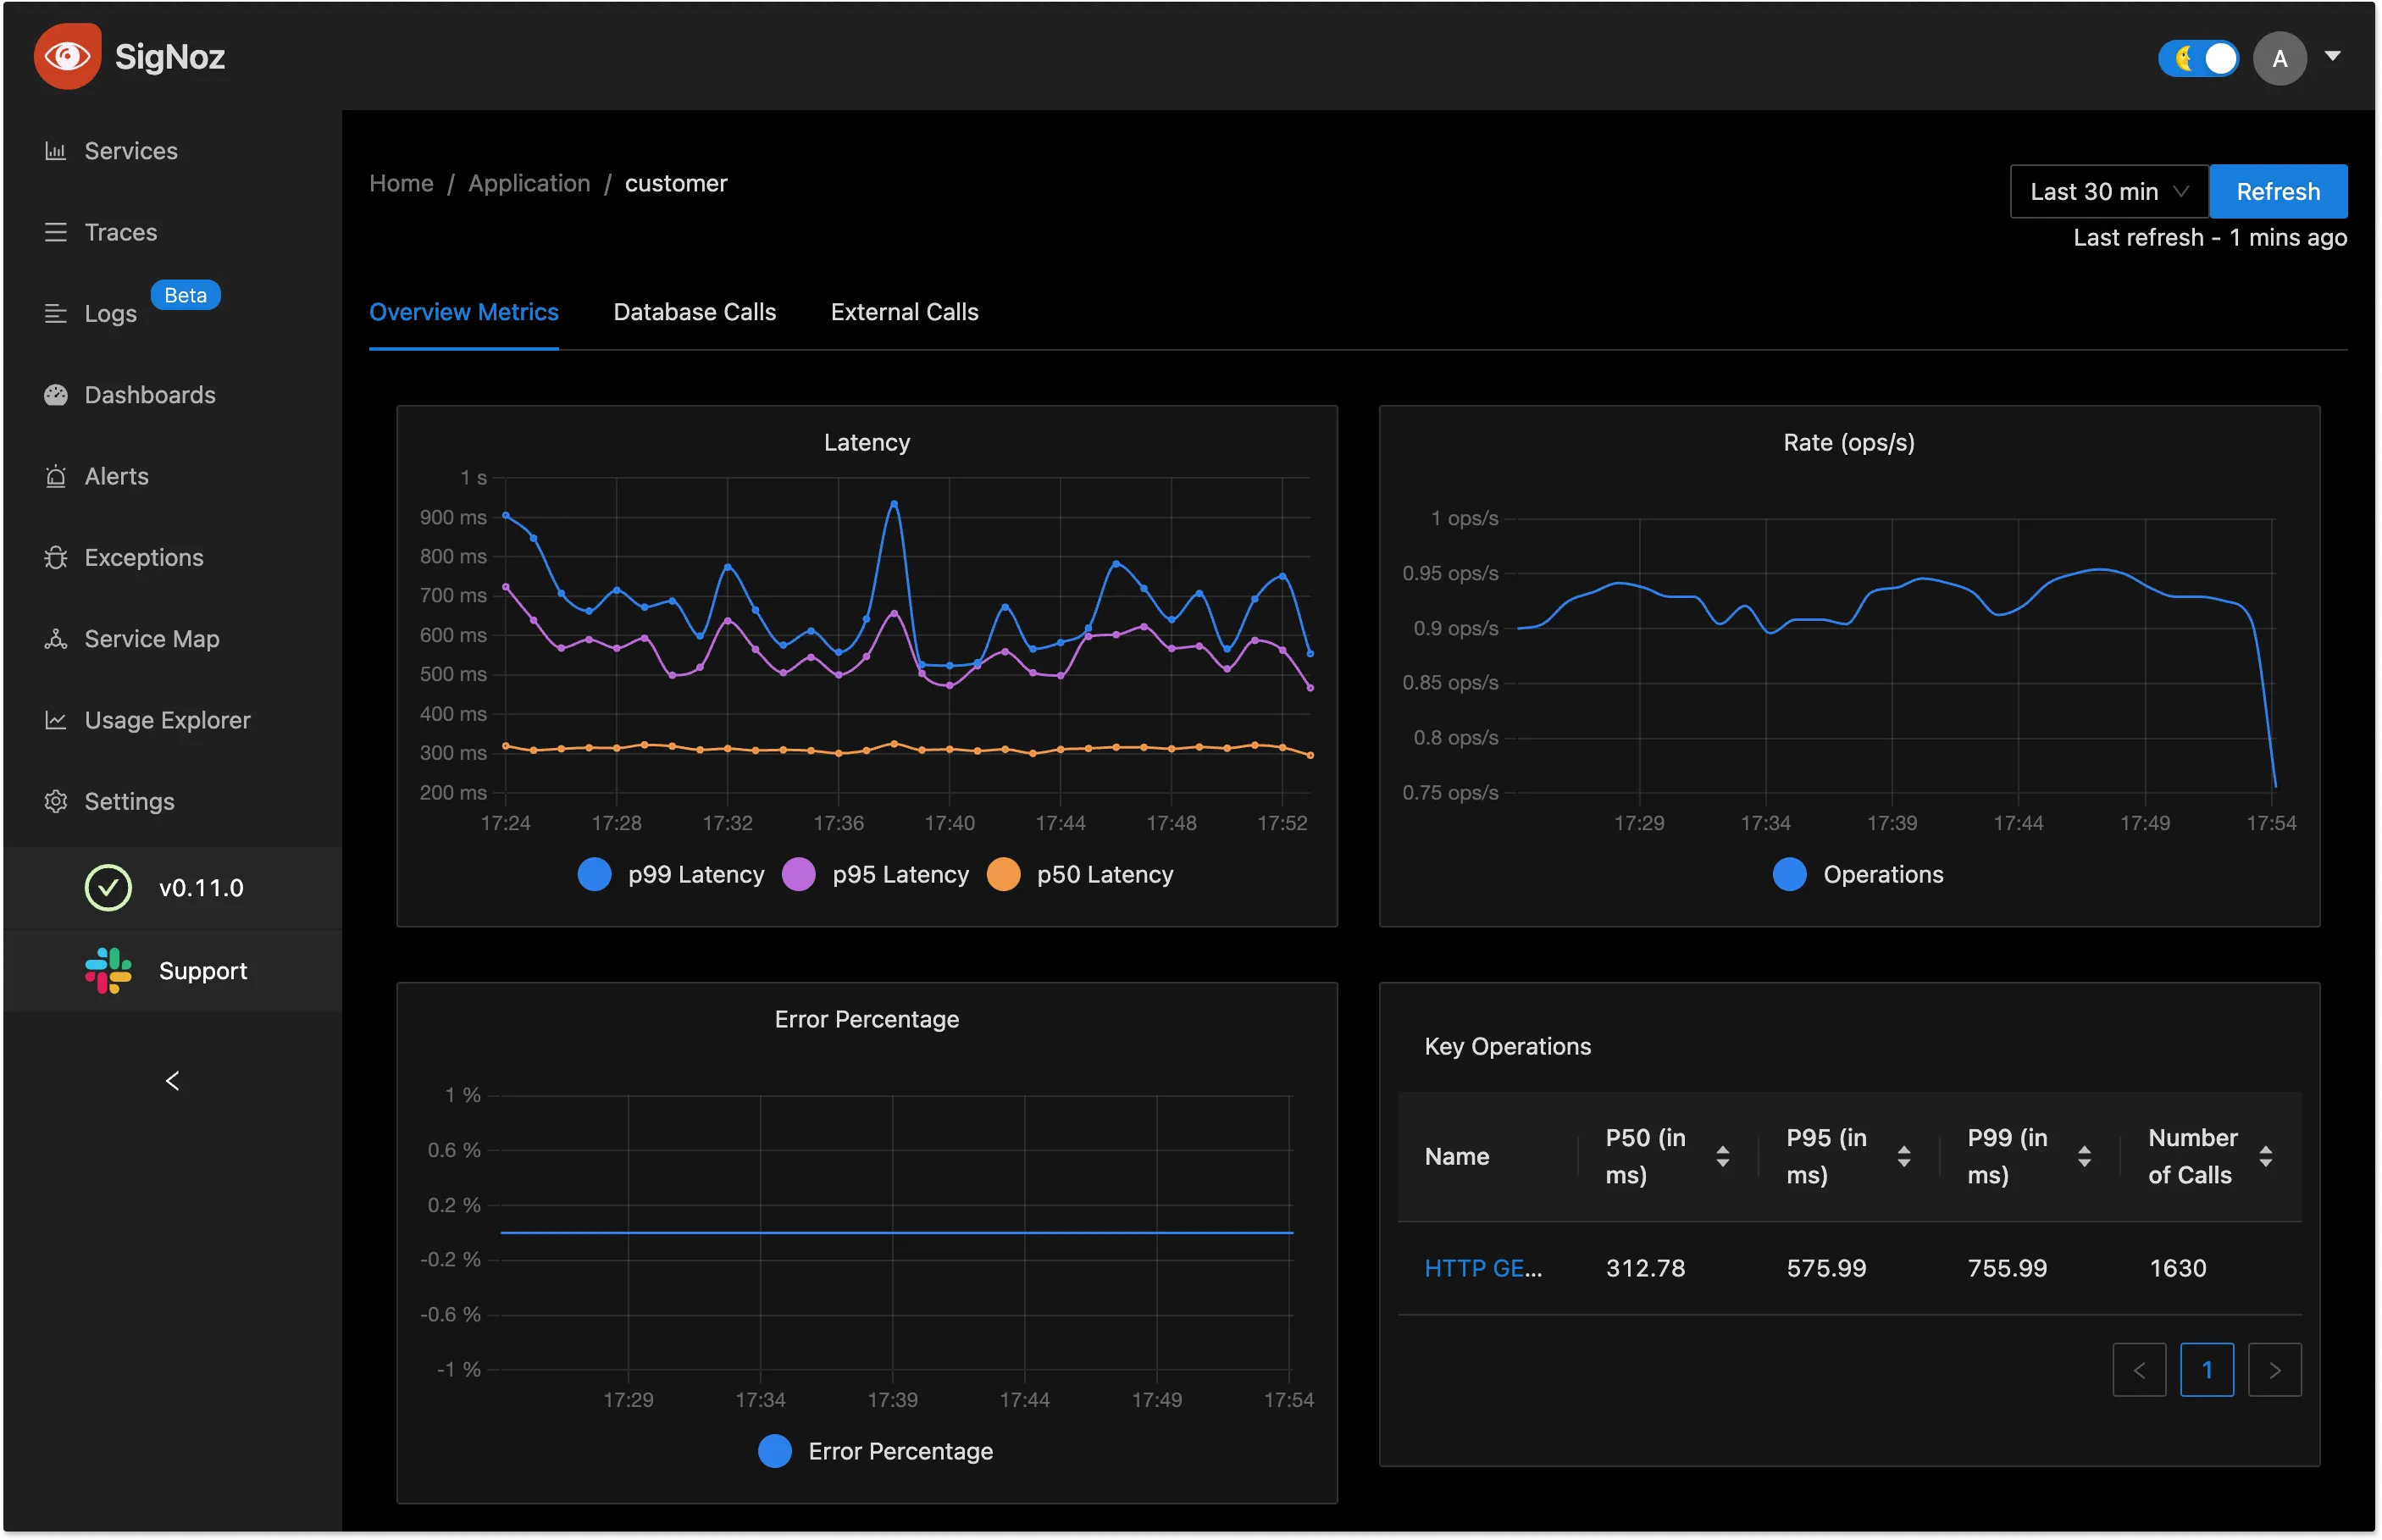
It comes with out-of-box charts for application metrics like p99 latency, error rates, request per second, and top endpoints.
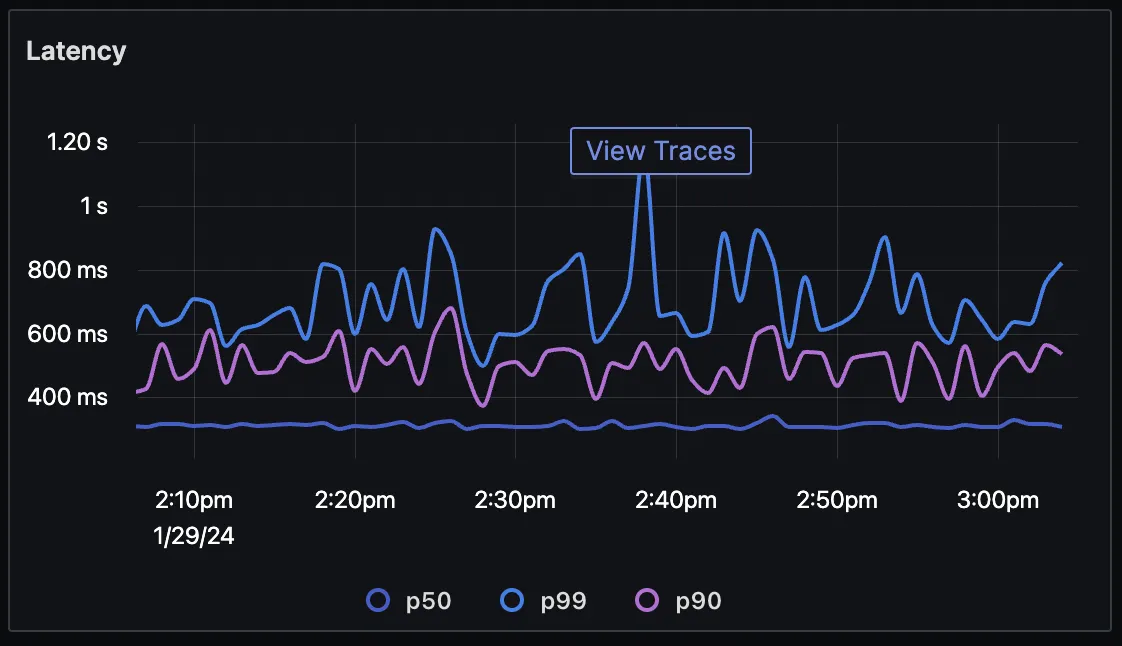
If you found something suspicious in the metric, you can seamlessly move to traces around that time to investigate further.
You can do aggregates on traces to get deeper insights from your application and infrastructure.

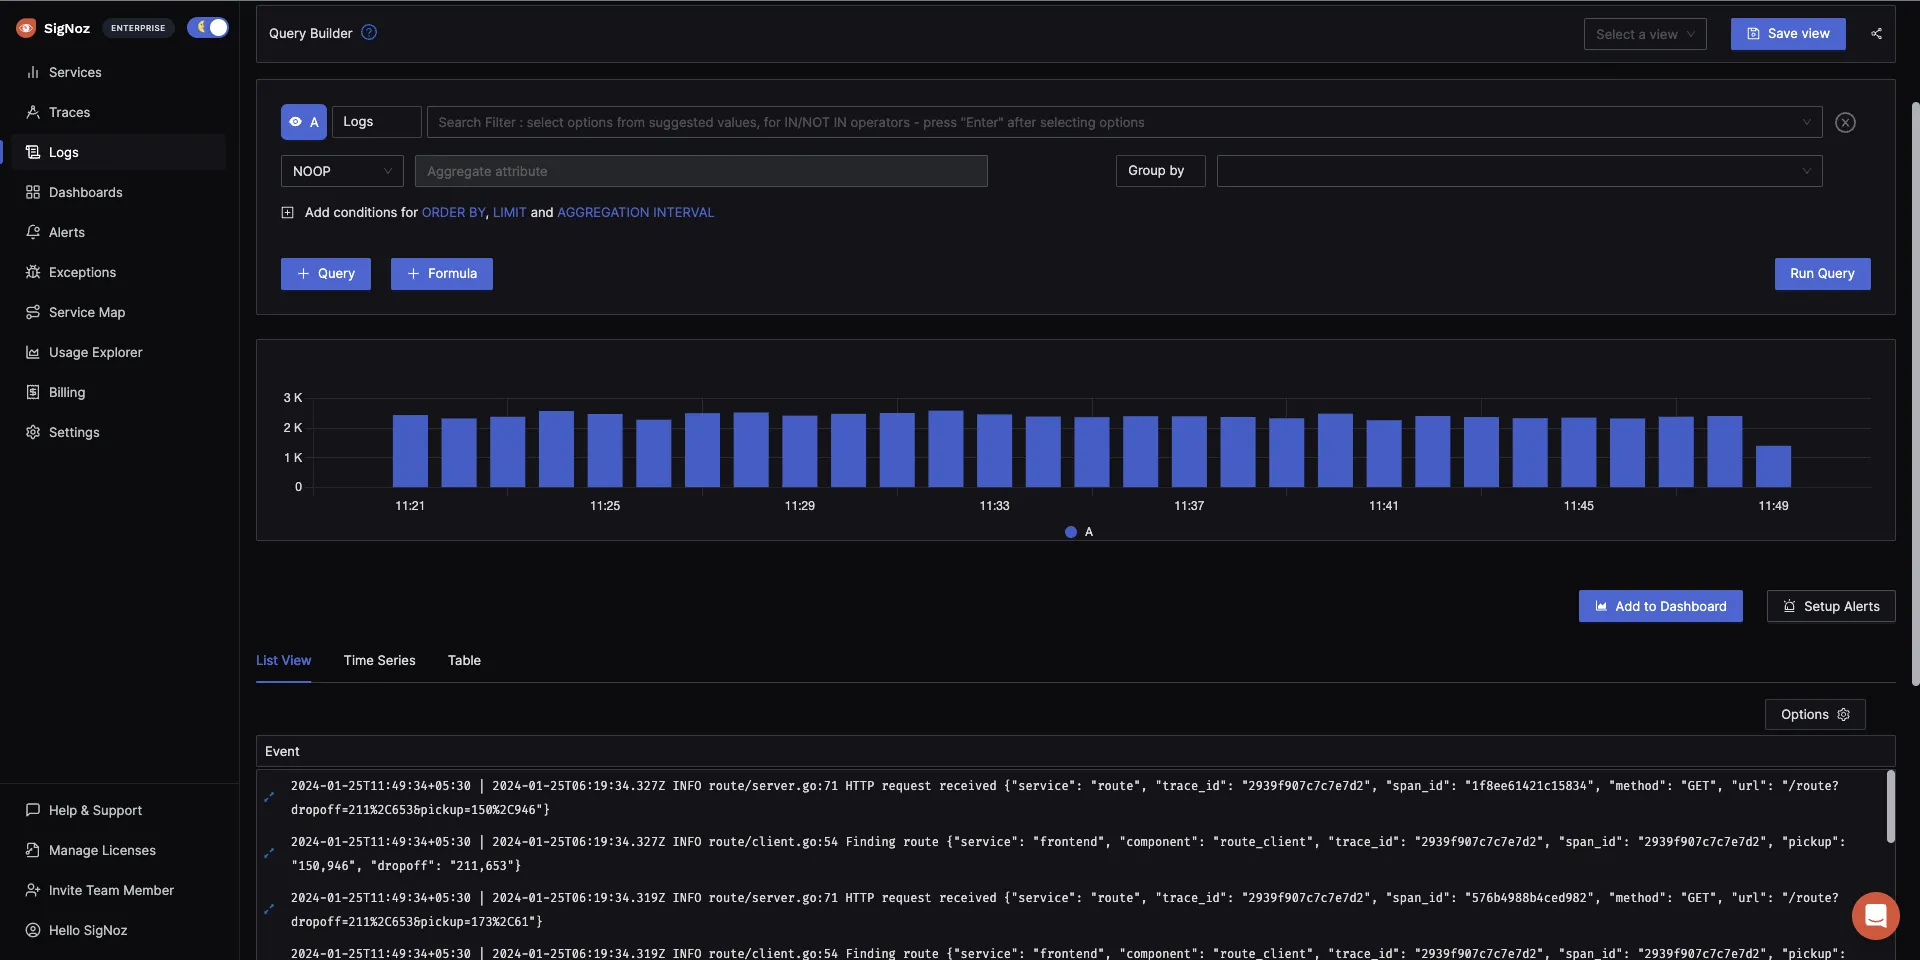
SigNoz also provides logs which can be intelligently correlated with traces for quick application debugging.
New Relic
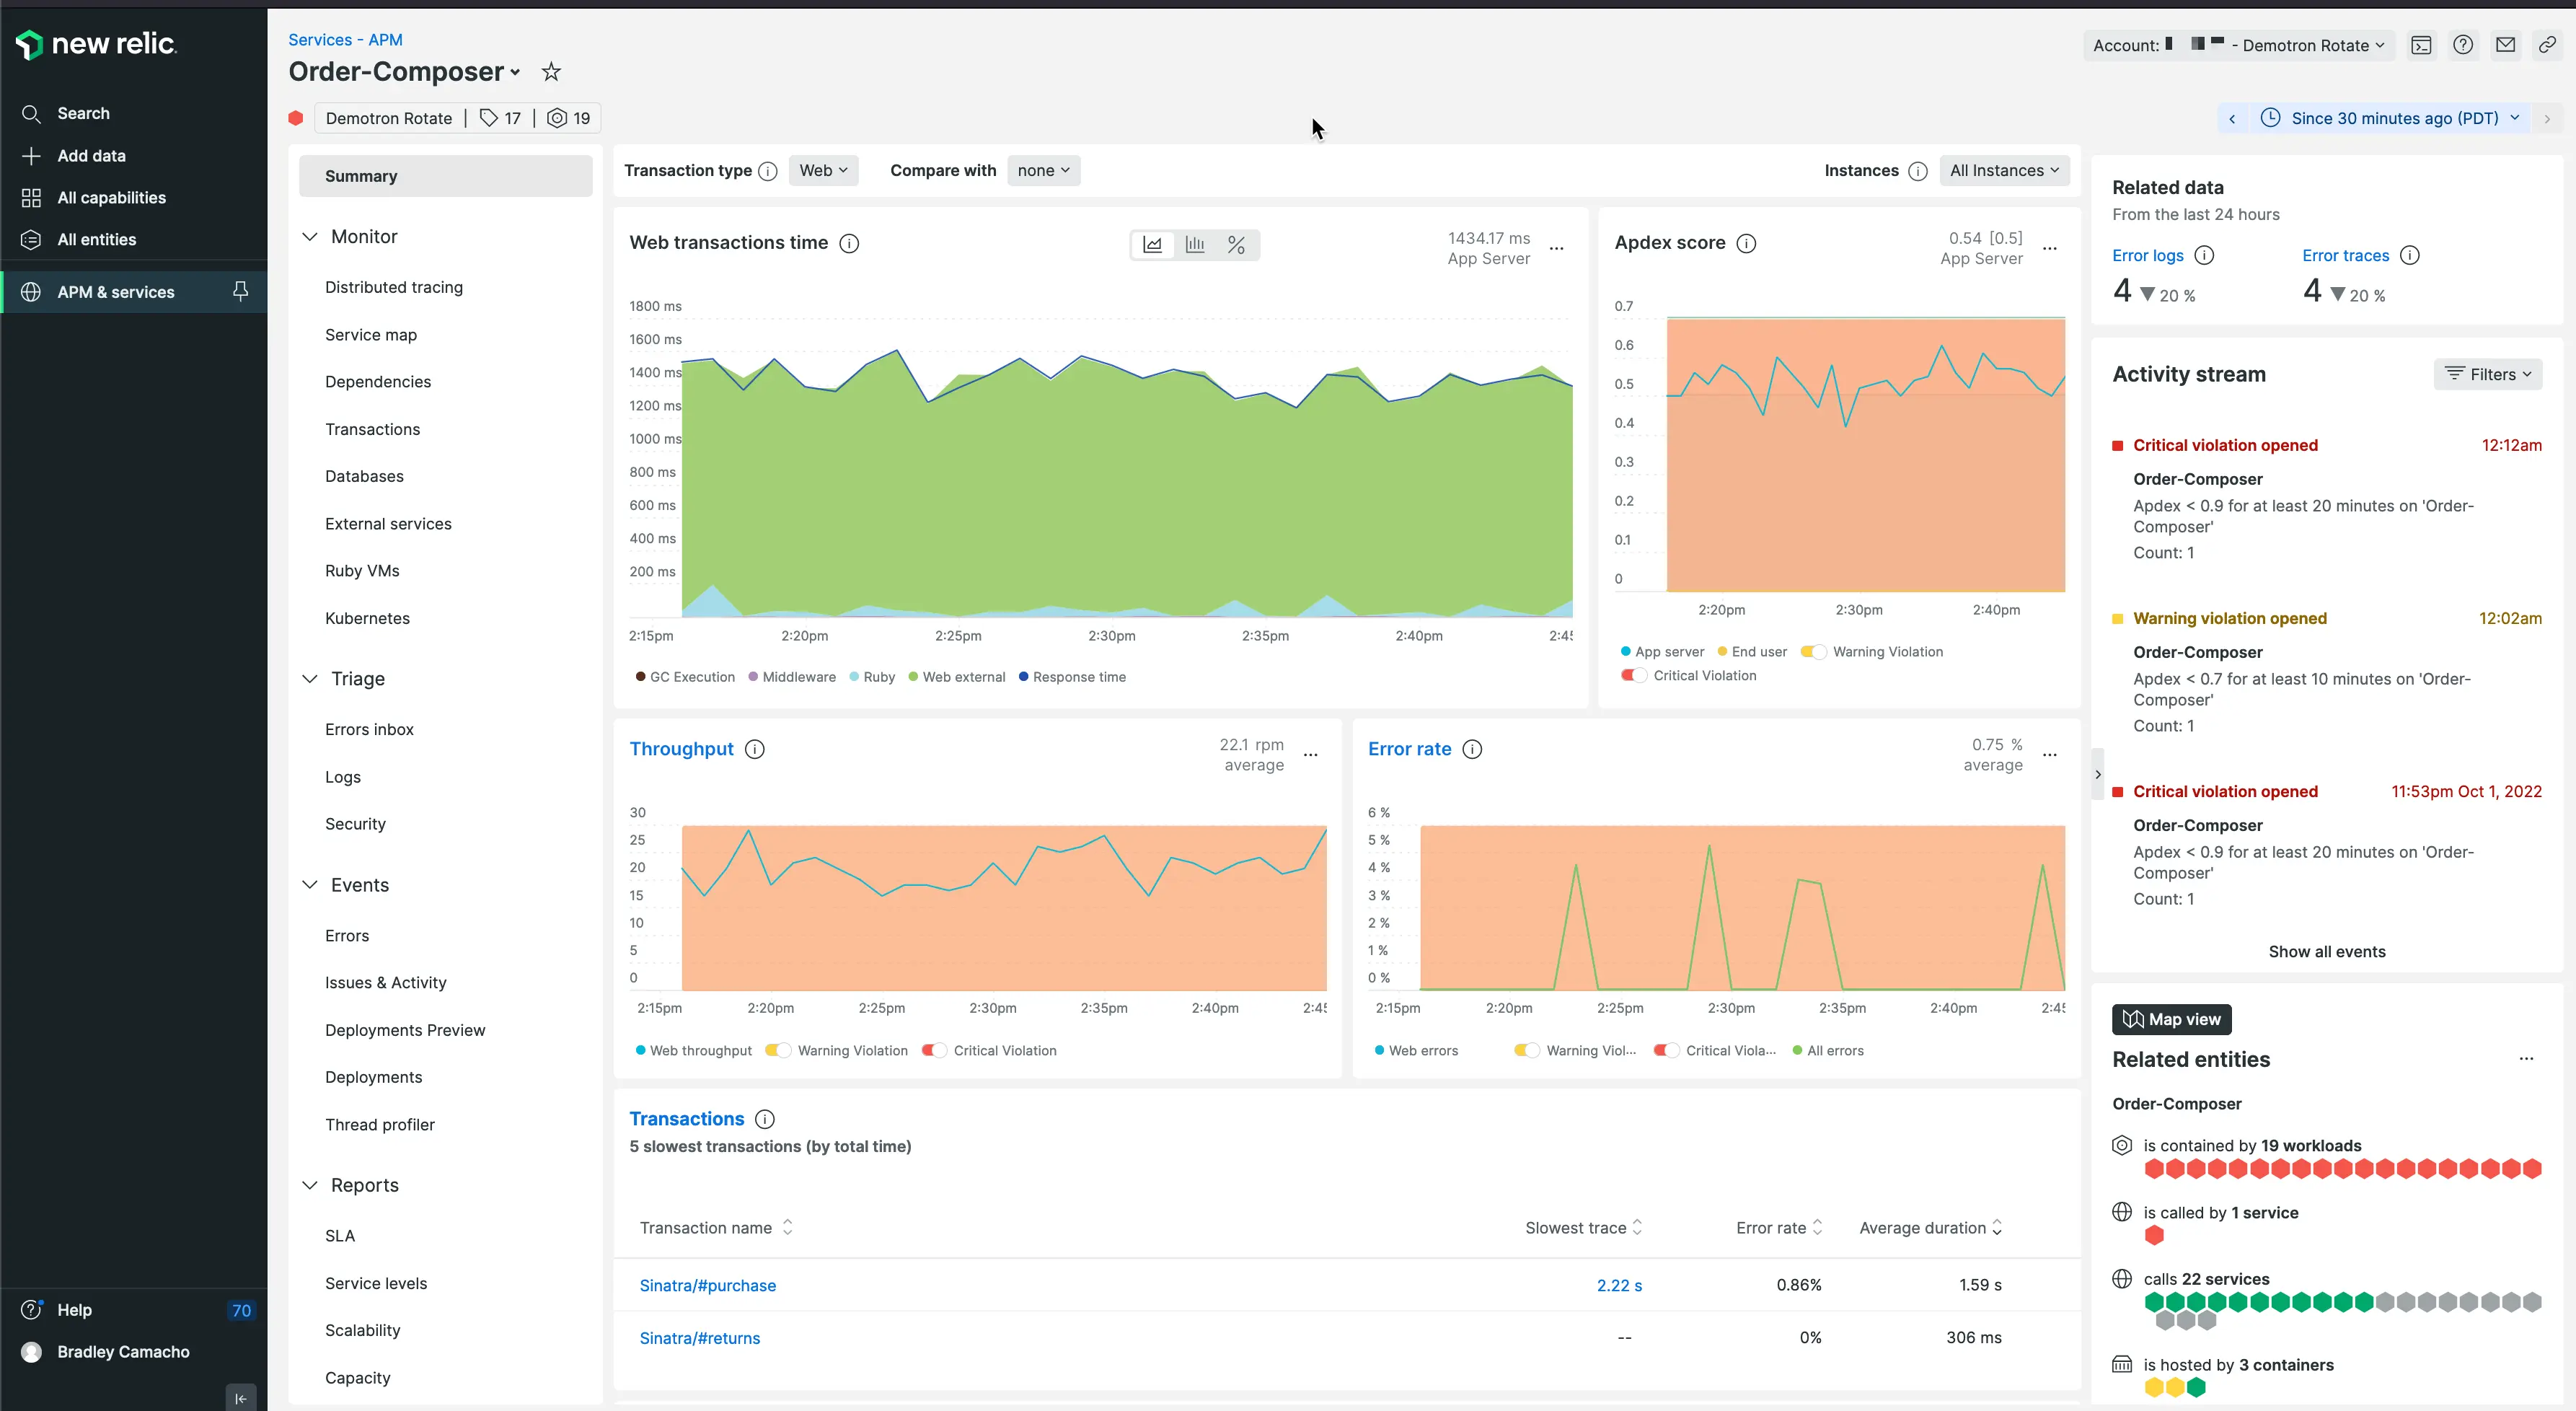
New Relic is one of the oldest companies in this domain and can be a solid DataDog alternative. If you opt for a full user plan, you can get access to all the tools New Relic provides in its observability stack. The list of tools are:- Application Monitoring
- Browser Monitoring
- Mobile Monitoring
- Synthetic Monitoring
- Serverless Monitoring
- Infrastructure Monitoring
- Log Management
Standard offering includes plans for teams upto 5 full users. Their pricing depends on the amount of data ingested with 100 GB free data ingest and $0.30 per extra GB. One issue with New Relic pricing is its user-based pricing. Apart from data ingestion, New Relic also charges based on the number of users using the product. New Relic’s user pricing can go up to $549/user. At scale, the cost of adding users can go up to 66% of the total bill.
You can visit their pricing page for details.
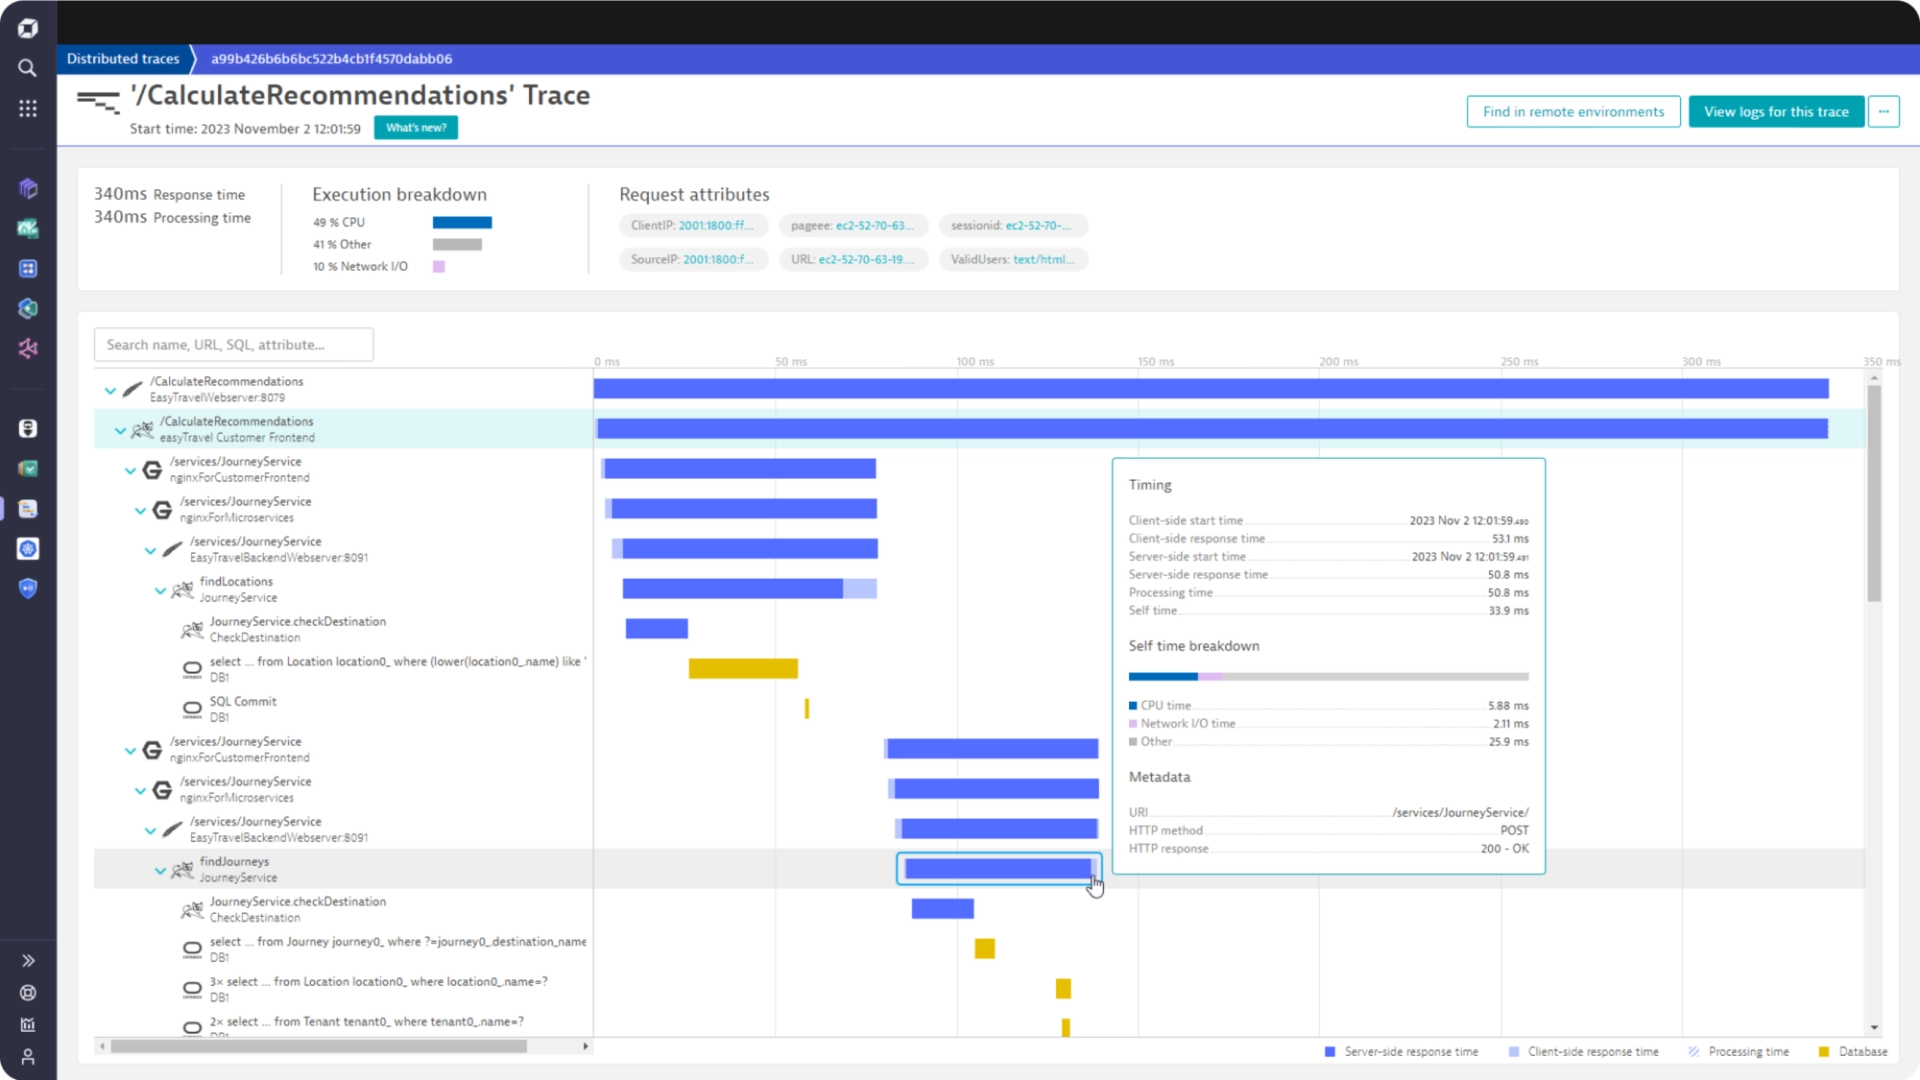
Dynatrace
Dynatrace is a DataDog alternative that provides a broad spectrum of monitoring services aimed at large-scale enterprises. To use Dynatrace, you need to install a single agent per host which will collect all relevant metrics. Dynatrace calls this agent, OneAgent and it can serve the following use-cases for monitoring:- Analyze performance of all user requests within your application
- Monitor server side services
- Network monitoring
- Cloud and virtual machines monitoring
- Monitor containerized environments like Docker, Kubernetes
- Root-cause analysis
Full-stack monitoring, the Dynatrace product aimed to provide observability for apps, is priced at $69 per month for 8 GB per host if billed annually.
Grafana
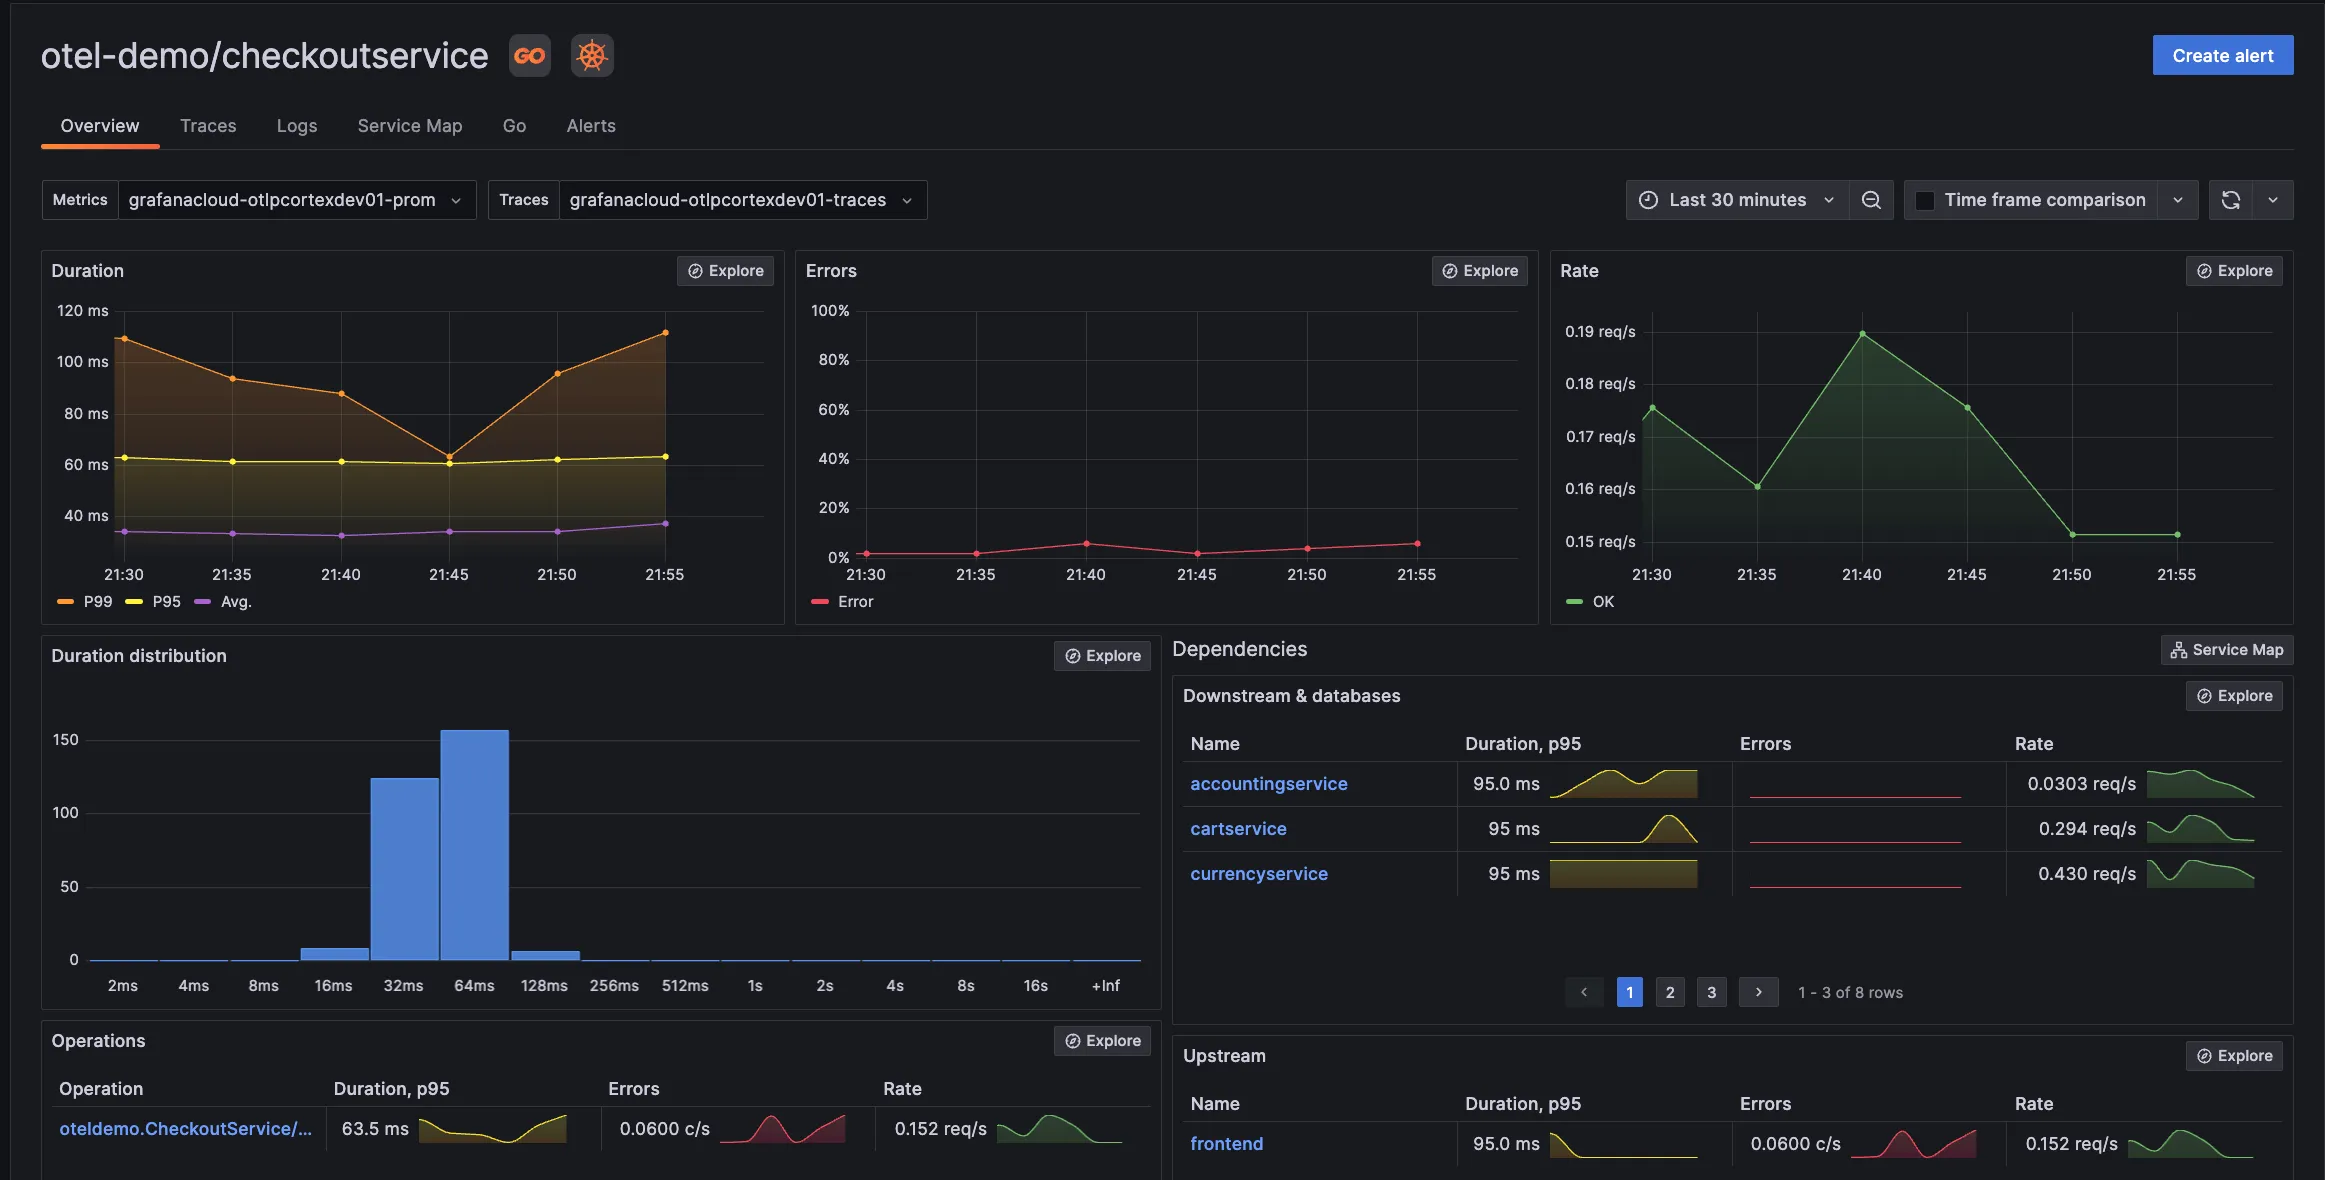
Grafana is an open-source data visualization tool that you can use as a Datadog alternative. It offers a cloud service called Grafana Cloud, where you can send your logs, metrics, and traces for APM and overall observability.
If you’re looking to use Grafana as a Datadog alternative, then you’ll use the core LGTM stack. It is particularly popular in cloud-native environments, offering a comprehensive solution for observability that covers logs, metrics, traces, and visualization.
- Loki: An efficient log aggregation system that indexes log metadata, enabling cost-effective storage and fast querying, integrated seamlessly with Grafana.
- Grafana: A versatile visualization tool offering customizable dashboards to display and analyze data from various sources, including metrics, logs, and traces.
- Tempo: A distributed tracing backend focused on scalability, storing and querying trace data, with easy integration into Grafana for visualization.
- Mimir: A long-term, scalable storage system for Prometheus metrics, ensuring high performance and availability for large-scale metric data.
The disadvantage of using the LGTM stack is managing multiple backends, which can be cumbersome.
Logicmonitor
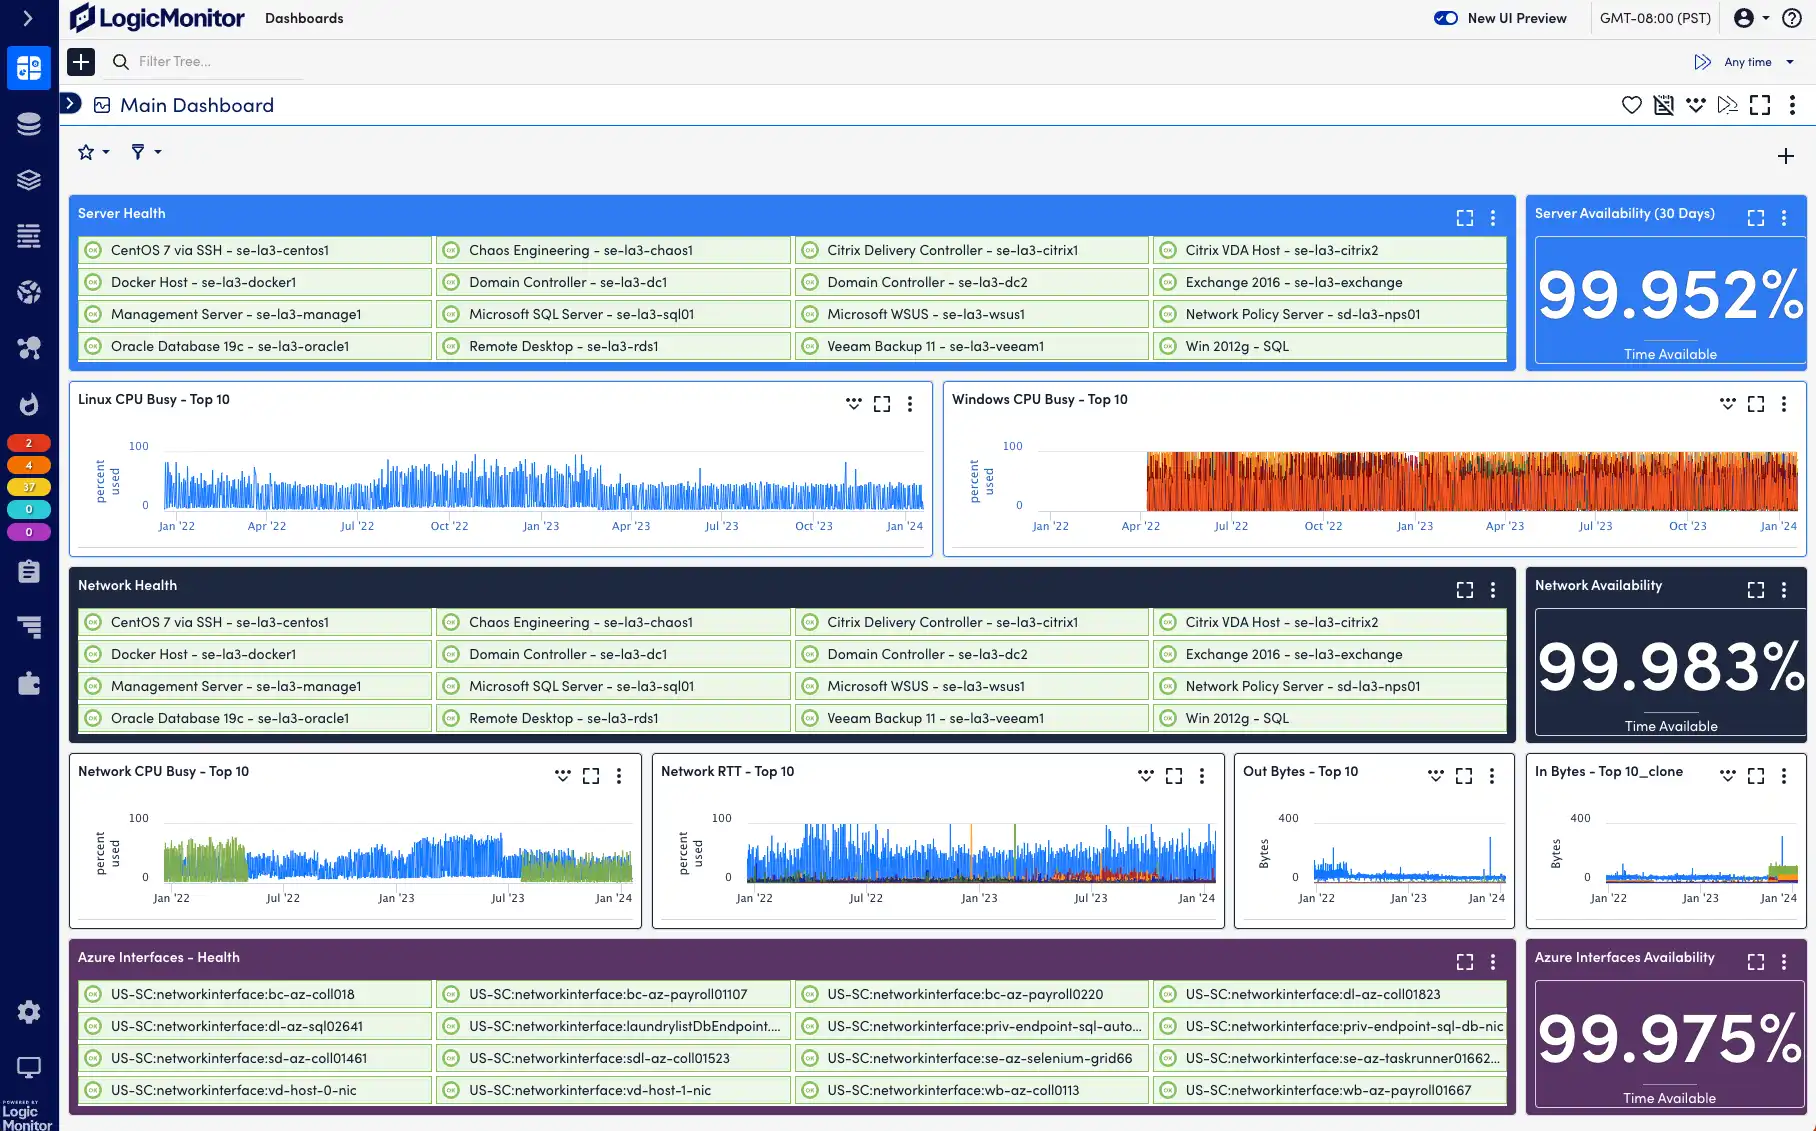
LogicMonitor is a cloud-based infrastructure monitoring platform that can be used as a DataDog alternative if you're looking for infrastructure monitoring. It also provides AIOps features, including root cause analysis, anomaly detection, and forecasting.With dynamic topology mapping, you can have an overview of your network devices and their inter-dependency. Some of the key monitoring capabilities provided by LogicMonitor are:
- Cloud Monitoring (AWS, Google and Azure)
- Container Monitoring (Kubernetes)
- Network Monitoring
- Server Monitoring
- Storage Monitoring
- Database Monitoring
AppDynamics
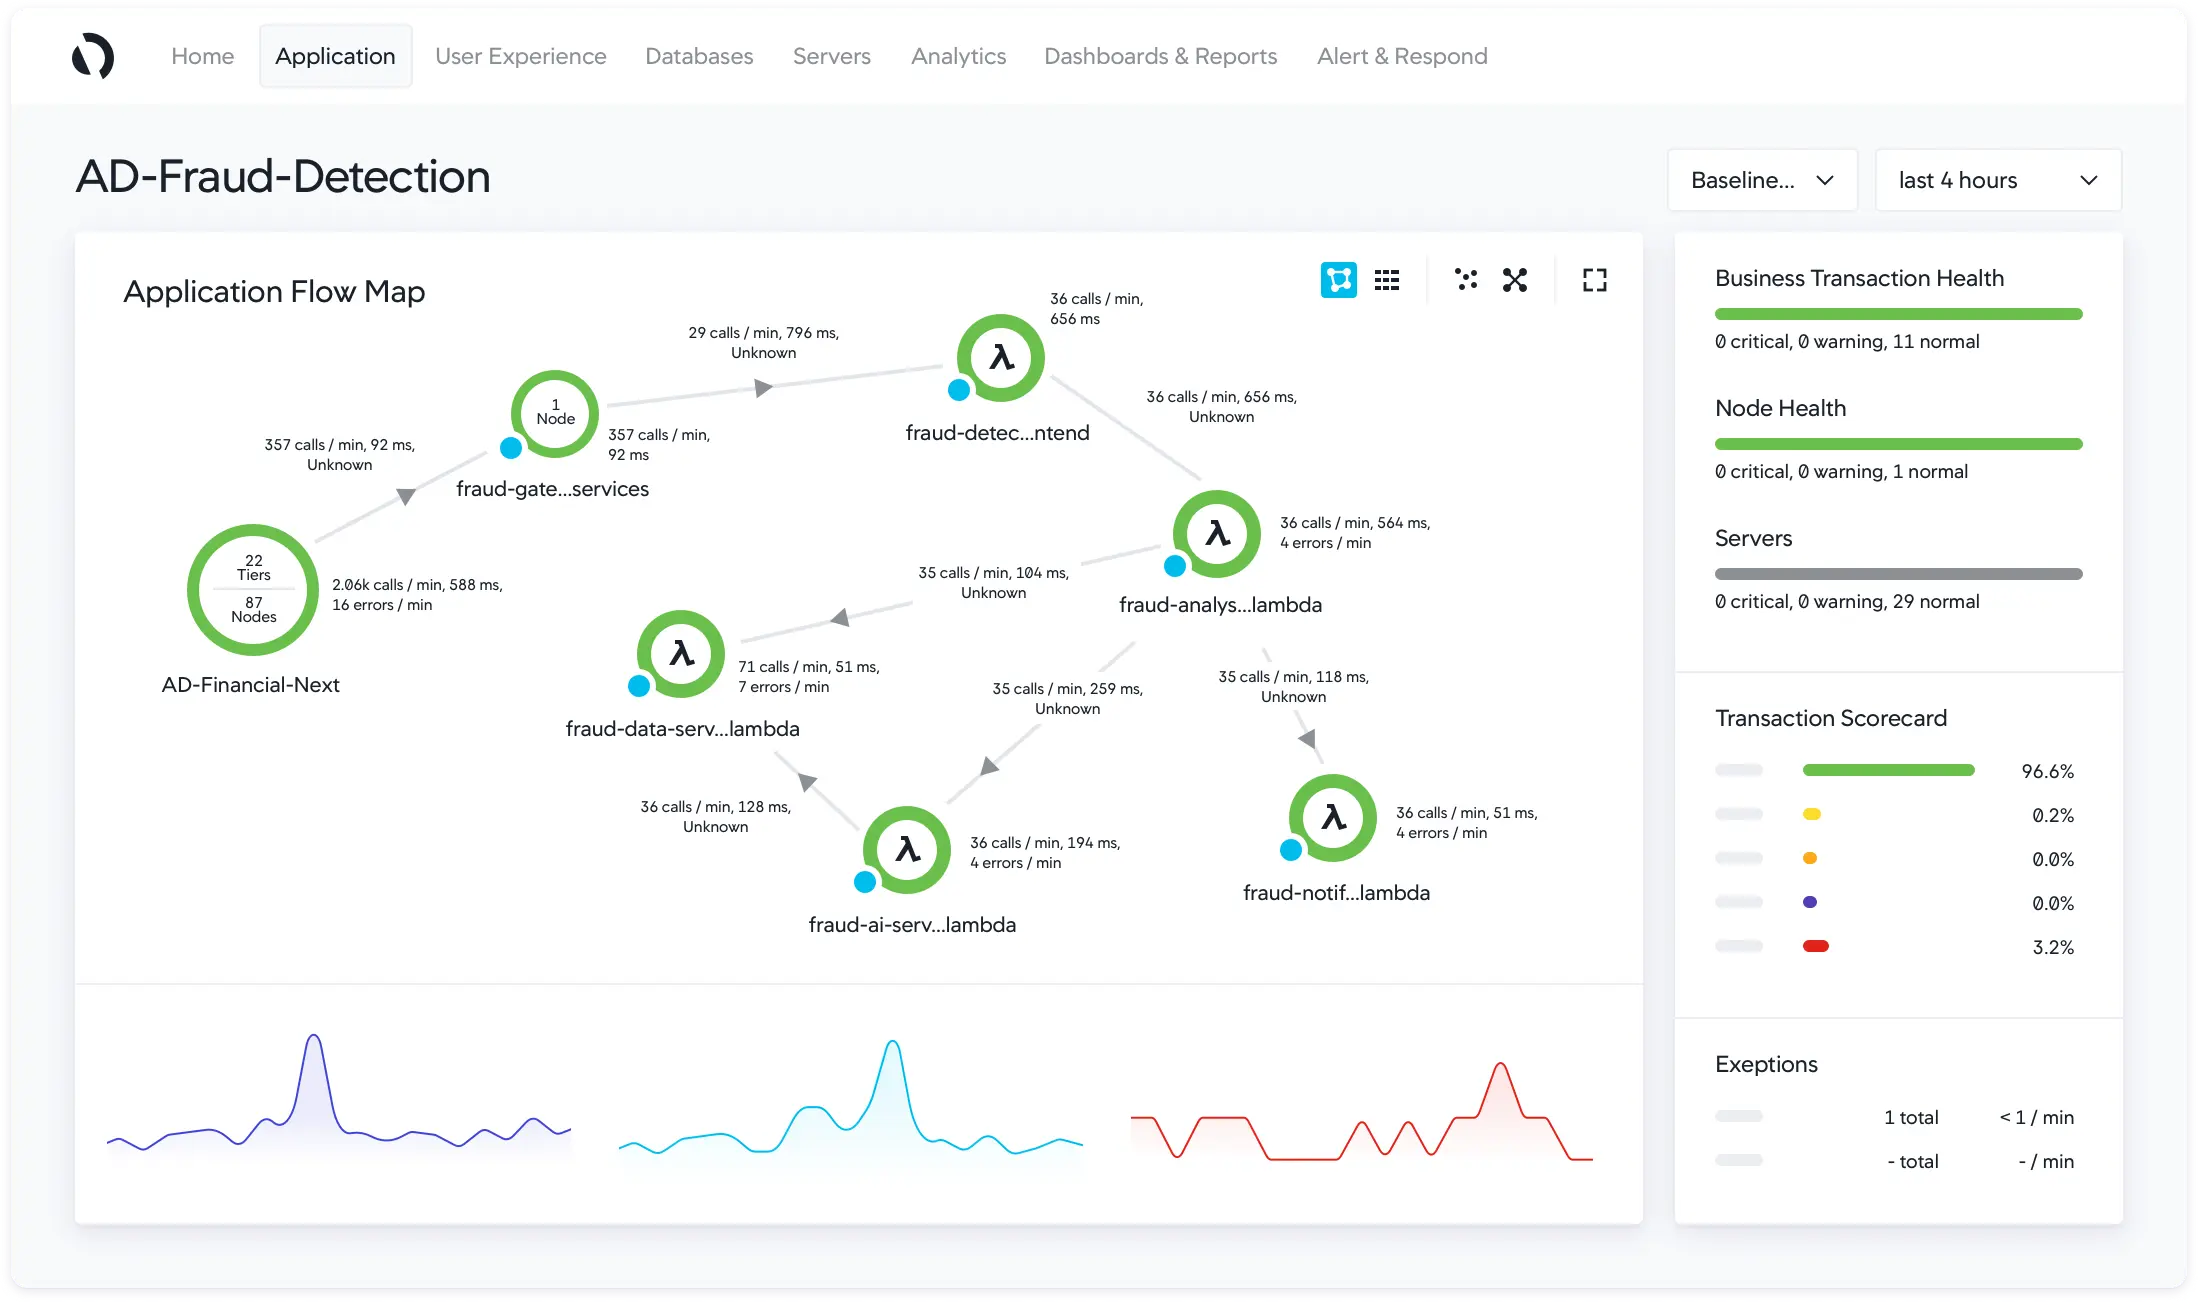
AppDynamics is an extensive SaaS tool that promises to correlate business metrics and application performance metrics. It can be used as a good DataDog alternative. Its platform includes an APM tool that provides code-level observability.Some of the key features of the AppDynamics APM tool includes:
- Language support for Java, .NET, Node.js, PHP, Python, C/C++ and more
- Troubleshoot issues like slow response times and application errors
- Discover application topology automatically
- An alert system to alert you to issues in the context of business transactions
- Pricing starts at $60/month per CPU core
Splunk
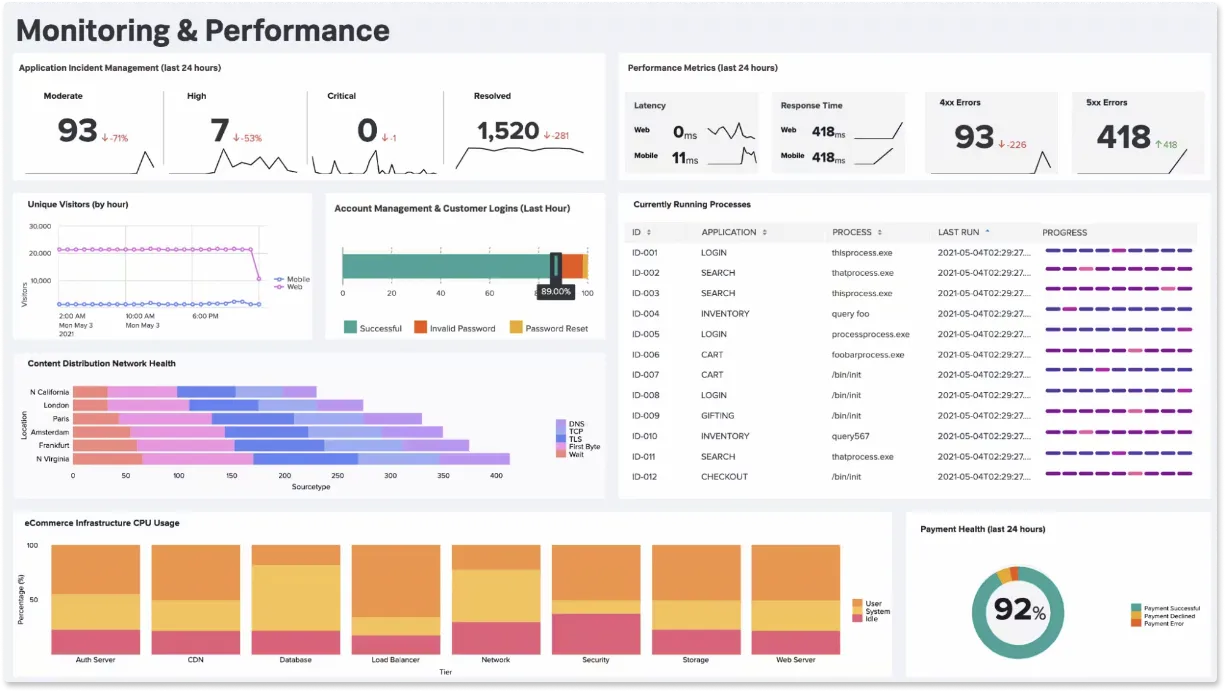
Splunk is a software platform designed for searching, monitoring, and analyzing machine-generated data. It's primarily used for log and event data analysis, but its capabilities extend to various types of data, including metrics, security information, and more. Splunk provides a centralized platform where you can collect, index, and visualize data from a wide range of sources, such as servers, applications, network devices, sensors, and websites.
Key features and use cases of Splunk include:
Log Management: Splunk can ingest, index, and store log data from various sources.
Security Information and Event Management (SIEM): It can be used for security monitoring and threat detection.
Monitoring and alerting: Splunk can set up real-time alerts based on predefined conditions, helping organizations respond to issues as they occur.
It offers both on-premises and cloud-based solutions, and it has a wide range of apps and integrations to support specific use cases and industries.
Sematext
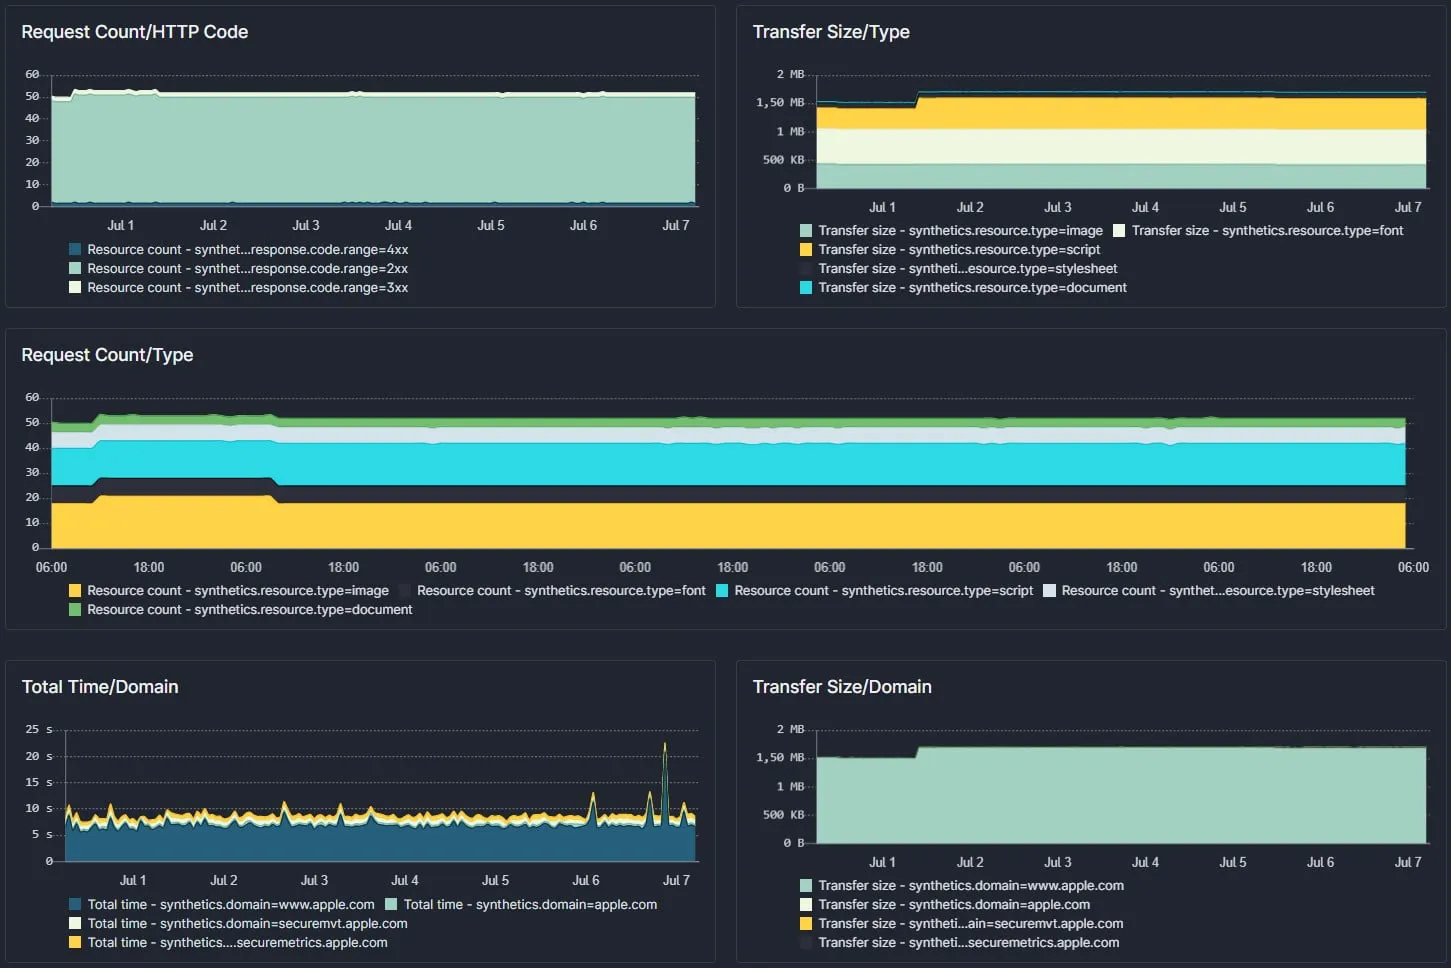
Sematext is a monitoring tool that specializes in providing monitoring, logging, and observability solutions for modern software applications and infrastructure. The company offers a range of tools and services designed to help organizations gain insights into their systems, troubleshoot issues, and improve overall performance.
Here are some key features of Sematext:
Metrics Monitoring: Sematext offers monitoring solutions that allow organizations to collect and visualize metrics from various sources, including servers, applications, containers, and cloud services.
Log Management: Sematext provides log management tools that enable the collection, aggregation, and analysis of log data from different components of an organization's technology stack.
Tracing and APM: Sematext offers application performance monitoring and tracing capabilities, allowing organizations to trace requests and transactions through their applications.
Infrastructure Monitoring: Sematext's solutions cover infrastructure monitoring, allowing organizations to monitor server health, resource utilization, and network performance.
Sumologic
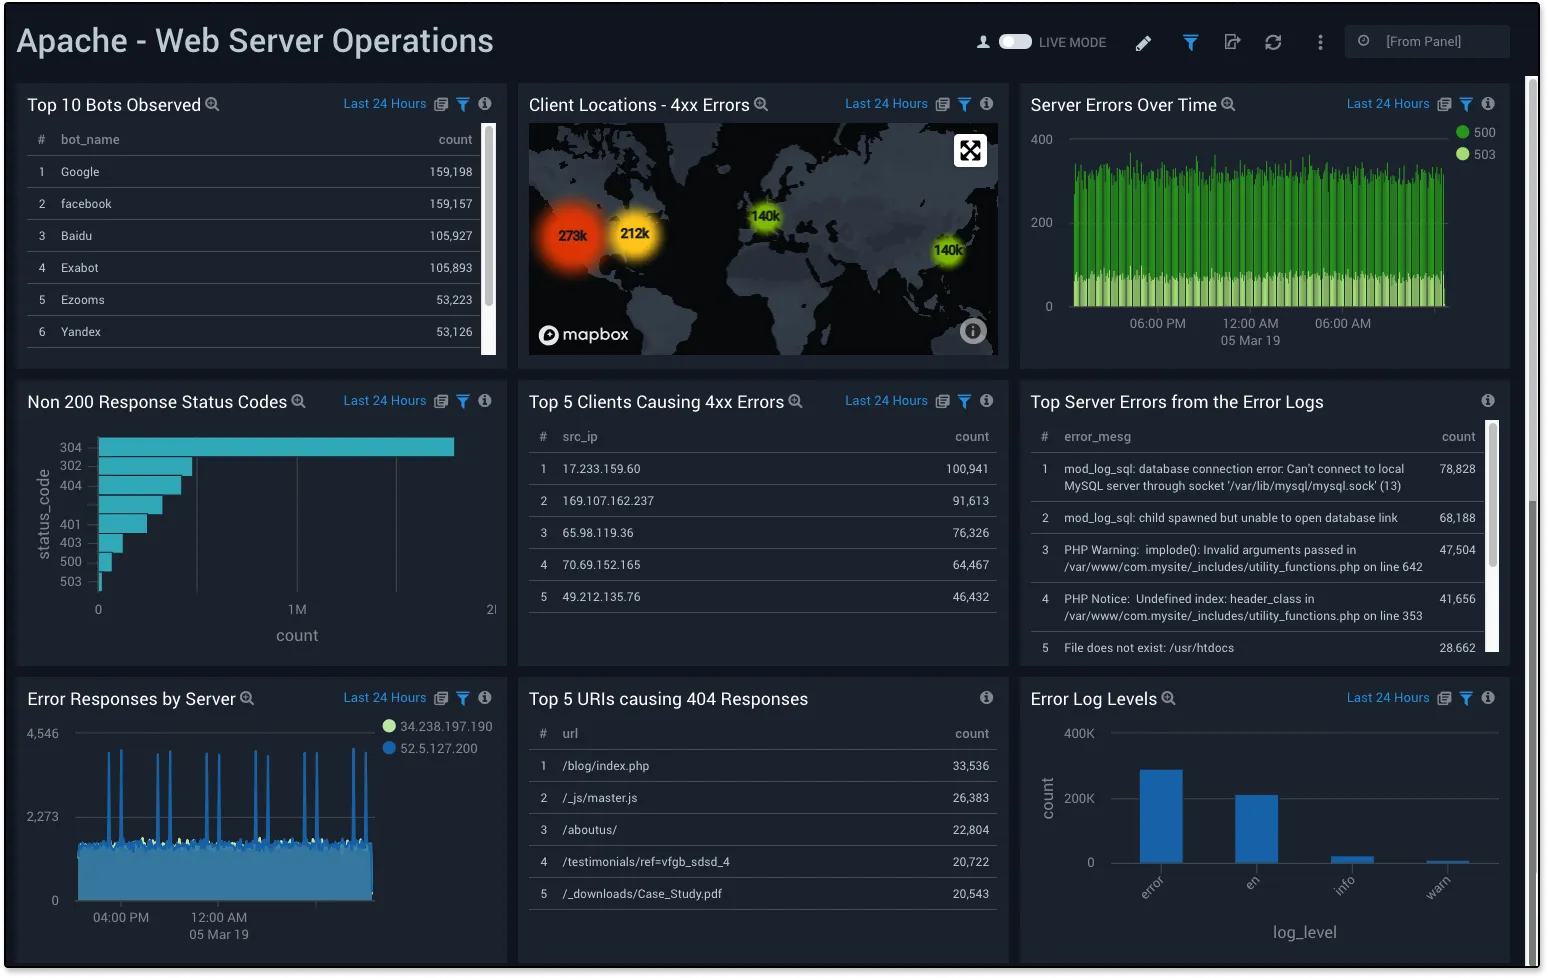
Sumo Logic is a cloud-based log management and analytics platform that helps organizations collect, manage, and analyze data generated by their applications, systems, and infrastructure. It is designed to provide real-time insights into the performance, security, and operational aspects of an organization's IT environment.
Here are some key features and use cases of Sumo Logic:
Log Management: Sumo Logic allows organizations to centralize the collection and storage of log data from various sources, including servers, applications, cloud services, and network devices.
Real-Time Monitoring: Sumo Logic provides real-time monitoring and alerting capabilities, enabling organizations to proactively detect and respond to issues as they occur.
Log Analysis: Users can perform advanced log analysis using Sumo Logic's query language and search capabilities. This allows for the identification of patterns, anomalies, and trends within log data.
Security Information and Event Management (SIEM): Sumo Logic can be used as a SIEM solution, helping organizations detect and investigate security threats by correlating and analyzing security-related data from logs and other sources.
Choosing the right Datadog alternative
If you're looking for a Datadog alternative, you might be frustrated with its billing practices. So it's important to choose a tool that has transparent and predictable pricing policies. For few users, Datadog is just too complex to use with all its bells and whistles.
Monitoring and observability are critical components that you can't ignore for your applications in the production environment. As such, choosing the right tool which can empower you to take actions proactively is very important. Though DataDog is a good tool, it has its own challenges, including cost, unclear pricing policies, and complex UI.
The above DataDog alternatives can be a good option to meet your monitoring needs. If you're moving out of Datadog, a good option can be to move out of closed SaaS vendors and shift towards open source solution. Many application owners are now shifting to OpenTelemetry for their observability data. While tools like Datadog and New Relic claim that they support OpenTelemetry, their support is not first-class. OpenTelemetry is an open-source collection of APIs, SDKs, and tools. It can be used to instrument, generate, collect, and export telemetry data (metrics, logs, and traces) to help you analyze your software’s performance and behavior.
Using OpenTelemetry to generate telemetry data fress you from vendor lock-in as it gives you an option to export the data to a backend of your choice. For an OpenTelemetry backend, SigNoz can be a great choice. It is built to support OpenTelemetry data natively.
Getting started with SigNoz
SigNoz cloud is the easiest way to run SigNoz. Sign up for a free account and get 30 days of unlimited access to all features.
You can also install and self-host SigNoz yourself since it is open-source. With 16,000+ GitHub stars, open-source SigNoz is loved by developers. Find the instructions to self-host SigNoz.
Read more about SigNoz:


