Auth, Org management, Exceptions monitoring & a team workation - SigNal 12
Alone we can do so little; together we can do so much.
> Helen Keller
This is our 12th monthly product newsletter, and every month our team has shipped code to make SigNoz better for our users. Our latest release is special! It is not only packed with much-awaited user-requested features, but it is also the first time our team met in person to ship a release together.
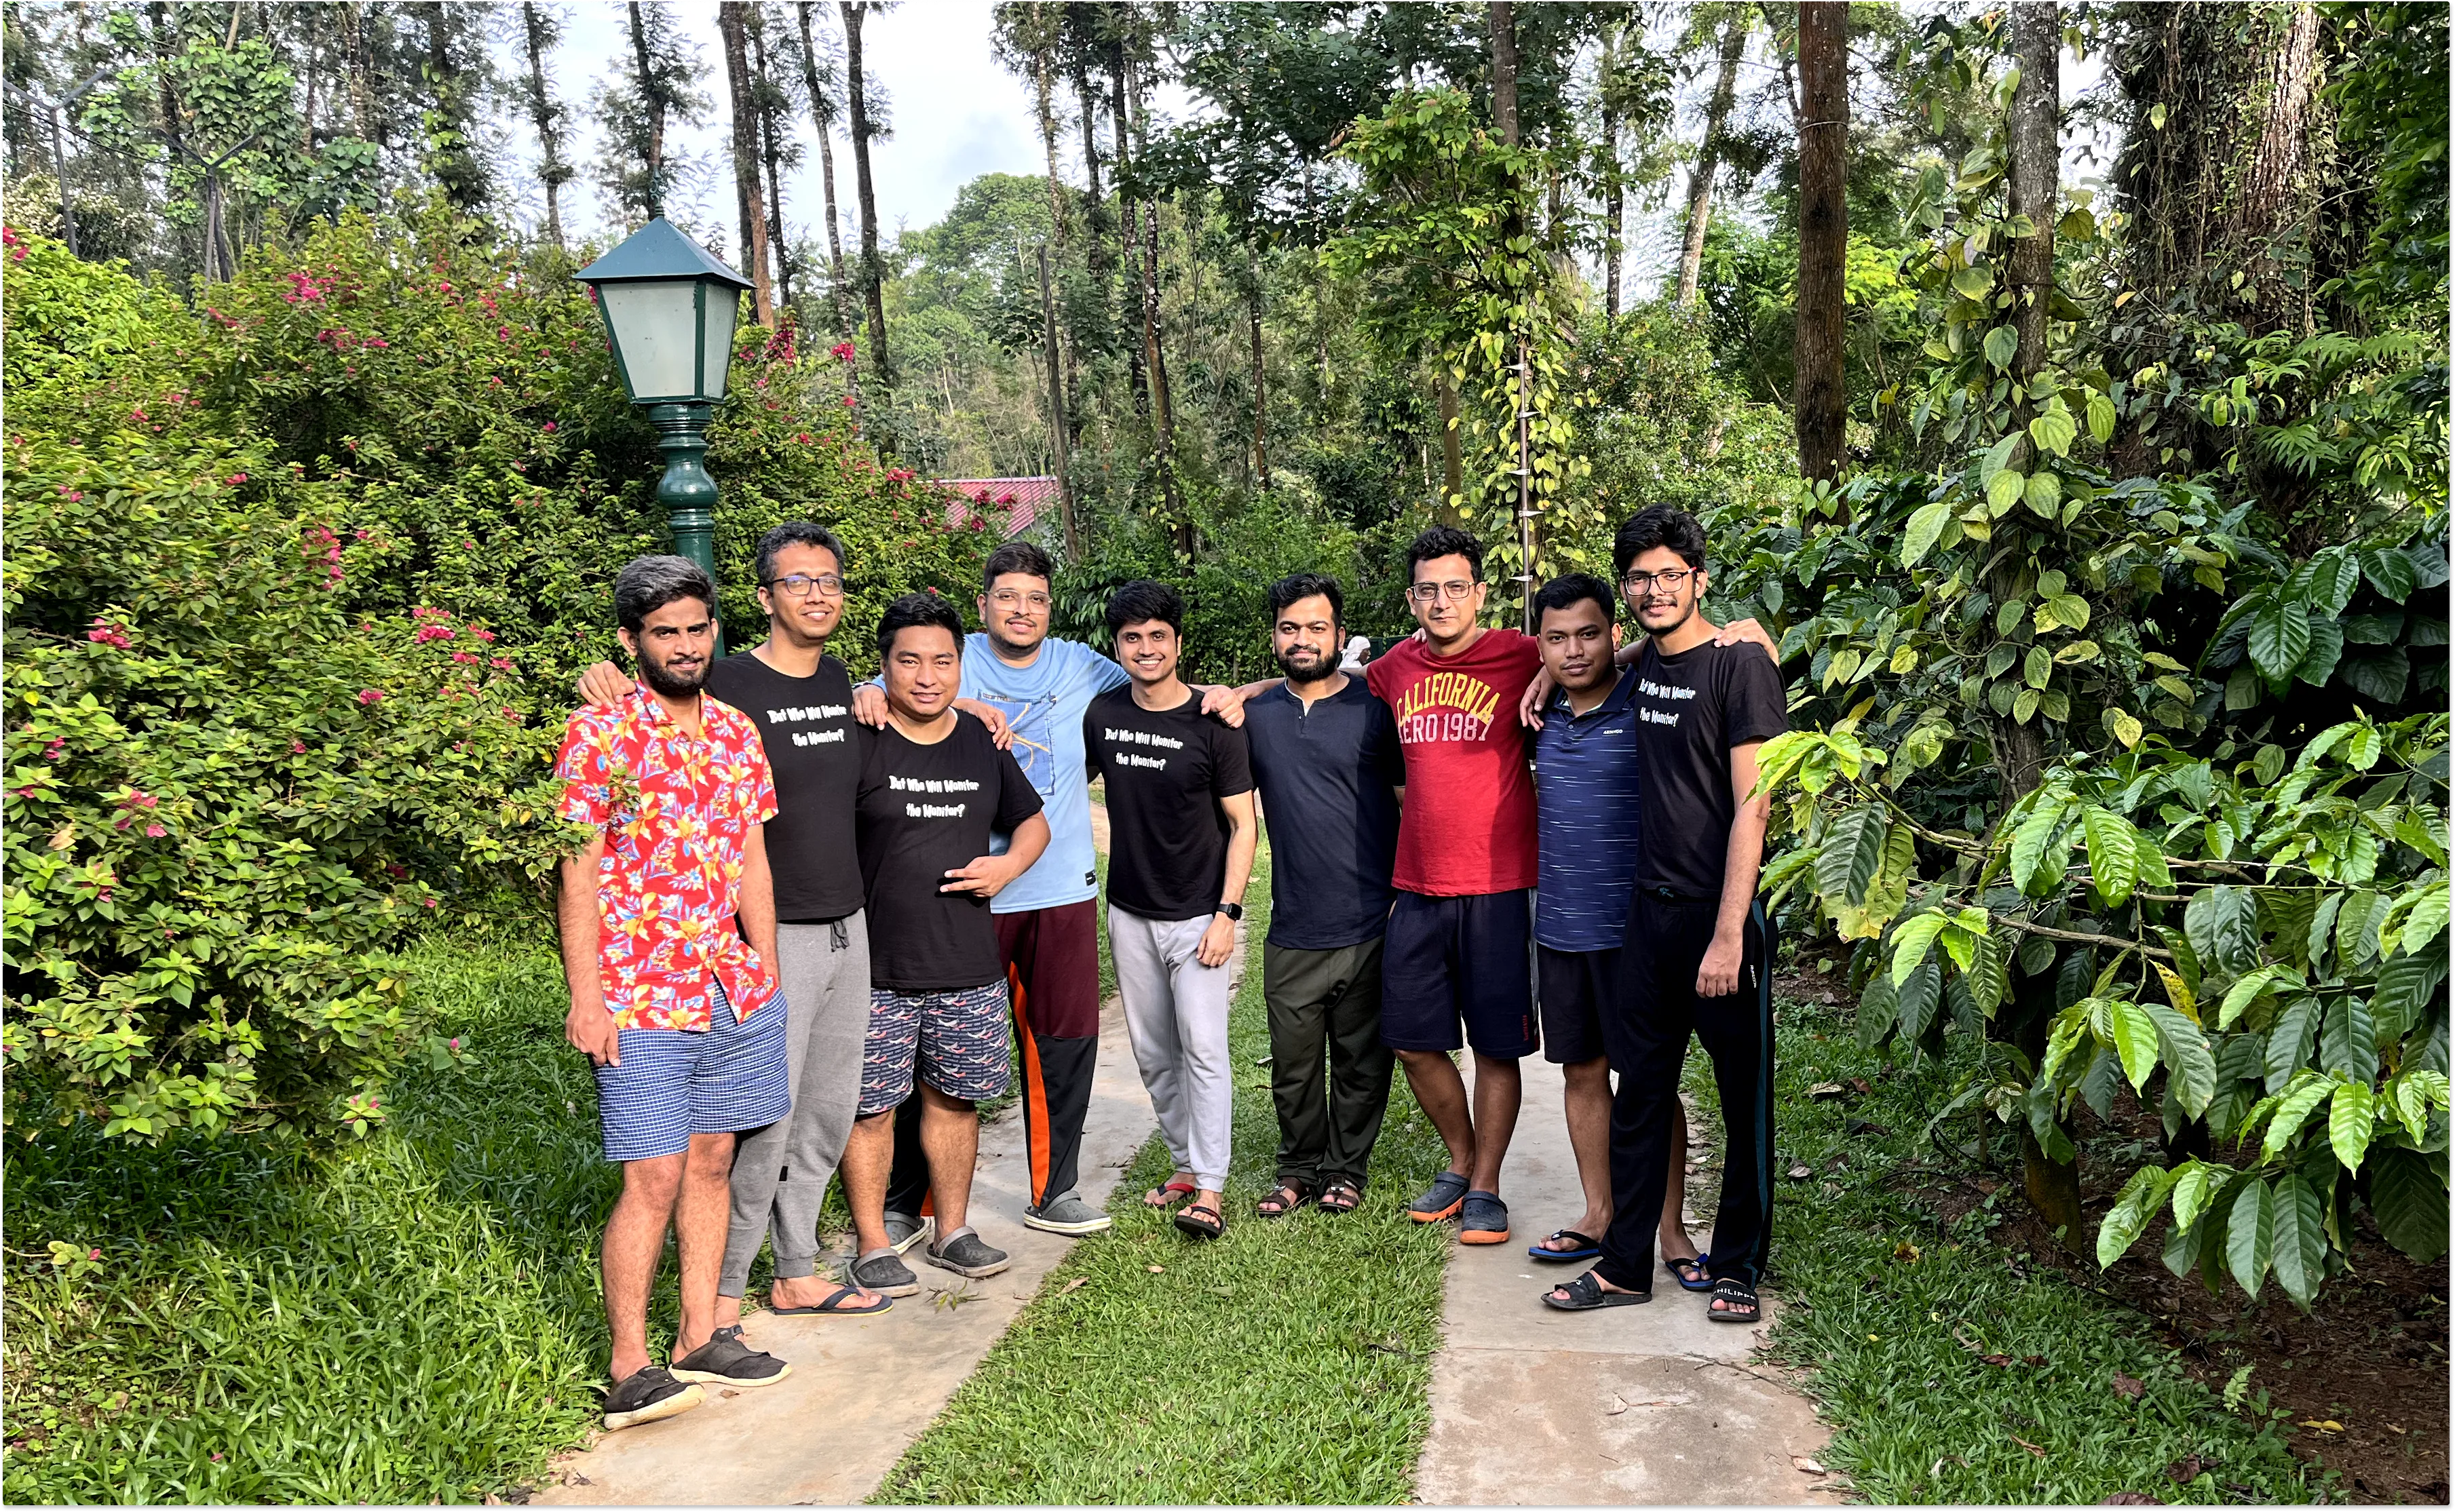
Yes, after 12 months of seeing each other on Zoom, we finally got a chance to see each other in person during our week-long workation.
We shipped auth, org management, and exceptions monitoring, among many other upgrades to our dashboard. Let’s see what humans at SigNoz were up to in the month of April 2022!
What we shipped?
Our latest release:
Authentication, and Org management
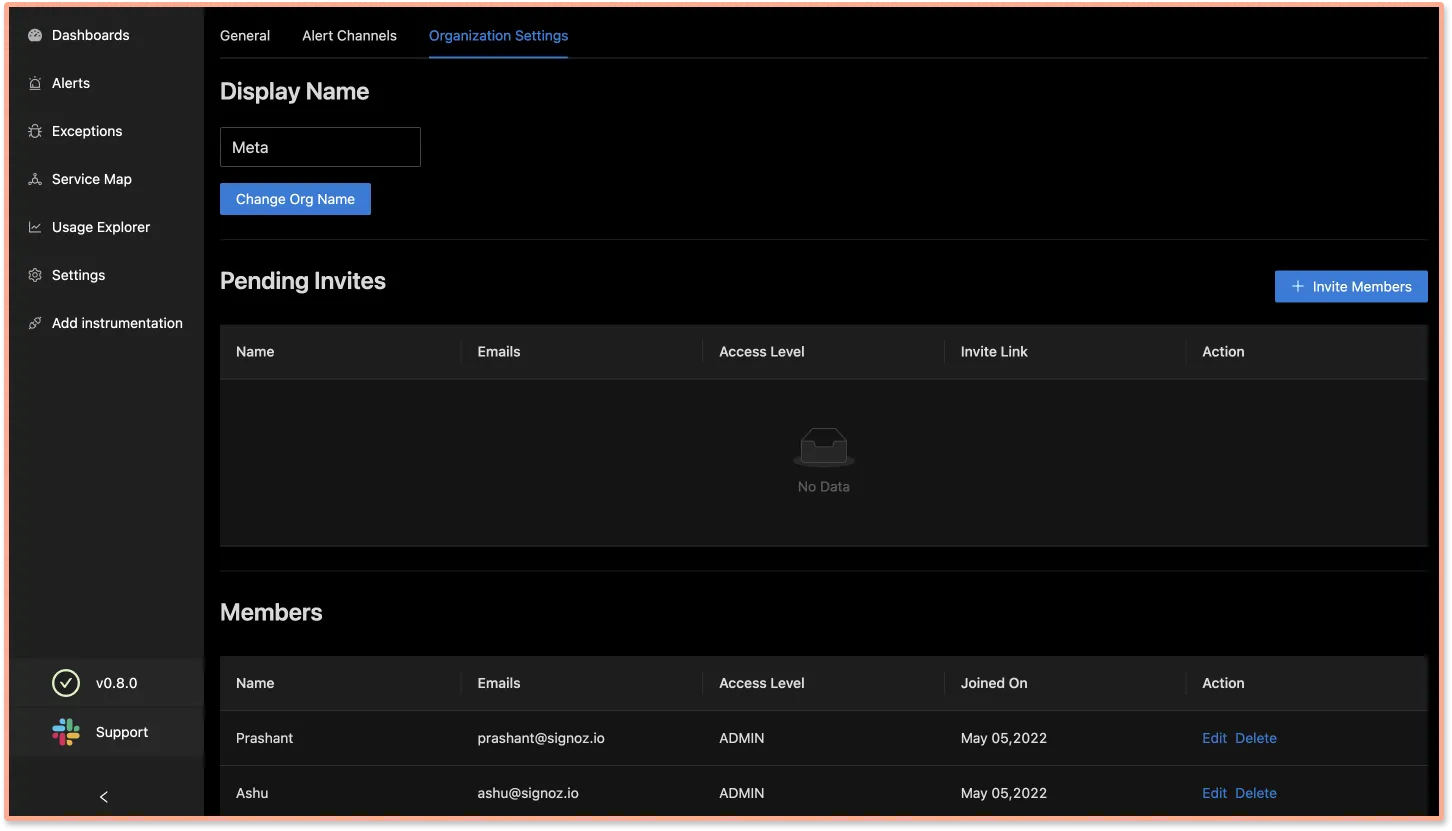
The latest version of SigNoz comes with login, authentication, and org management. These features were widely requested by our community and existing users. So, we are quite thrilled to ship it. And we have gone a step ahead by building RBAC tools for org management.
Org management will enable teams using SigNoz to collaborate better. There are three roles that our users can create with varying access levels:
- Admin
- Editor
- Viewer
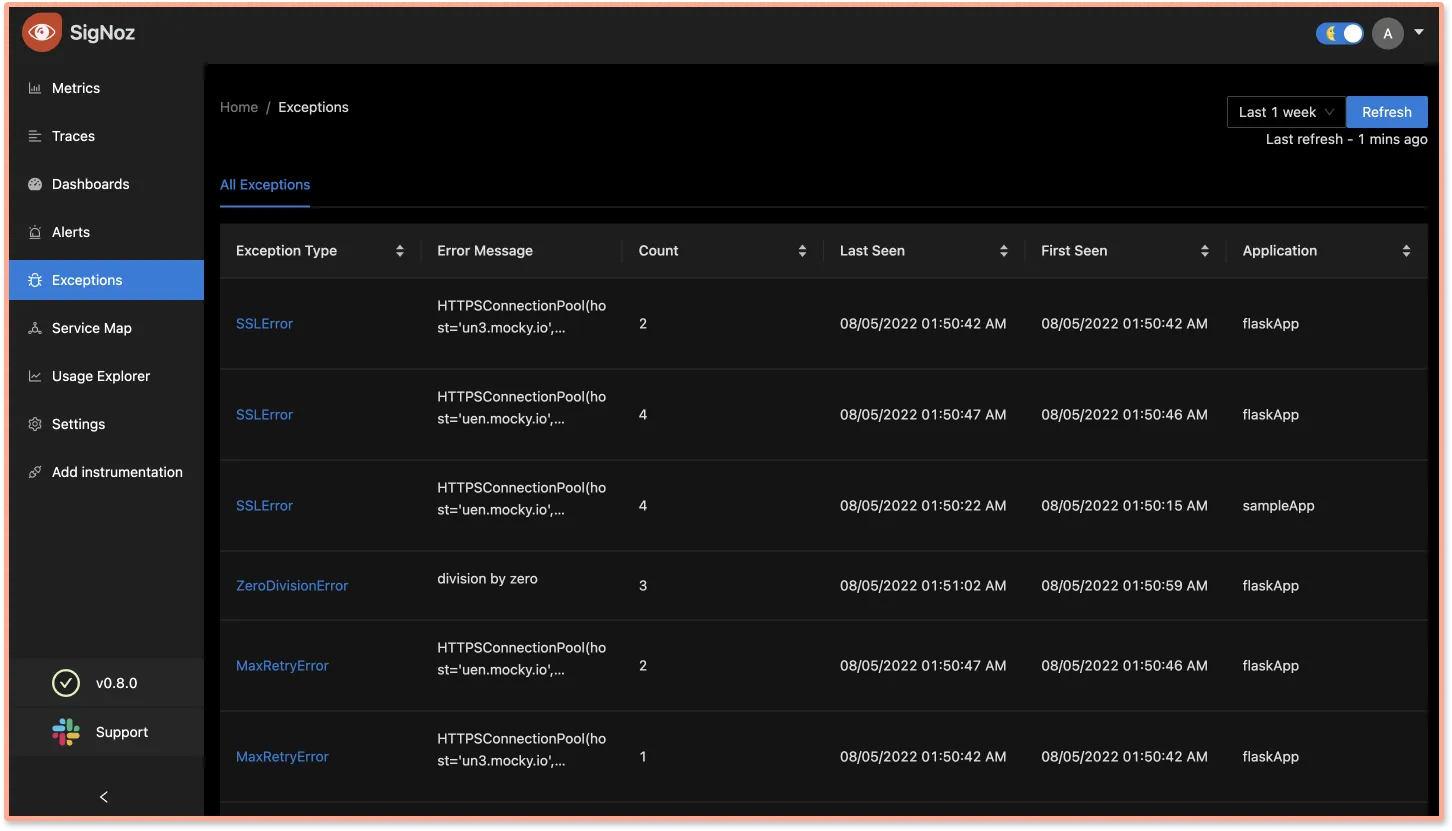
Monitor all your Exceptions at one place
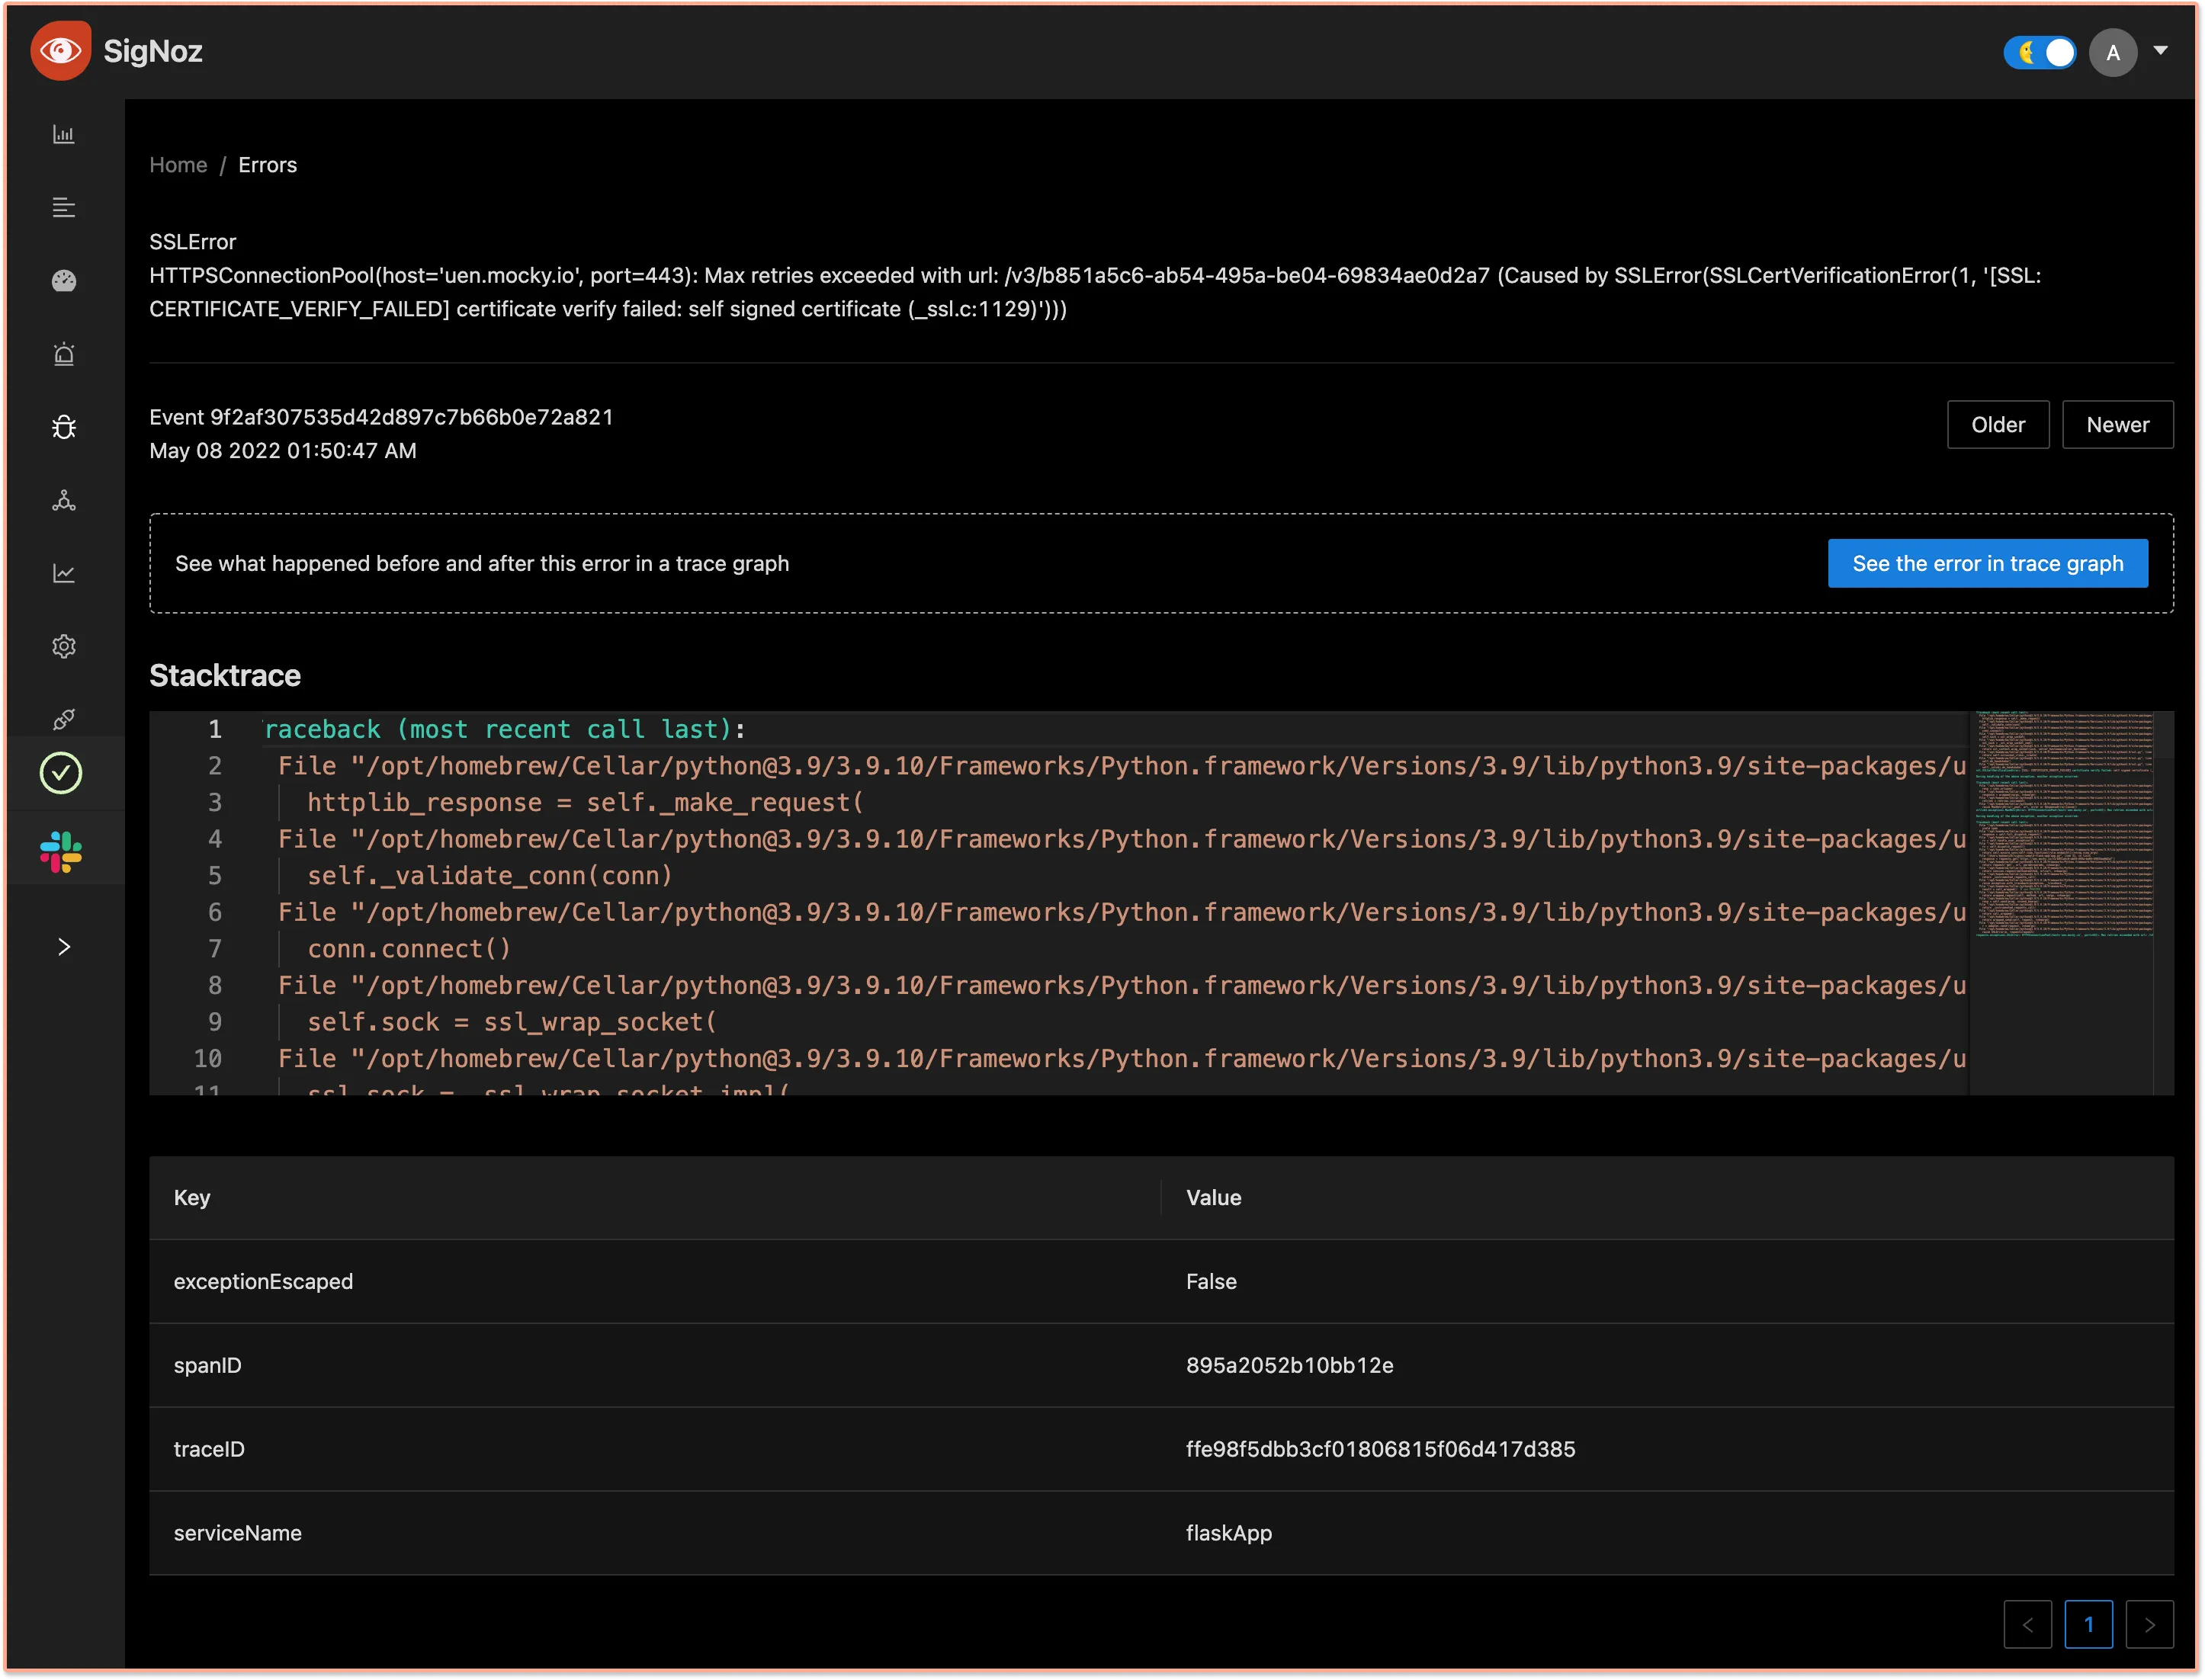
We shipped an entirely new tab for Exceptions monitoring. Now you can monitor popular exceptions like SSLError, ZeroDivisionError, MaxRetryError, etc., occuring in your application code at one place. We have also empowered our users to dig deeper into why these exceptions are happening.
You can click on any exception to see its stacktrace and check what happened before and after the exception using our trace graphs. The trace graph enables our users to access more contextual data around why the exception occurred.
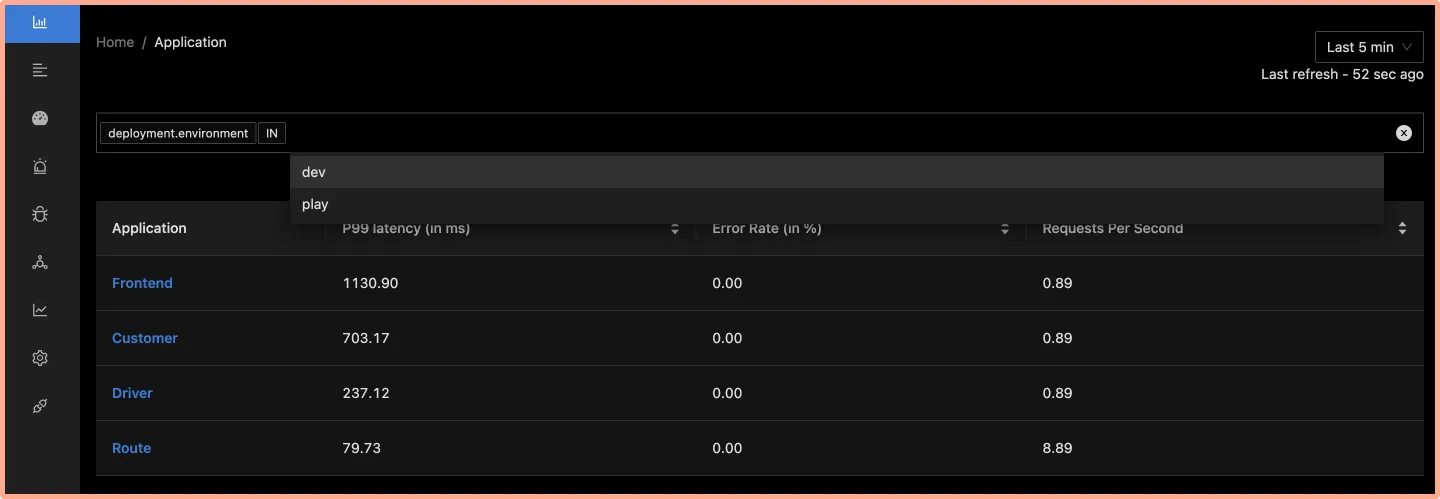
Filtering of applications based on resource attributes
A modern-day distributed application can have hundreds of services, and we have enabled filters for the list of applications based on attributes like deployment environment, namespace, etc. It makes navigation easier for our users to see their required applications quickly.
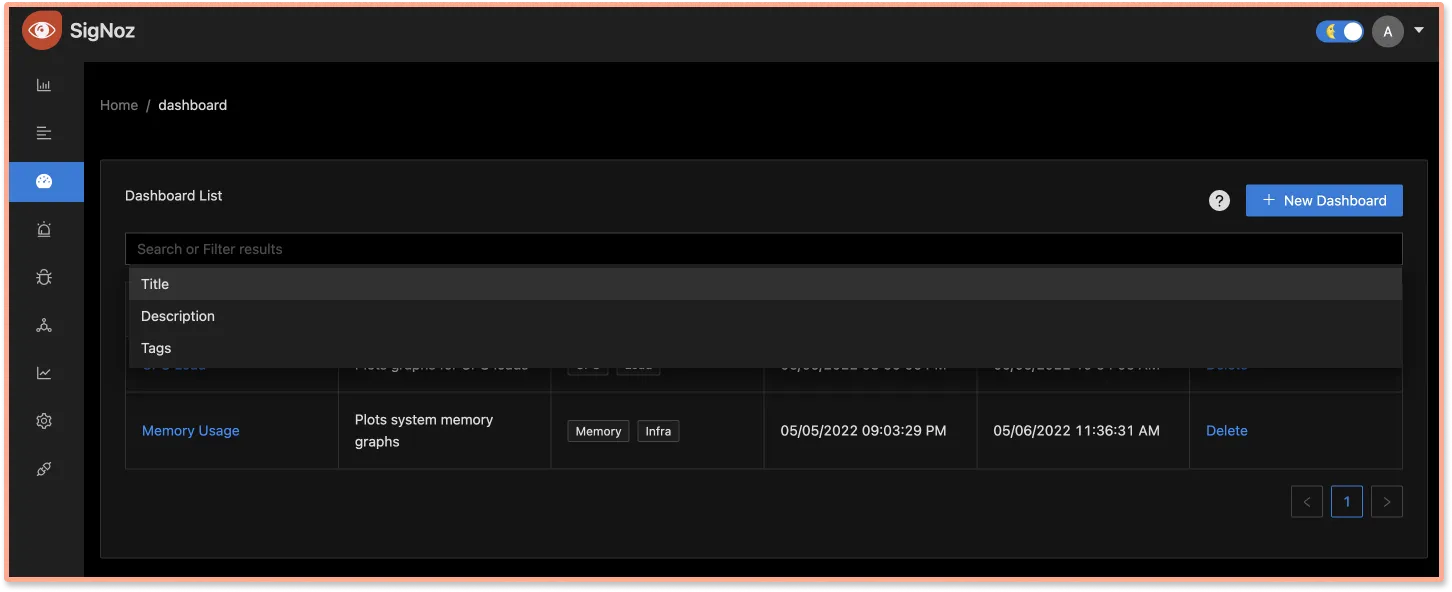
Likewise, in our Dashboards tab users can now apply filters based on Title, Description, and Tags.
Trace Dashboards Performance Improvement
We have improved the performance of our Trace Detail by up to 40x and our Trace Filter page by up to 3x. Our users deal with huge observability datasets, and it’s important for our query service to perform well when used with huge datasets.
Pagerduty integration
You can now integrate Pagerduty as a channel for your alerts. There are two ways to integrate Pagerduty as your alert channel:
- via global event orchestration
- Directly through an integration on Pagerduty service
You can find more details from our documentation.
What’s upcoming?
Metrics Builder
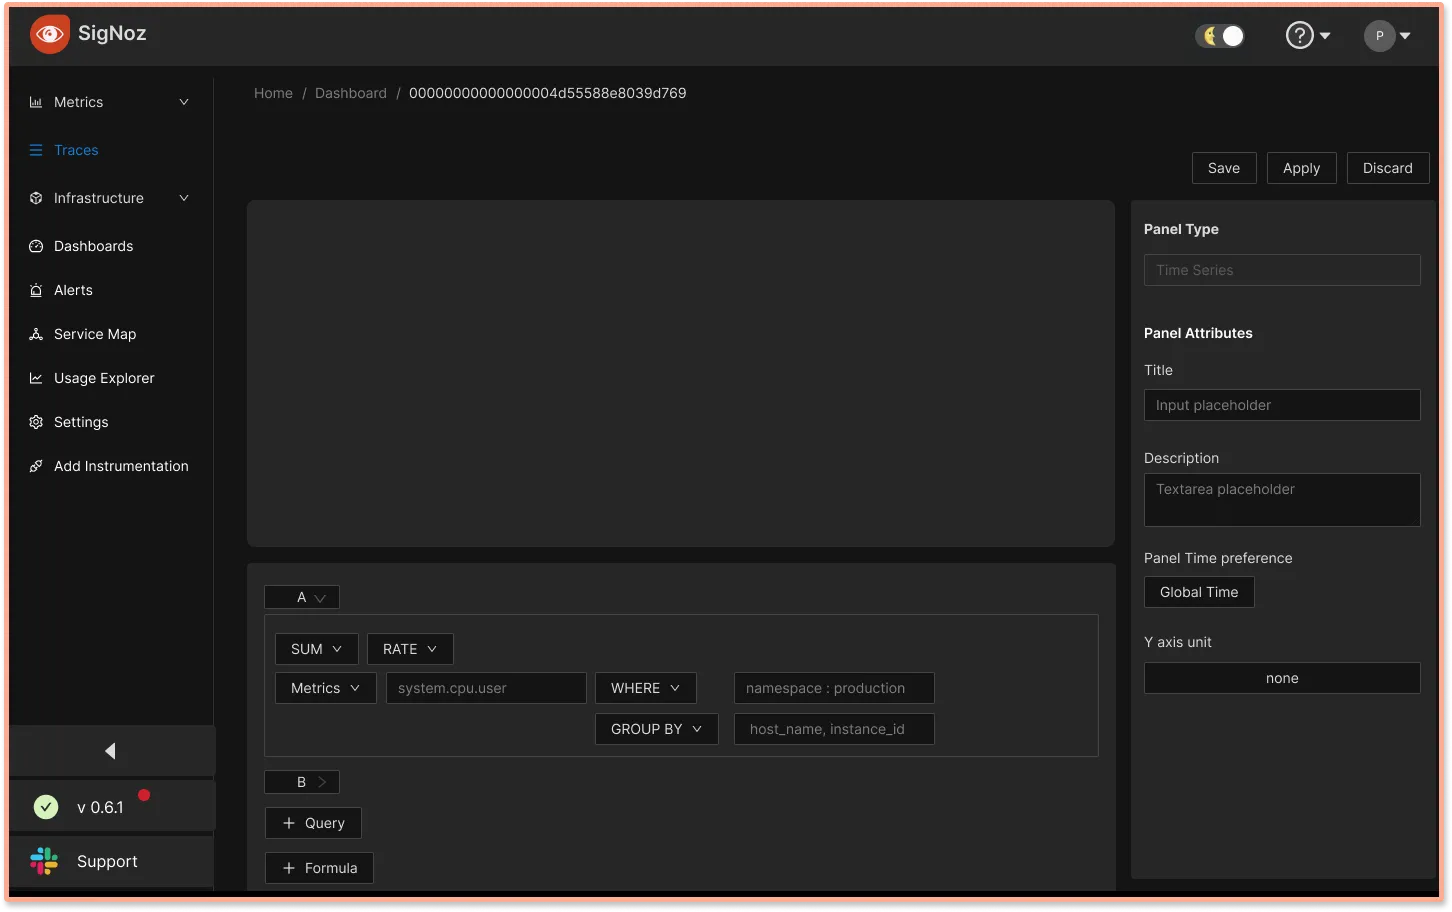
We want to make it easier for our users to visualize their metrics data. To enable that, our team is working on a Metrics Builder tool using which our users can plot their application metrics with a few clicks.
Here’s a sneak peek of our metrics builder 👇
Log Management
We have started working on the third pillar of observability i.e., logs. We already have metrics and distributed tracing in place, with some of the best visualization and query capabilities.
Adding logs to SigNoz will help our users have a central dashboard that can answer most of their questions regarding application performance issues.
Featured Issue
Supporting other Relational Databases
Currently, we use SQLite to store internal metadata like dashboards layout, alert config, etc. In cases where users need to run multiple instances of our query service, SQLite might not be the best option.
Let us know if you have any insights to share on this issue.
SigNoz News
Amazing Time at Team Workation
Till now, our team members had only met on Zoom. As a pandemic-born startup, we have built and shipped a lot of code together in a remote setup. But meeting the team in person and working together was an amazing experience for everyone.
KCD Bengaluru Presentation
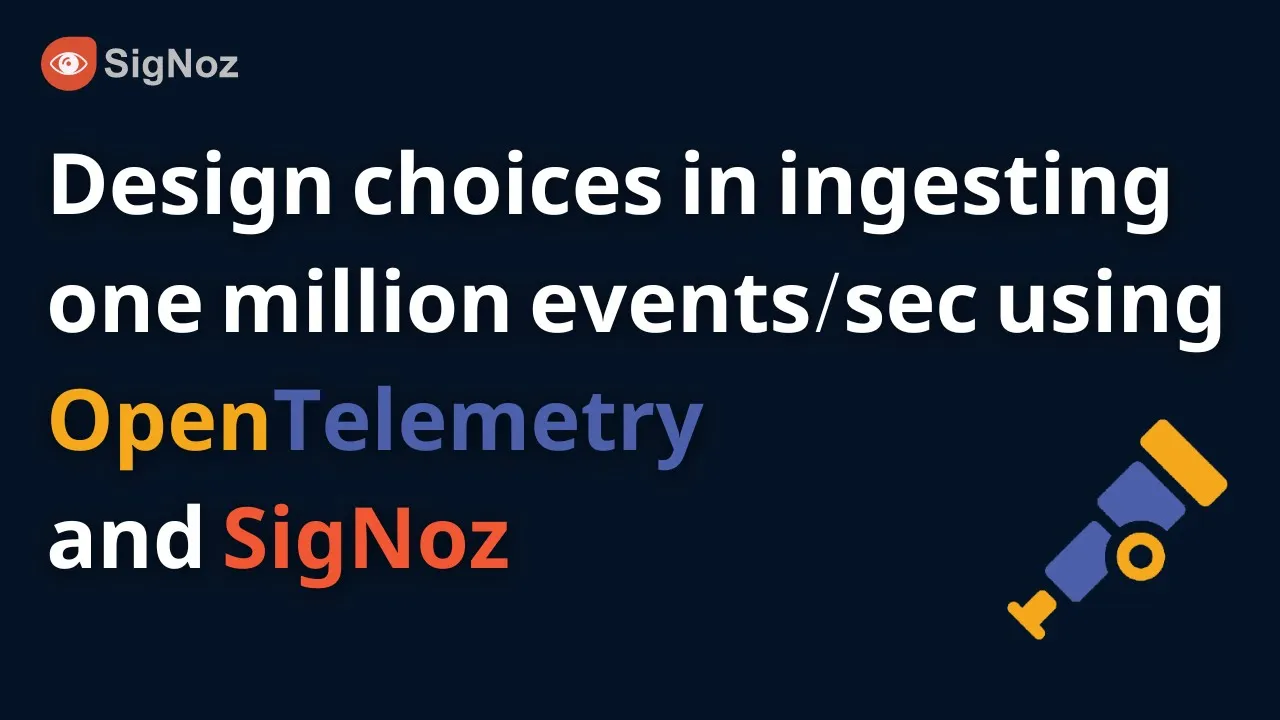
We participated in Kubernetes Community Days Bengaluru, where Pranay talked about design choices in ingesting 1 million events using OpenTelemetry and SigNoz.
Participating in GitHub Constellation India
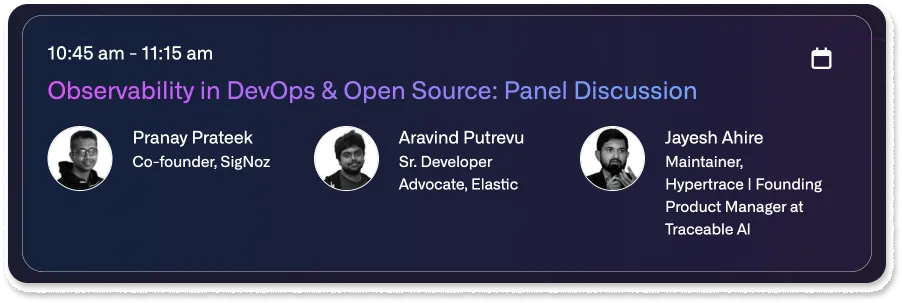
We’re excited to share that Pranay will be speaking in a panel discussion about observability in DevOps and open source at GitHub Constellation India on May 18.
GitHub constellation India is an exclusive event on how code is empowering India, and we are thrilled to participate in the event as speakers.
You can add the event to your calendar by visiting this link. We’re under the DevOps track.
900+ members in Slack Community
We are now 900+ members strong on Slack, a place where we discuss things around open-source, observability, and APM.
If you’re a developer interested in open-source software, observability, and APM then we would love to host you there.
From our blog
Gin is an HTTP web framework written in Go (Golang). It features a Martini-like API with much better performance -- up to 40 times faster.
You can use OpenTelemetry to set up observability for your Gin-based applications. In this blog, you can learn how to instrument Gin-based applications with OpenTelemetry and visualize the data in SigNoz 👇
Implementing OpenTelemetry in a Gin application
Thank you for taking out the time to read this issue :) If you have any feedback or want any changes to the format, please create an issue.

