Top 9 AWS CloudWatch Alternatives For Centralized Monitoring
Amazon CloudWatch is a monitoring and observability service provided by Amazon Web Services (AWS). It allows you to collect, monitor, and analyze data from various AWS resources, applications, and services in real-time.
CloudWatch is a good tool for monitoring AWS, but it gives you limited visibility. You also need a centralized monitoring tool if you’re monitoring things outside of AWS. In this article, we will go through top CloudWatch alternatives that you can use.
CloudWatch provides insights into the operational status, health, and performance of your AWS infrastructure and applications. However, once your application grows, you need a dedicated observability tool to understand performance issues in your application.
Top CloudWatch Alternatives
Below are some of the top CloudWatch alternatives:
SigNoz (Open Source)
SigNoz is a great CloudWatch alternative to take observability and performance monitoring of your applications to the next level. It provides logs, metrics, and traces under a single pane of glass, along with easy-to-use alerting.
SigNoz leverages the power of ClickHouse, a columnar database known for its exceptional efficiency in processing and storing log data. This makes it an ideal choice for robust log management and analysis.
SigNoz also provides both metrics monitoring and distributed tracing. You can correlate application metrics and traces easily with a single click. For example, if your application is having high latency, you can dig into traces at that particular timestamp to understand performance bottlenecks.
You can also create custom dashboards for monitoring your infrastructure.
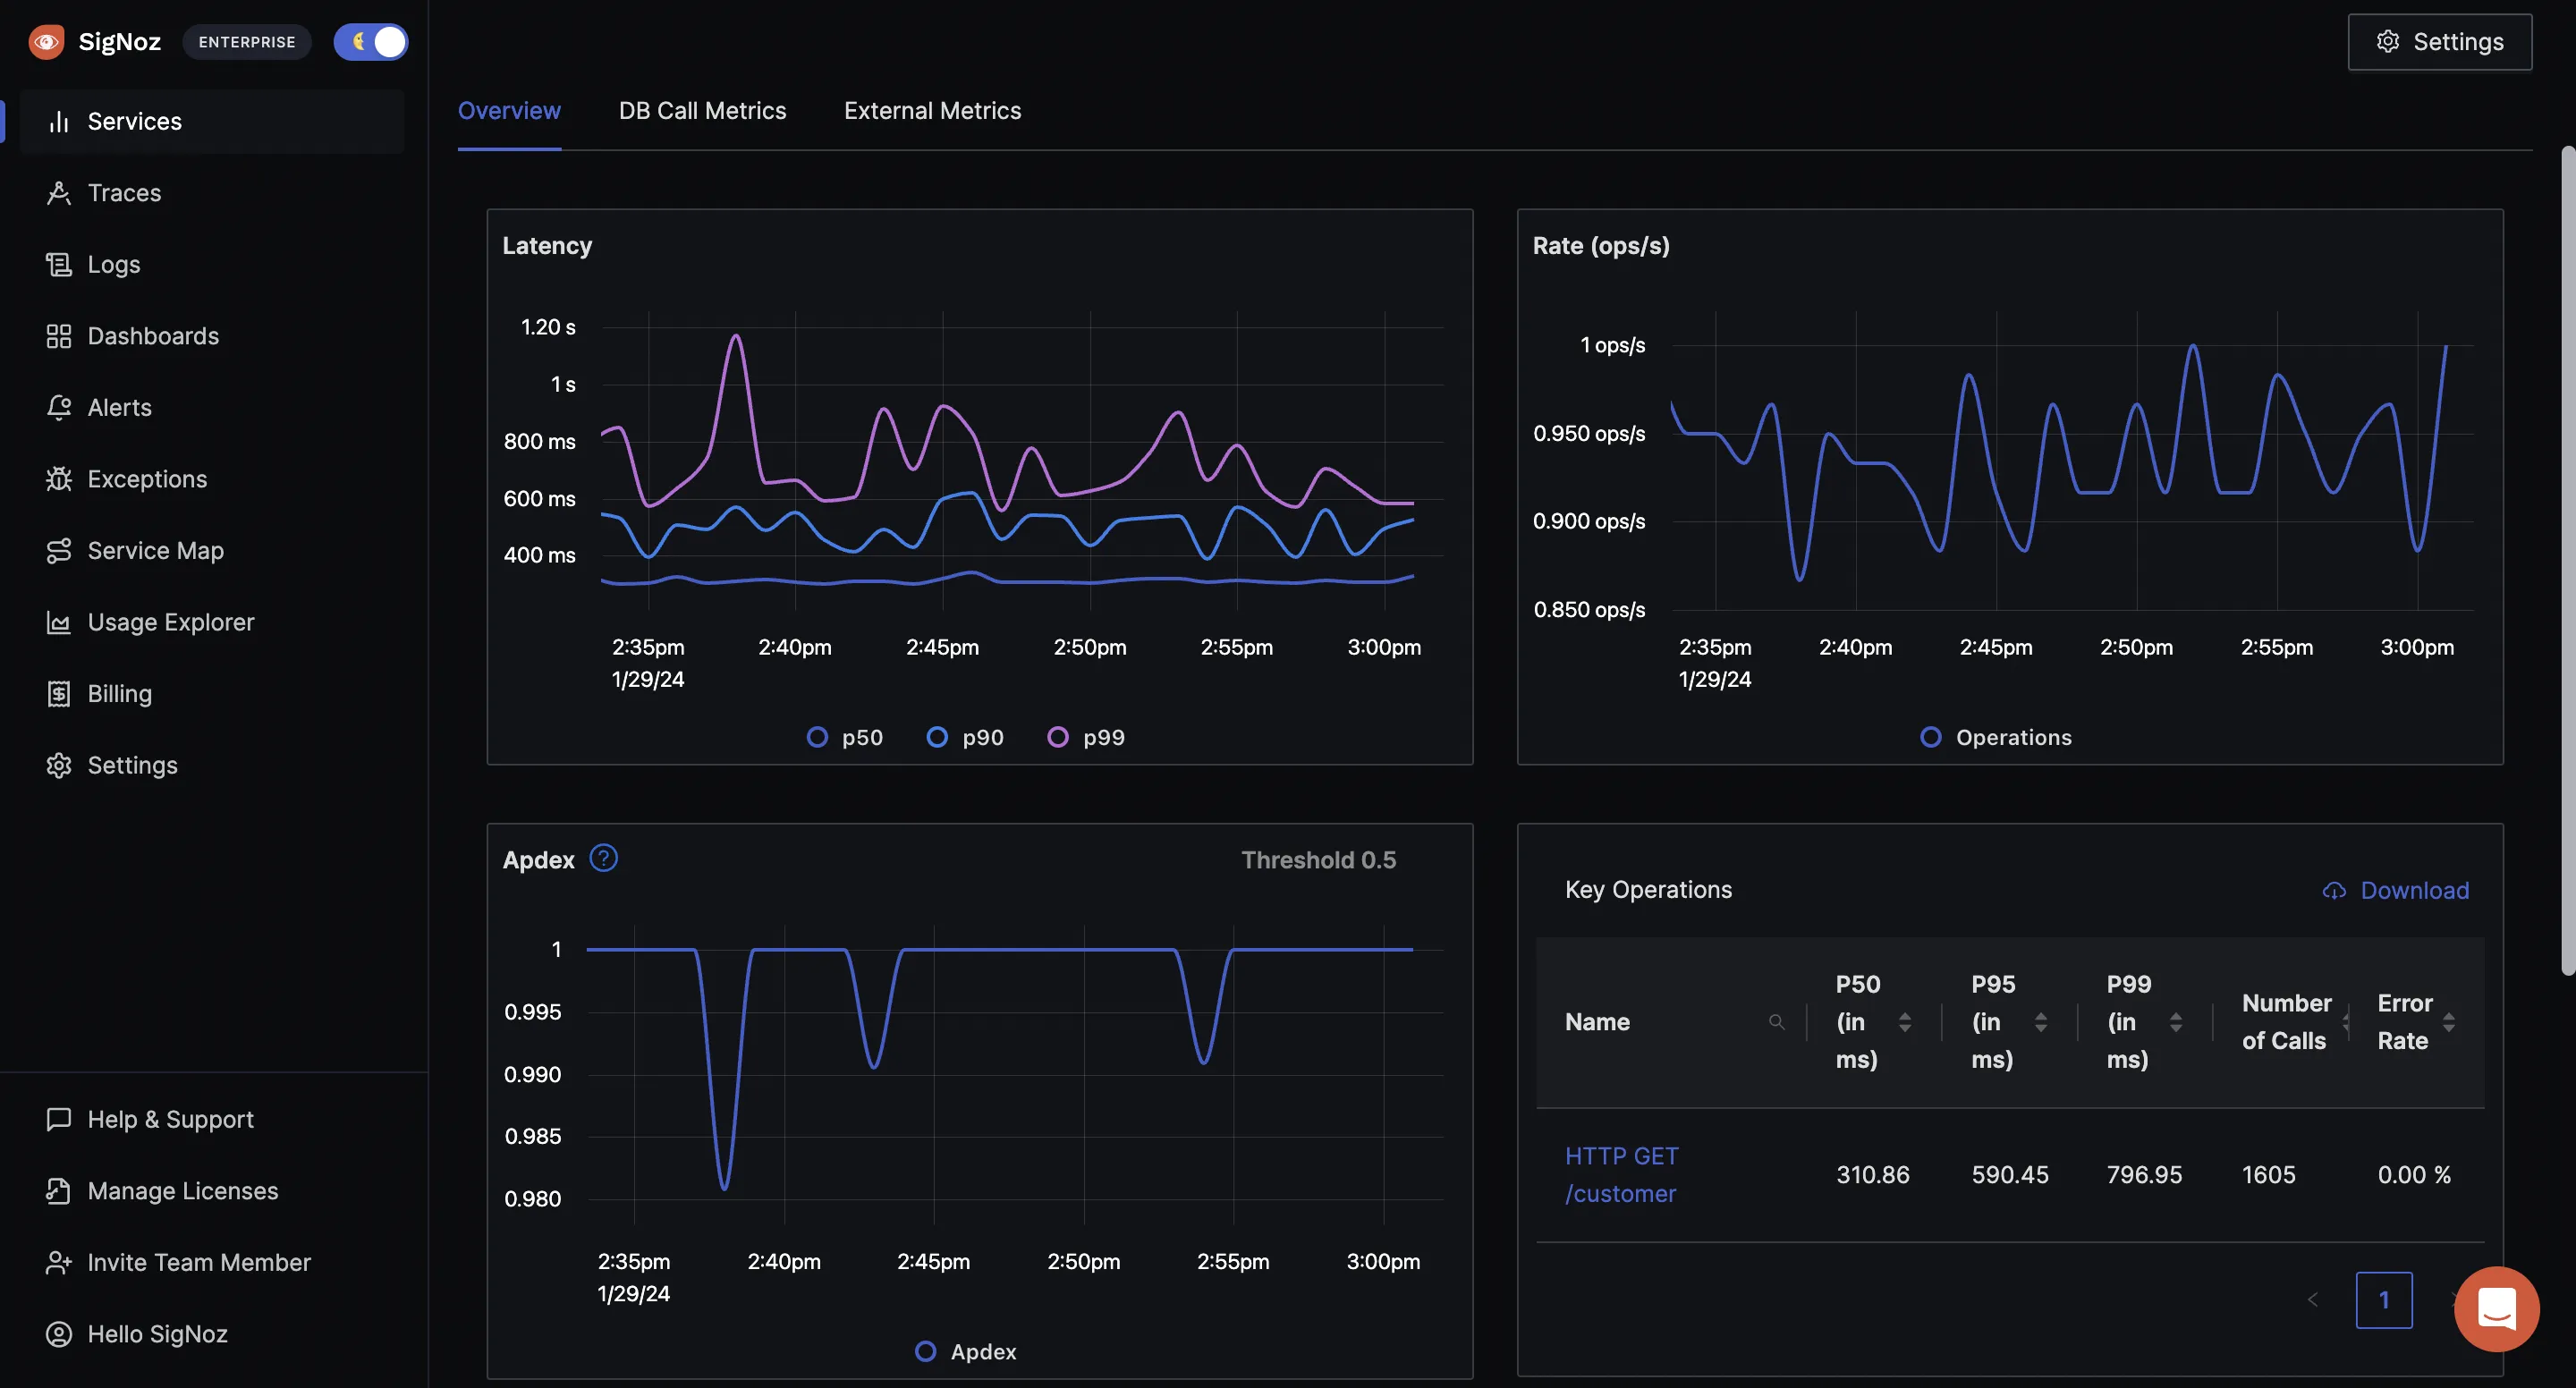
SigNoz also provides detailed views of tracing data in the form of Flamegraphs and Gantt charts. Gantt charts make it easy to visualize your services and events in a parent-child relationship tree. You can easily figure out which events are causing latency in a request call. All of this comes out of the box with SigNoz.

Prometheus
Prometheus is an open-source monitoring tool that collects and stores metrics data in a time series database. It operates on a pull-based architecture, actively gathering time-series metrics from monitored services, ensuring real-time access to critical information.Prometheus achieves this by scraping metrics data from HTTP endpoints and subsequently pushing it into a database designed with a multidimensional model, allowing for thorough contextual monitoring. This model is backed by a powerful query language, PromQL, enabling dynamic querying and aggregation of the collected metrics.
Additionally, Prometheus offers robust built-in alerting capabilities, service discovery mechanisms, and seamless integration with visualization tools like Grafana, providing a comprehensive and powerful monitoring solution.
Grafana
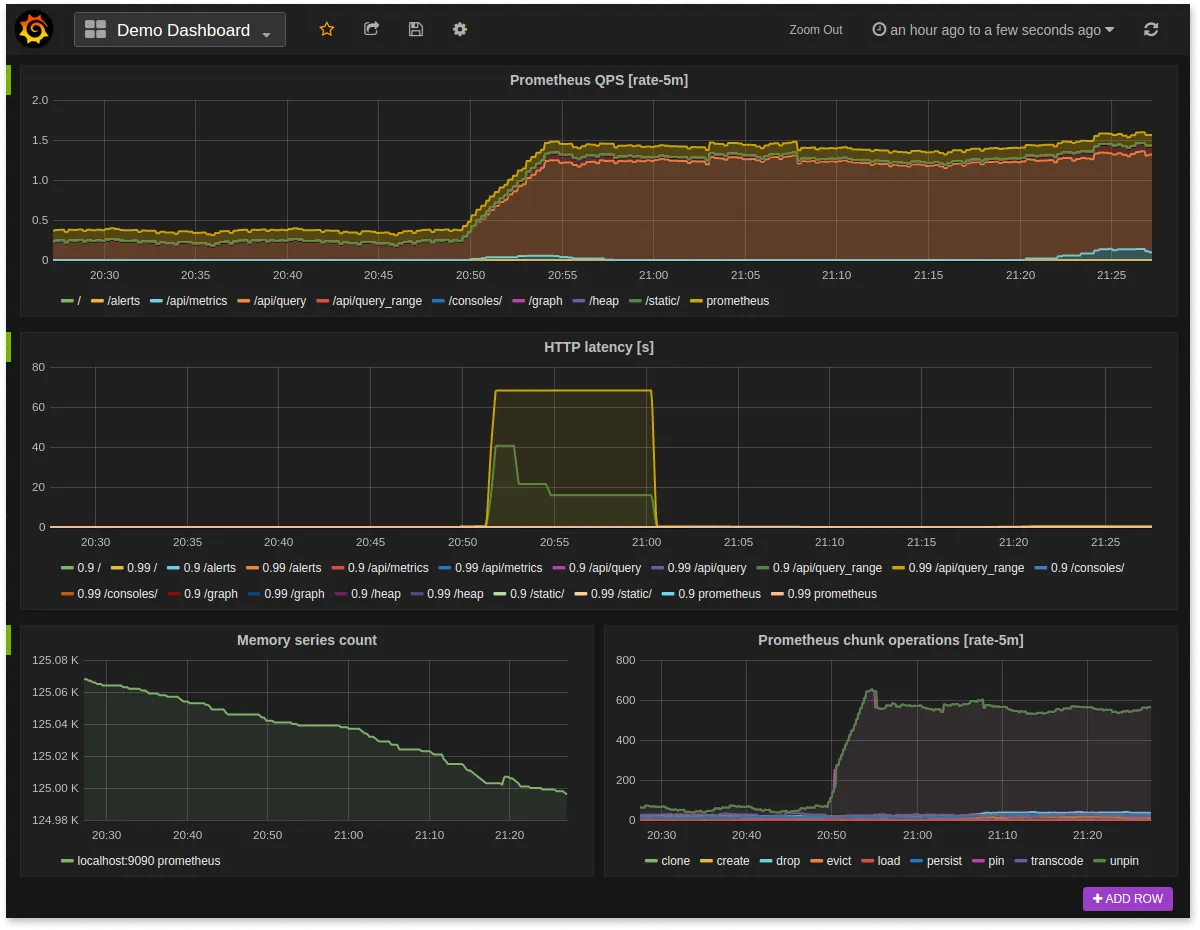
Grafana is an open-source dashboard tool. The biggest feature of Grafana is that you can use it to combine different data sources and then visualize data in a central dashboard. It also comes with admin features for effective collaboration with the team.
Some of the key features of Grafana are:
Flexible dashboards
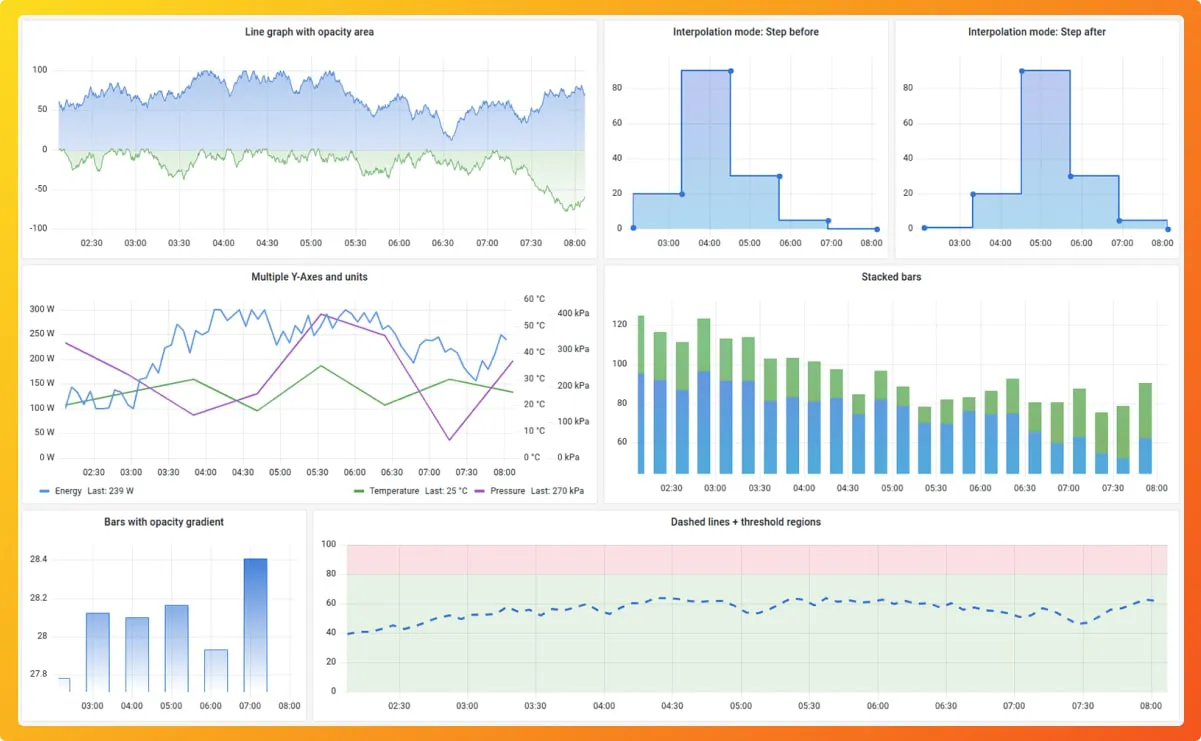
Grafana provides a lot of panels that can be used for building dashboards. To build dashboards that suit your needs, you can choose from multiple chart types like heatmaps, histograms, pie charts, etc.Plugins
Grafana provides an extensive set of plugins to extend Grafana capabilities. Some of the plugins that Grafana offers are:- Data Source plugins
- App plugins
- Panel Plugins
Alerting system
Grafana provides a central UI to set and manage alerts with a central UI.
Datadog
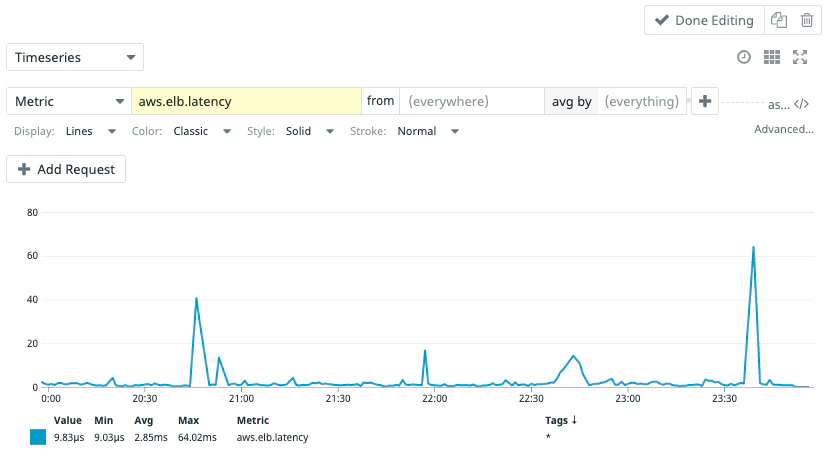
Datadog is a cloud-based monitoring and analytics platform known for its capabilities in collecting and analyzing metrics, traces, and logs from a diverse range of services, applications, and cloud providers.Datadog’s strength lies in delivering unified visibility across an organization's entire technological stack, empowering teams with profound insights and efficient troubleshooting. It supports real-time monitoring, advanced alerting, and customizable dashboards, making it particularly favored among DevOps teams and businesses operating in cloud-native environments.
It seamlessly integrates with various tools and services, ensuring a smooth incorporation into existing workflows. It also has a suite of products encompassing log management, infrastructure monitoring, APM, and security monitoring, catering to the diverse needs of organizations.
New Relic
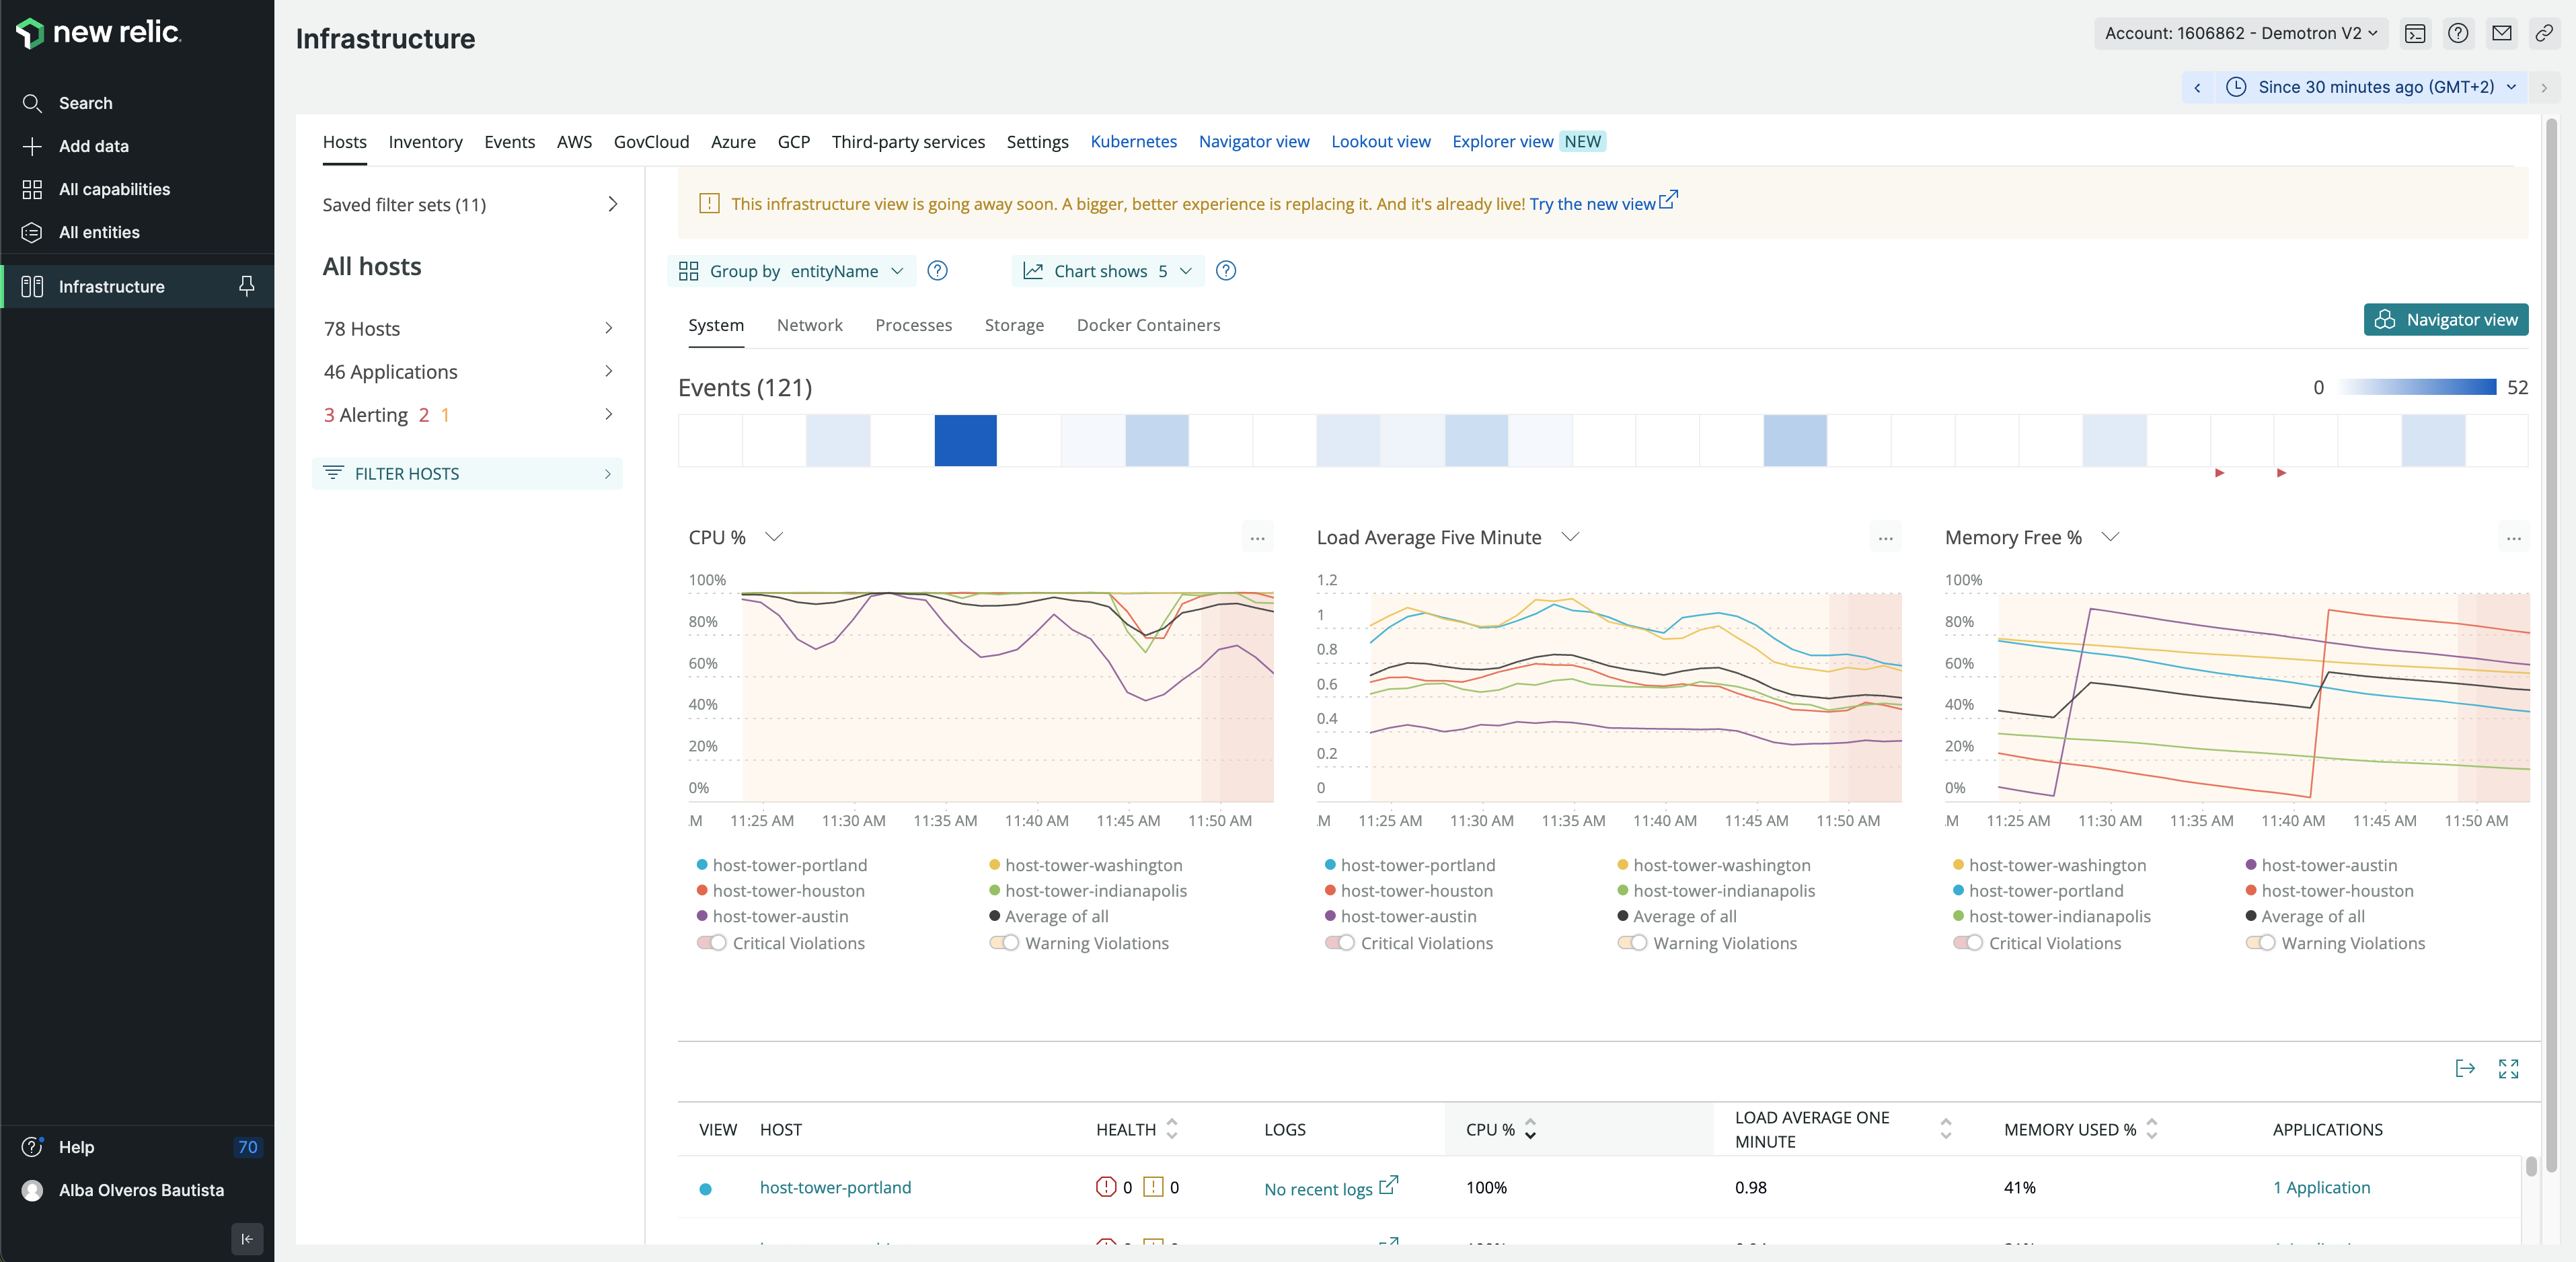
New Relic is an observability platform widely known for its comprehensive monitoring and performance management capabilities. It specializes in providing end-to-end visibility into the performance of applications, infrastructure, and user experiences.New Relic brings all your data together through its agents, integrations, and APIs, allowing for comprehensive data collection across your technology stacks. This data is then accessible through a unified user interface. Users can easily analyze this data to identify the root causes of problems and optimize their systems, whether by creating dashboards and charts or by using New Relic's powerful query language.
Dynatrace
Dynatrace is an AI-powered observability observability platform that specializes in delivering comprehensive visibility into application performance, infrastructure, and user experience.With AI-driven insights, it automates issue detection and resolution, excelling in cloud-native environments. Dynatrace offers deep insights into performance and user interactions, along with robust support for various technologies. It consolidates observability, security, analytics, and automation solutions in a user-friendly interface.
The platform is adaptable to diverse use cases and is adept at enhancing organizational operations. It ensures consistent system availability and swiftly addresses performance issues.

AppDynamics
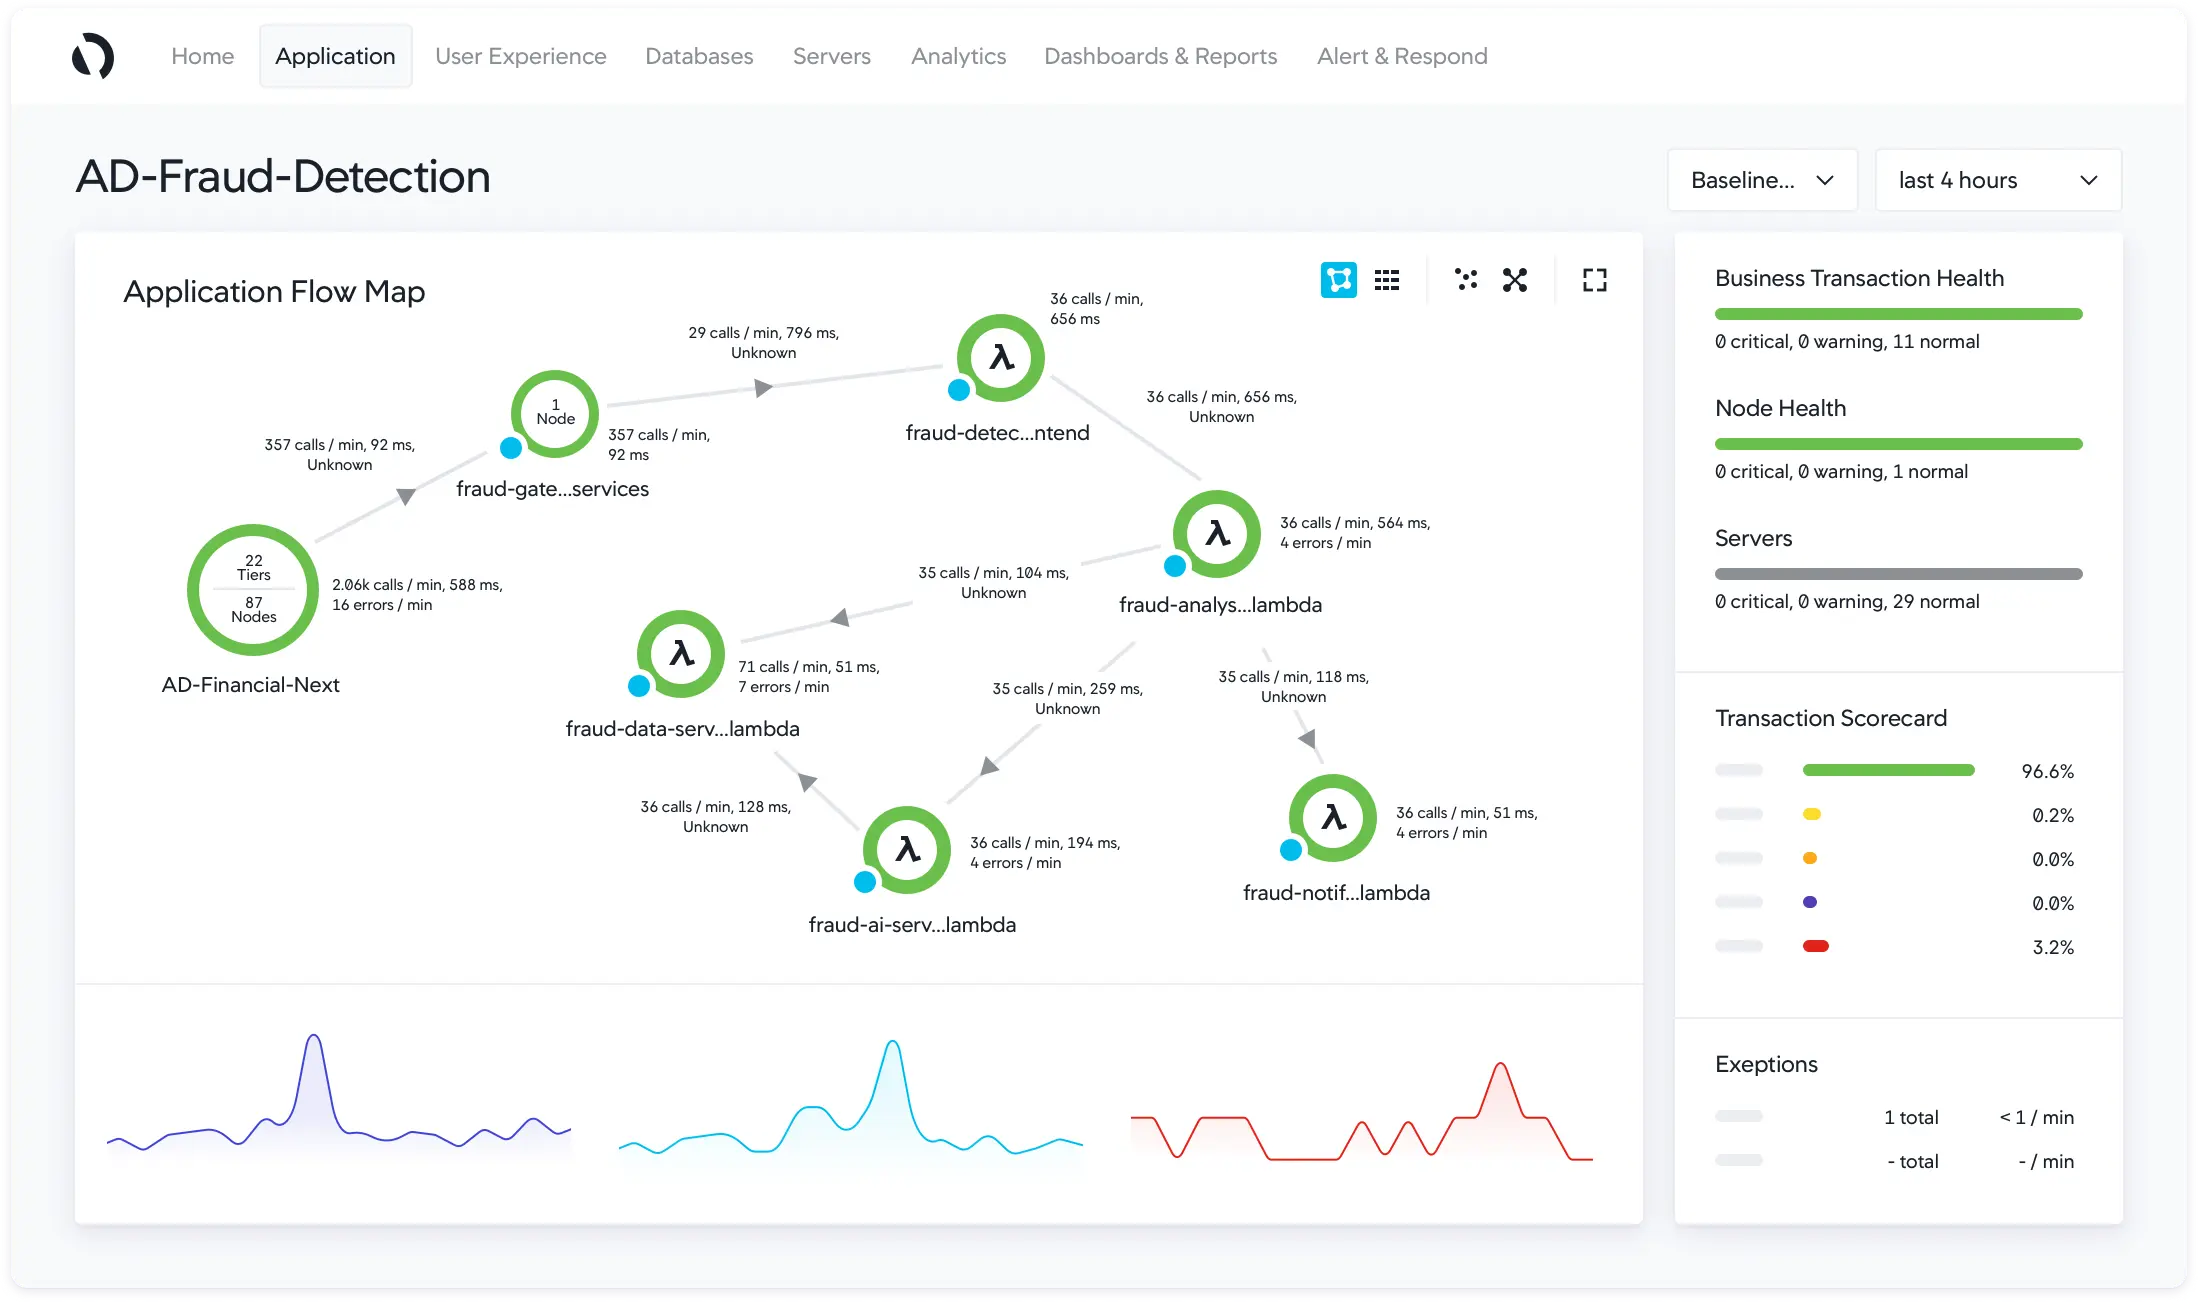
AppDynamics is an enterprise Application Performance Management (APM) solution known for its comprehensive monitoring capabilities. It provides in-depth visibility into application performance and user experiences, offering code-level diagnostics, transaction tracing, and real-time insights.
AppDynamics is compatible with major technologies and can be deployed on-premise or as a Software-as-a-Service (SaaS) solution. It operates by installing an Agent in the application to collect performance metrics, which are then processed and presented via a web interface.
The platform stands out for its clean and modern UI, featuring heat maps for a clearer overview of metrics.
Sematext
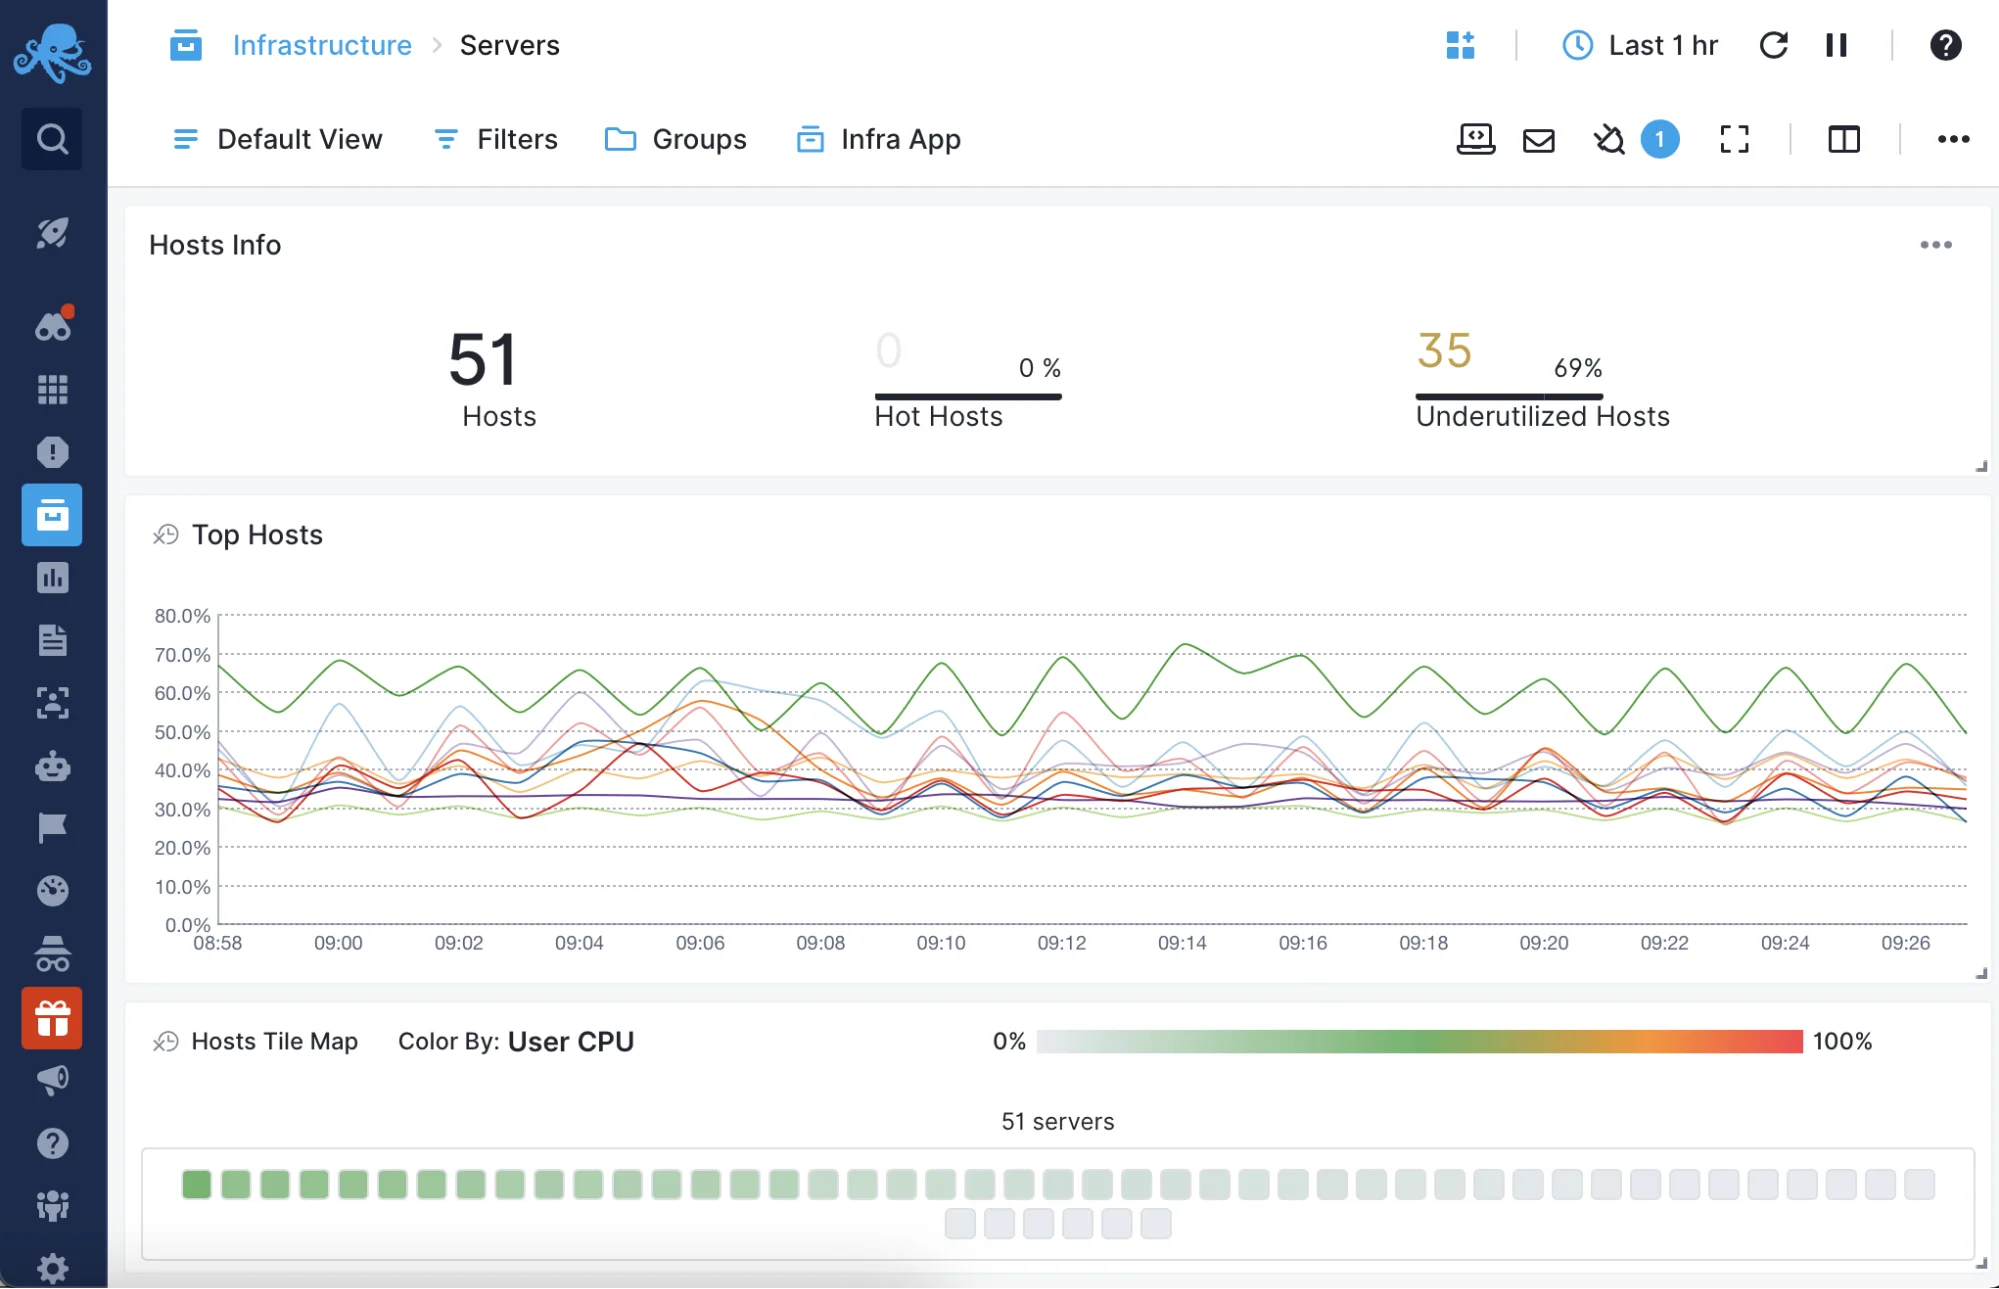
Sematext is a comprehensive observability and log management solution that provides a holistic view of applications and infrastructure performance.It can gather and assess logs and metrics from diverse sources, presenting a unified outlook on system well-being. Sematext also provides functionalities such as anomaly identification, customizable dashboards, and robust alerting systems. With its cloud-native design and compatibility with diverse technologies, it is well-suited for a broad spectrum of environments.
LogicMonitor
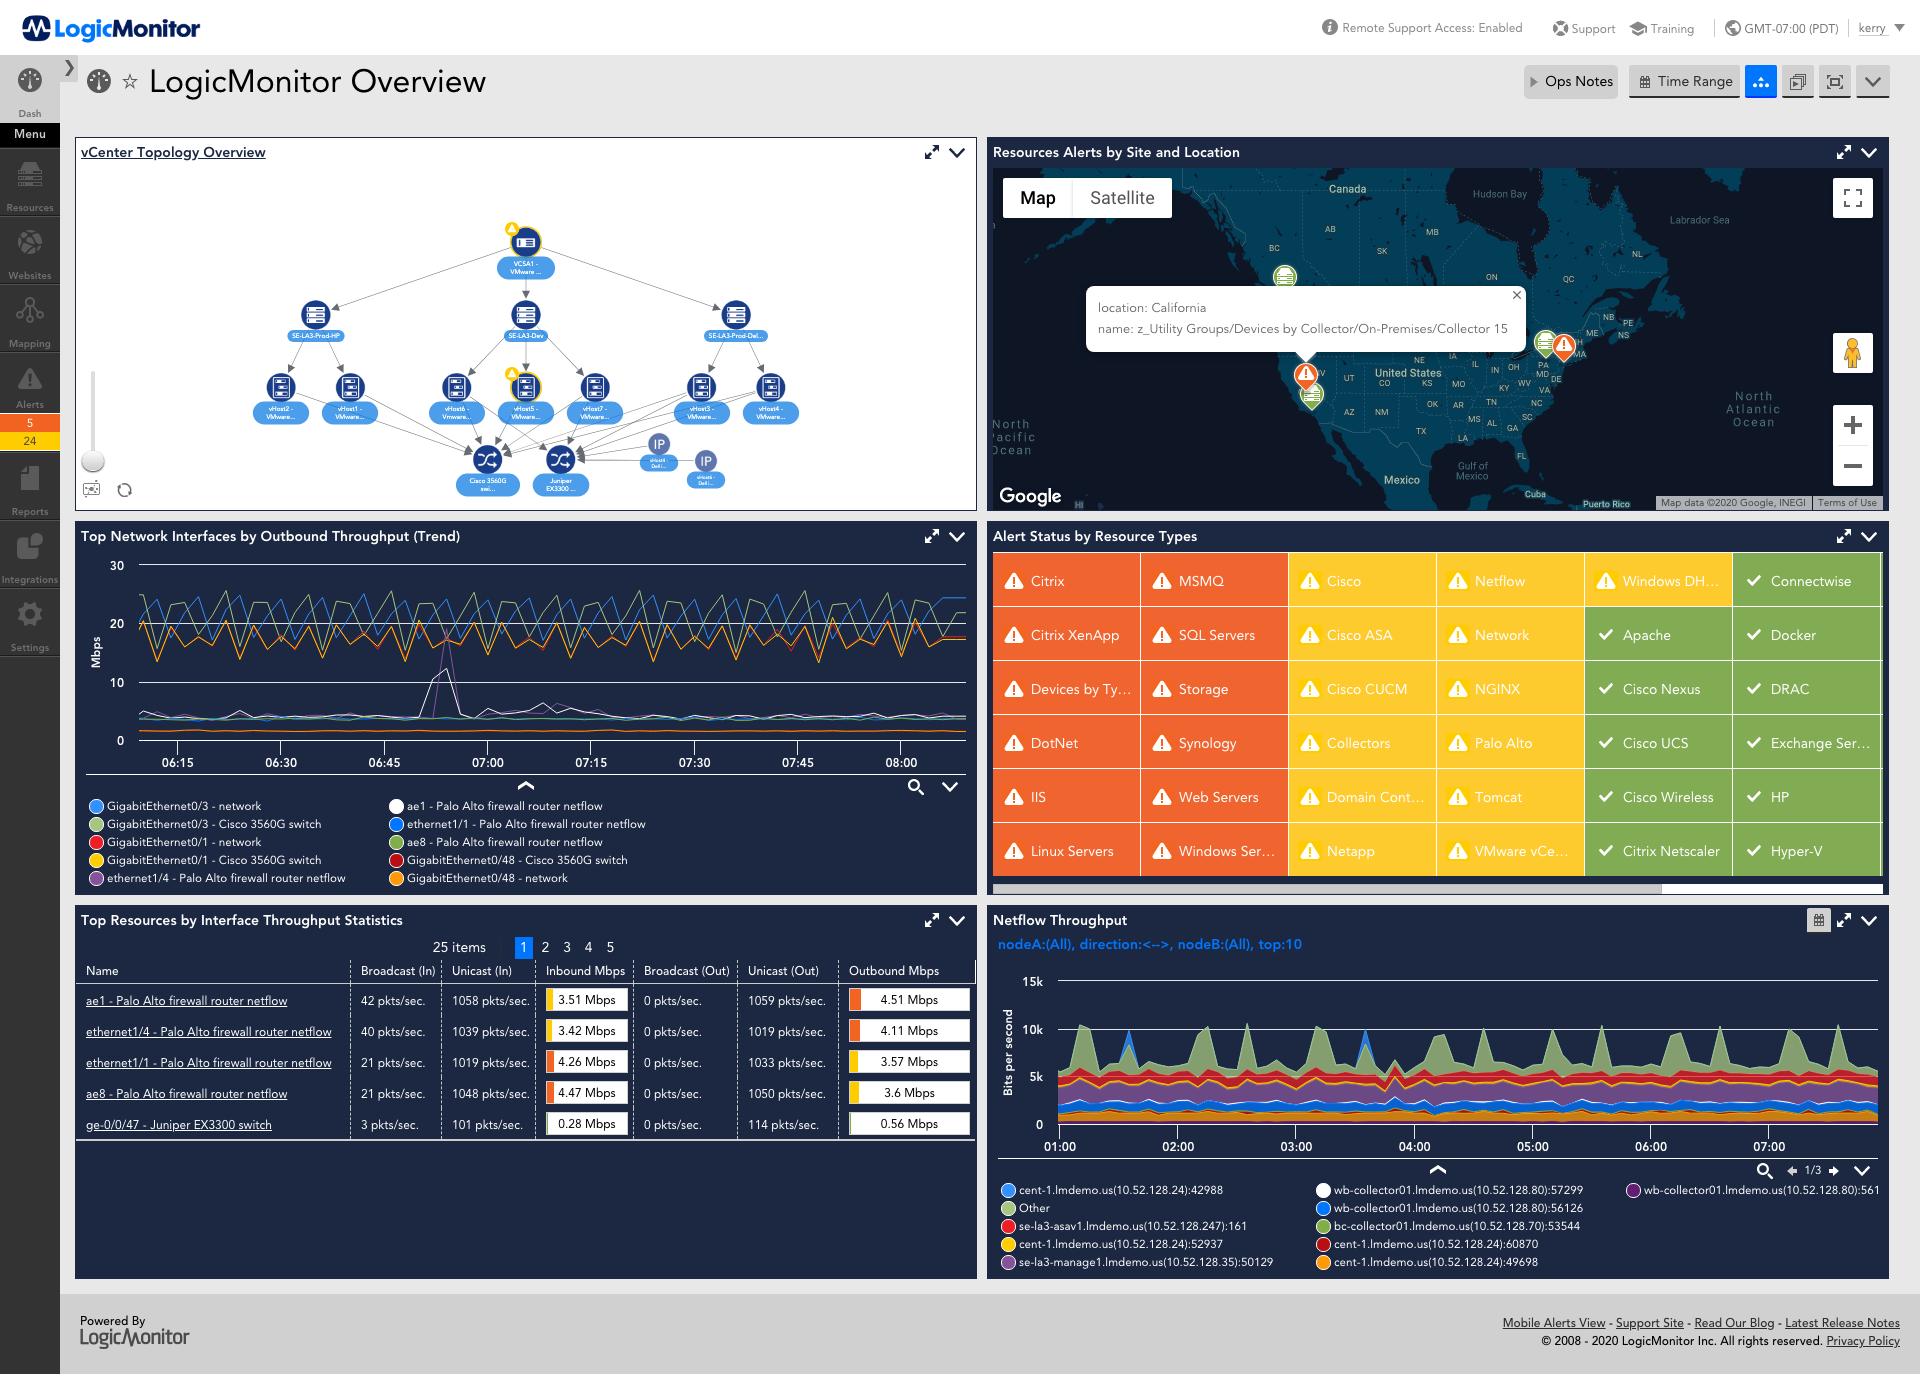
LogicMonitor is a full-stack monitoring platform known for its extensive observability capabilities. It offers complete visibility into the performance of applications, infrastructure, and cloud environments.The platform offers a wide range of pre-configured integrations, making it easy to monitor various technologies and platforms. It provides real-time insights, customizable dashboards, and advanced alerting features for quick issue resolution. It also includes tools like anomaly detection and forecasting to tackle potential problems proactively.
Why use a centralized monitoring tool instead of CloudWatch?
CloudWatch is a good monitoring solution while starting out in AWS. But as your application grows, you need a robust monitoring tool that gives more visibility into your application performance. A few things you should consider while selecting a monitoring tool to move out of CloudWatch:
Multi-cloud capabilities
The CloudWatch alternative you choose should be able to monitor services in multi-cloud architecture. It should be a centralized monitoring system that can handle monitoring all components in your tech stack whether it’s a part of AWS or not.Metrics, logs, and traces
Using a single tool for all your monitoring needs helps consolidate the engineering bandwidth you spend on monitoring. Using a single tool for logs, metrics, and traces also helps to correlate different signals for better insights.Ease of shifting out
You should use a tool that is easy to get started with. A tool that helps in getting CloudWatch metrics easily will make the process of shifting out easier.Pricing
Monitoring data is huge, and different vendors bill differently. A tool like Datadog can get costly very soon. You should choose a tool that provides good value for your money.
SigNoz is a great CloudWatch alternative that provides logs, metrics and traces under a single pane of glass. It comes with great out-of-the-box charts for application metrics, database calls, apdex, and much more. The log management in SigNoz is also highly scalable, with an advanced query builder to search and filter logs quickly.
Getting started with SigNoz
SigNoz cloud is the easiest way to run SigNoz. Sign up for a free account and get 30 days of unlimited access to all features.
You can also install and self-host SigNoz yourself since it is open-source. With 16,000+ GitHub stars, open-source SigNoz is loved by developers. Find the instructions to self-host SigNoz.
Related Posts


