Latest top 17 API monitoring tools [open-source included]
Choosing the right API monitoring tool is critical. How do you know which is the right API monitoring tool for you? Here are the top 17 API monitoring tools, including open source tools for API performance monitoring.
In this article, we will review the top 17 API monitoring tools which you can use for monitoring your APIs. But first, let’s have a brief overview of APIs.
What is an API?
An API (stands for Application Programming Interface) allows your product or service to talk to other products or services. Basically, an API specifies how software components should interact. In this way, they allow you to open up data and functionality to other developers and to other businesses.
APIs communicate through a set of rules that define how computers, applications, or machines can talk to each other. They act as a middleman between any two machines that want to connect with each other for a specified task.
What is API Monitoring?
API monitoring is a way of continuously keeping track of the state of the APIs. In other words, API monitoring is a process of continuously checking the health, performance, metrics, logs, etc., of the APIs across all the services that run across the application.
Key API Metrics to Monitor
You have to keep track of some of the key API metrics in order to successfully run your services with high performance and low error rates.
Some of the Key API Metrics are:
API Uptime: Uptime is the continuous availability of an API, in order words, making sure the API is fully-functional without any outages.
Requests Per Minute: Requests per minute is a performance metric that measures the number of requests the API will handle per minute.
CPU Usage: Keeping track of the CPU is one of the important aspects of performance because high CPU usage can mean the server is overloaded, which can cause a severe bottleneck.
Latency: Latency or Network Latency is the time it takes for data or a request to go from one system to another system. It can be either between client & server or server & server(in the case of distributed services).
Memory Usage: Memory usage helps you understand the amount of resource utilization; a high memory usage can be an indicator of servers overloaded.
Time To First Hello World: TTFHW is the time the user needs to make his first API transaction from the web page.
Errors Per Minute: Errors per Minute (or error rate) is the number of API calls with failure responses.
Here's the list of the top 17 API monitoring tools we will be looking at in this article:
- SigNoz - open source
- Prometheus - open source
- Graphite - open source
- Datadog
- New Relic
- Sauce Labs
- SmartBear(AlertSite)
- Moesif
- AppDynamics
- Sematext
- RapidAPI
- AWS Cloudwatch
- Postman
- Assertible
- APIMetrics
- API Science
- Atatus
SigNoz (Open Source)
SigNoz is a full-stack open source APM that can be used for effective API monitoring. It is built to support OpenTelemetry natively. OpenTelemetry is an open source project under Cloud Native Computing Foundation that is becoming a world standard for instrumenting cloud-native applications.
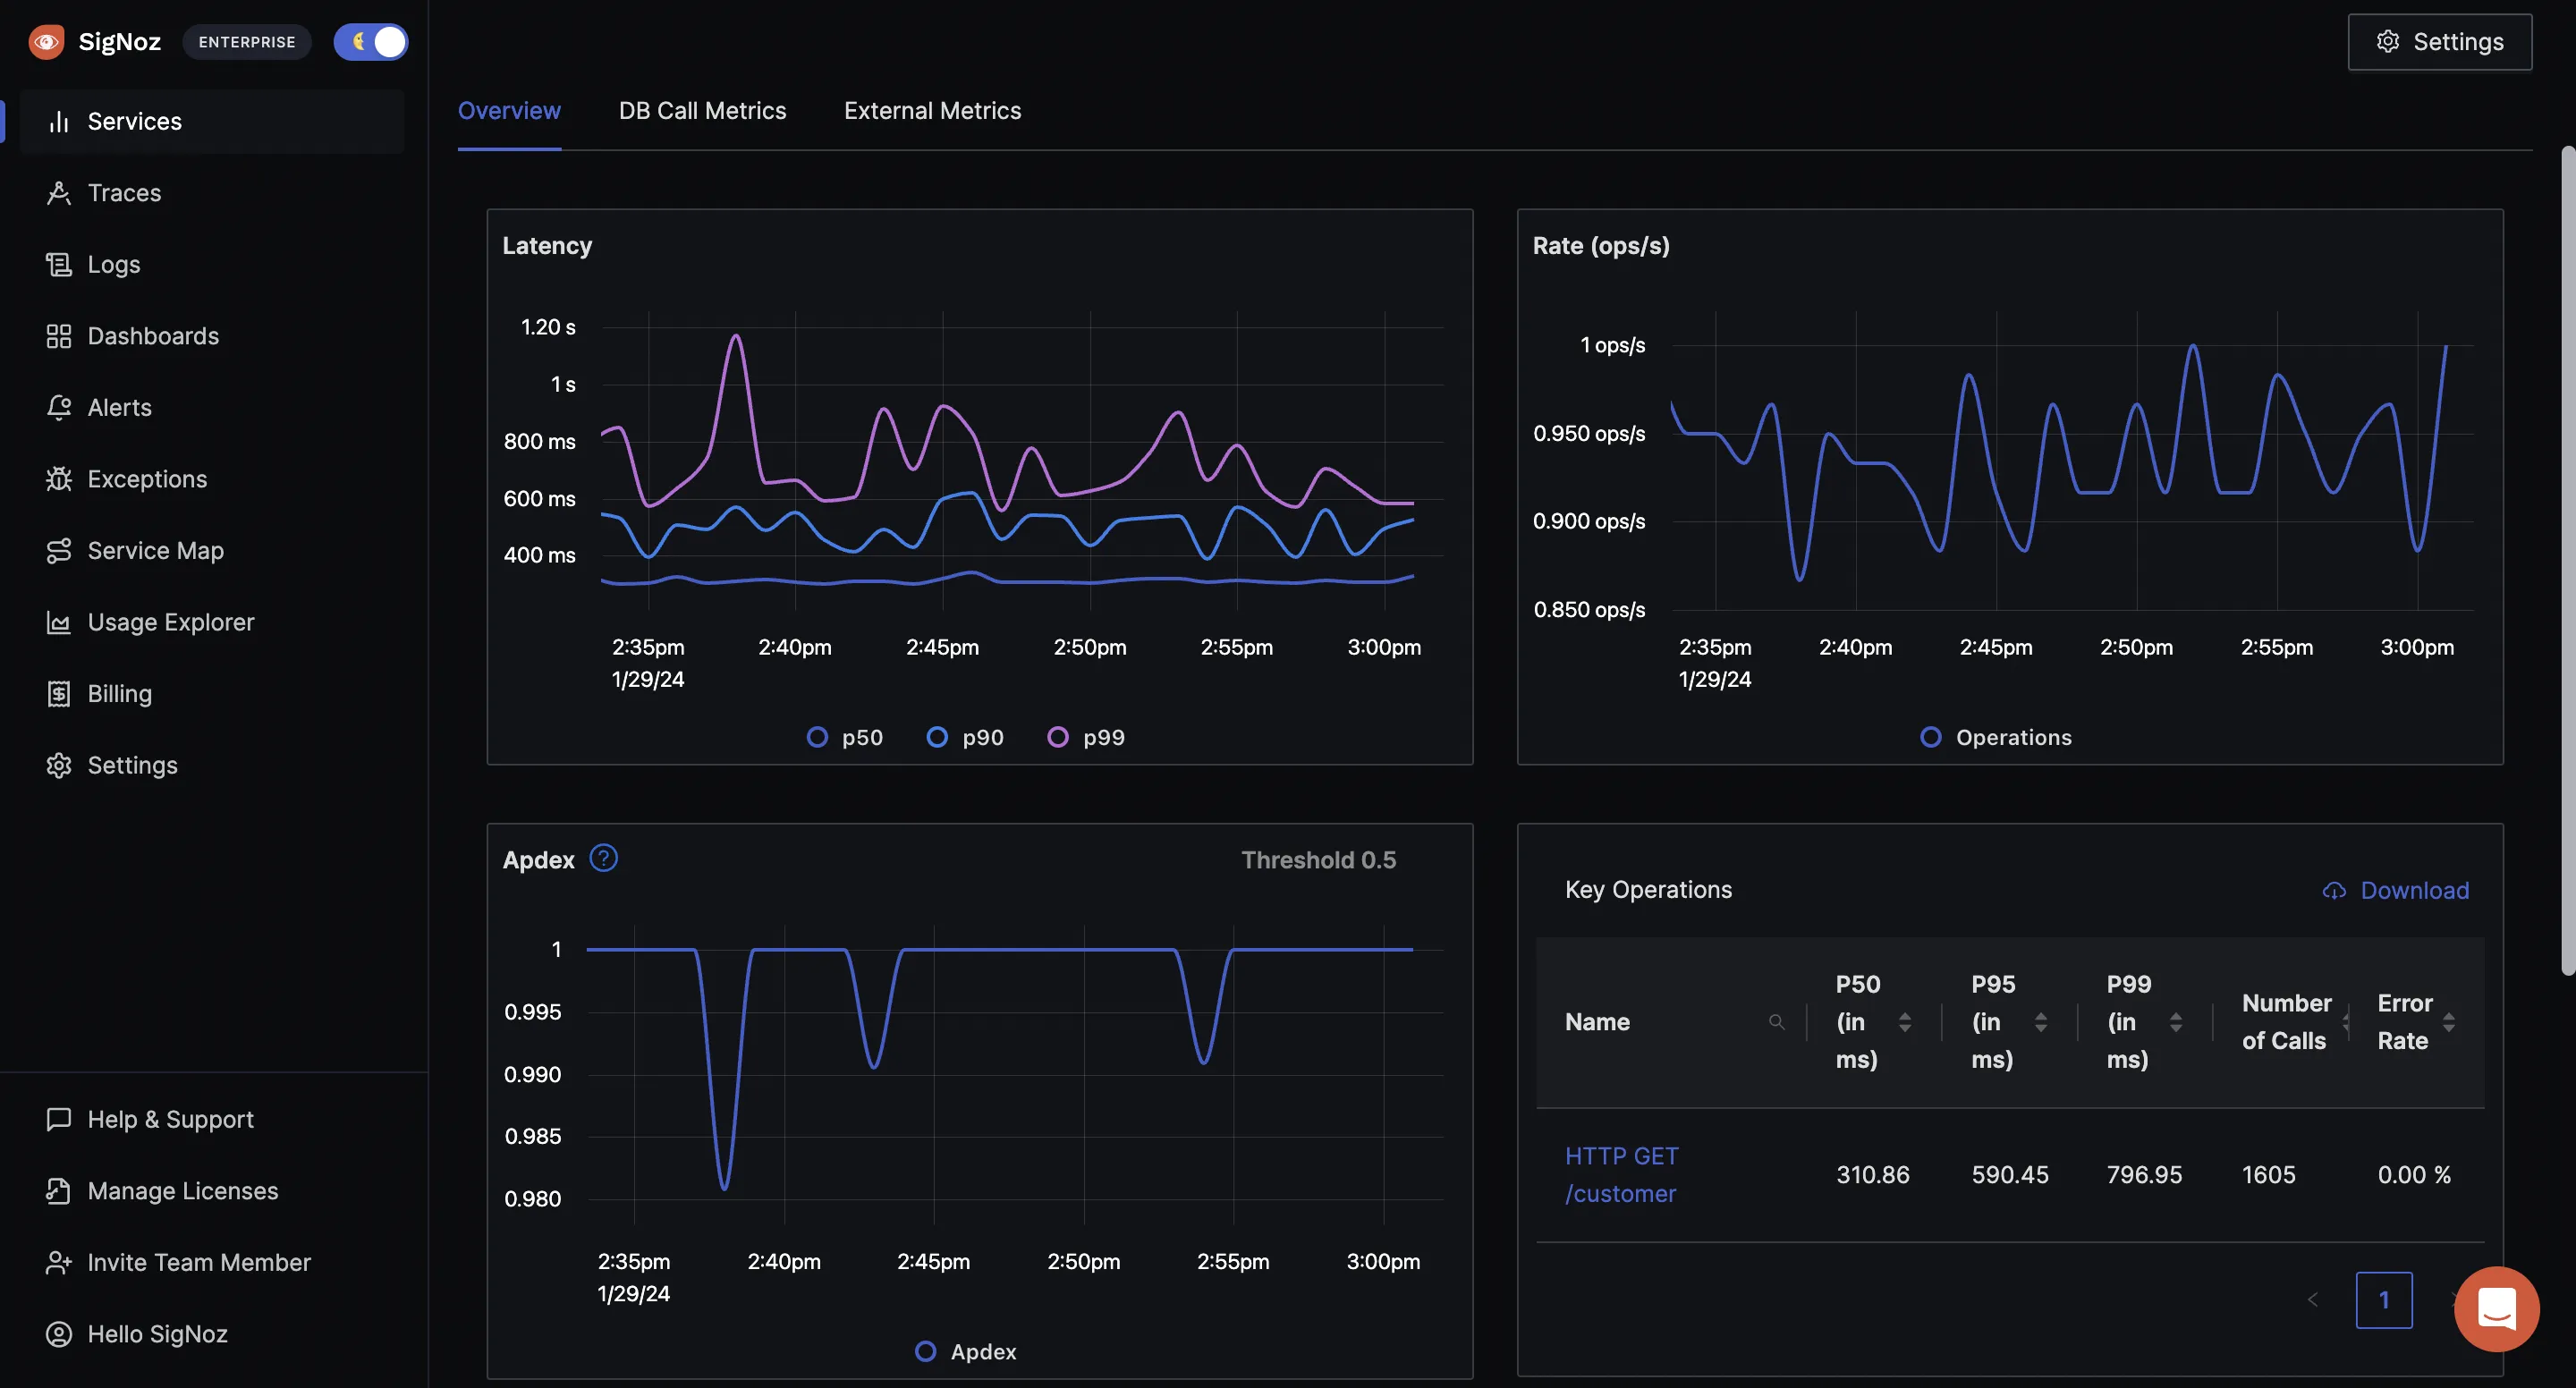
SigNoz can be used to monitor metrics for API performance. It is well-suited to monitor APIs in applications based on microservices or serverless architecture. You can monitor the top endpoints of all your services and get important metrics like P95 and P99 latencies.
Some of the key features of SigNoz include:
- Monitor important application metrics of each service with out-of-box charts and visualization.
- For each service, monitor top endpoints and their key metrics
- Drill down into the performance of each API with tracing data showing all spans processed by the endpoint
- Analyze API calls as part of the whole user request with Flamegraphs and Gantt charts
To see your application performance at a glance, you can use the Metrics tab. The top endpoints of your services will be listed in the Top endpoints table.
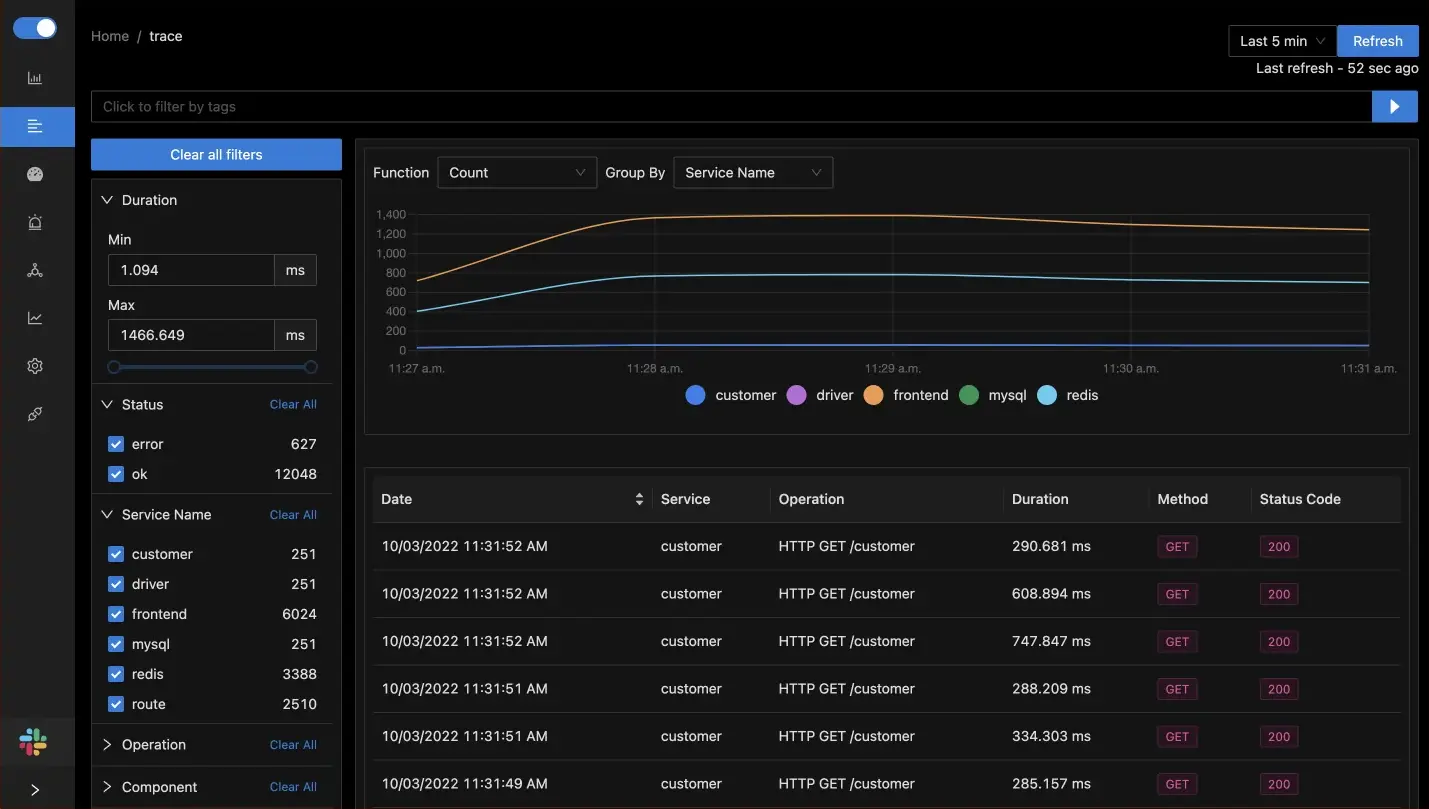
You can then analyze the performance of each request that hits your endpoint with tracing data. The Traces tab provides powerful filters to analyze each event(or span) of that endpoint.
You can also visualize your API calls as part of the whole user request using Flamegraphs and Gantt charts.

Prometheus (Open Source)
Prometheus is an open source metrics monitoring tool. It was initially developed at SoundCloud in 2012 before being released as an open-source project. It got accepted into the CloudNative Computing Foundation in 2016 and was the second project to graduate from the foundation, following Kubernetes.You can use Prometheus to monitor your REST APIs. Prometheus is a good tool for monitoring any kind of time-series data. By time-series data, we mean metrics that change over time. For example, requests per second on an endpoint.
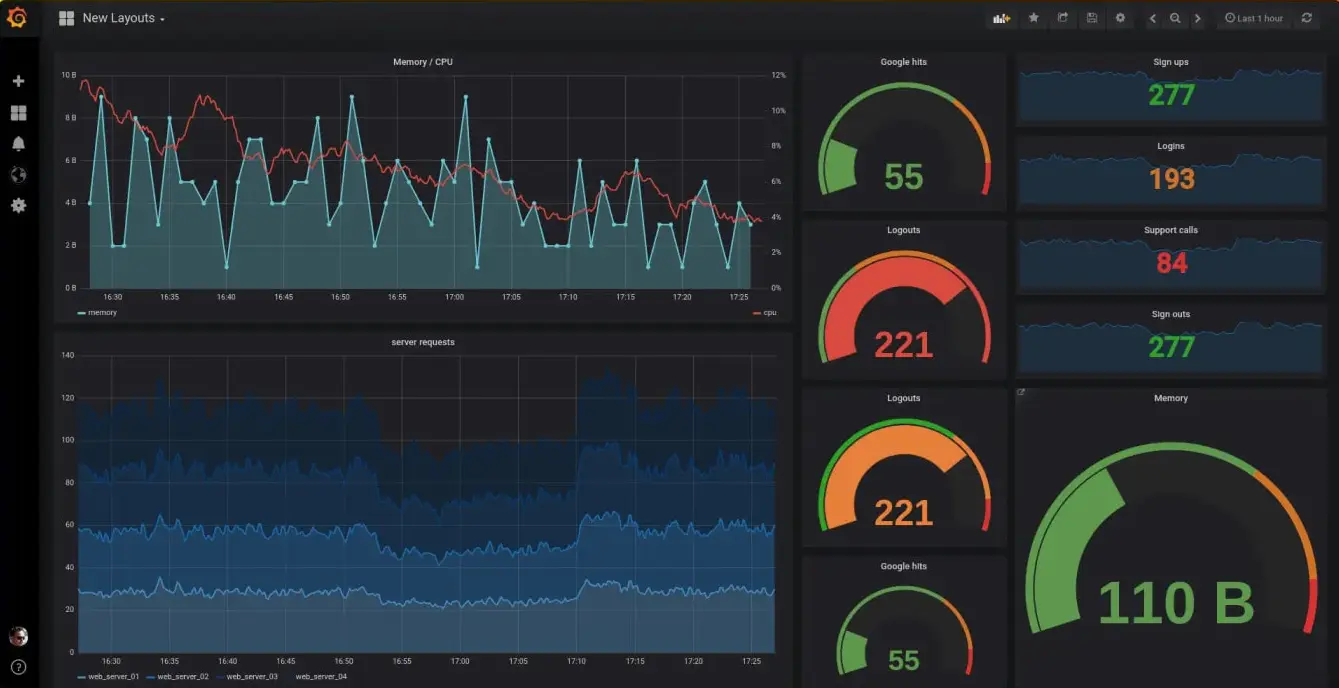
Prometheus provides a very basic visualization layer, and it is usually combined with Grafana to create better visualization. It also provides an alertmanager to create alerts on critical metrics.
Graphite (Open Source)
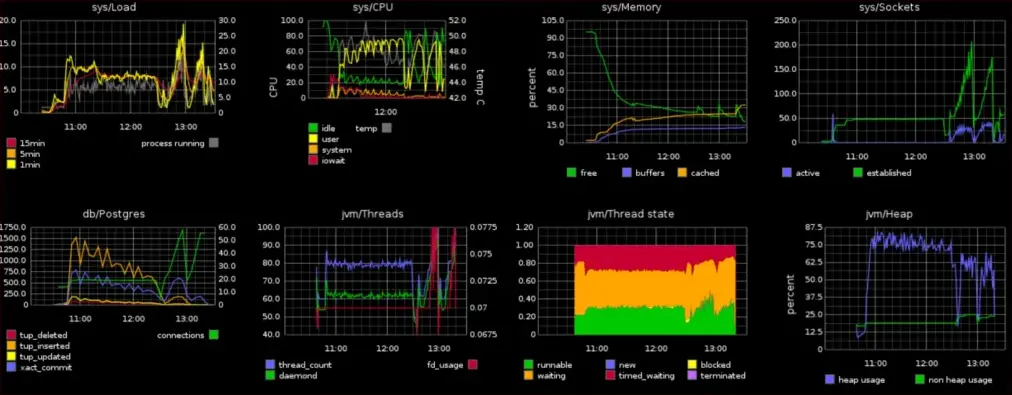
Graphite is an open-source monitoring tool focused on storing time-series data. It has three main components: Carbon, Whisper, and Graphite. Carbon listens for time-series data. Whisper is used for storing the time-series data, and Graphite web is used to render graphs.Graphite’s UI is not that great, and they provide integration with Grafana to build better charts for visualization.
The primary purpose of Graphite is to store numeric time-series data and render graphs of this data. Time-series data is a sequence of data points for a particular metric indexed over time. It can give you insights into the performance of any application, process, or service.
Graphite does not do data collection. Instead, your app needs to be configured to send data to Graphite which passively listens for data using Carbon - a Twisted daemon. Carbon then sends the data to Whisper to store the time-series data on a filesystem.
Just like Prometheus, Graphite can be used to monitor API performance.
Datadog
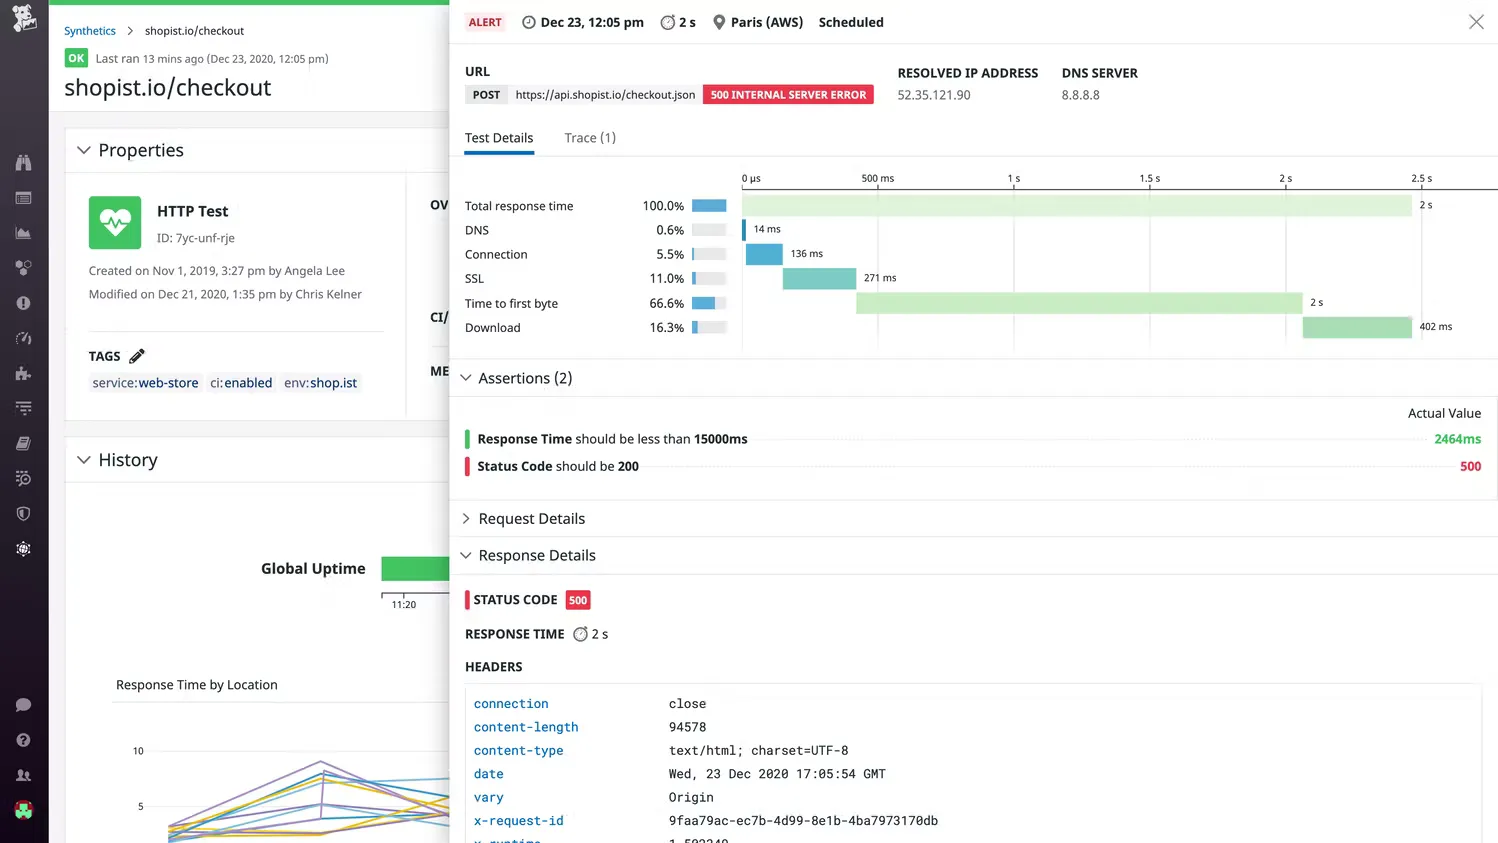
Datadog Synthetic Monitoring allows you to create code-free tests that actively simulate user transactions on your applications and monitor key network endpoints across various layers of your systems. It detects user-facing issues with API and browser tests—and jump-starts system-wide investigations so you can optimize performance and enhance your end-user experience.
Some of the features it provides are:
Monitoring API endpoints with test: It validates all layers of the system (HTTP, SSL, DNS, WebSocket, TCP, UDP, ICMP, and gRPC) from several worldwide locations and provides a complete breakdown of network timing data for faster root cause analysis.
Capturing critical transactions with a code-free, fully hosted web recorder: It monitors key workflows with step-by-step screenshots of the end-user view and waterfall visualizations.
Testing in the CI/CD pipeline: It is used to incorporate Synthetic tests in the CI pipelines for early issue detection and remediation in the production to identify regressions and automate rollbacks.
New Relic
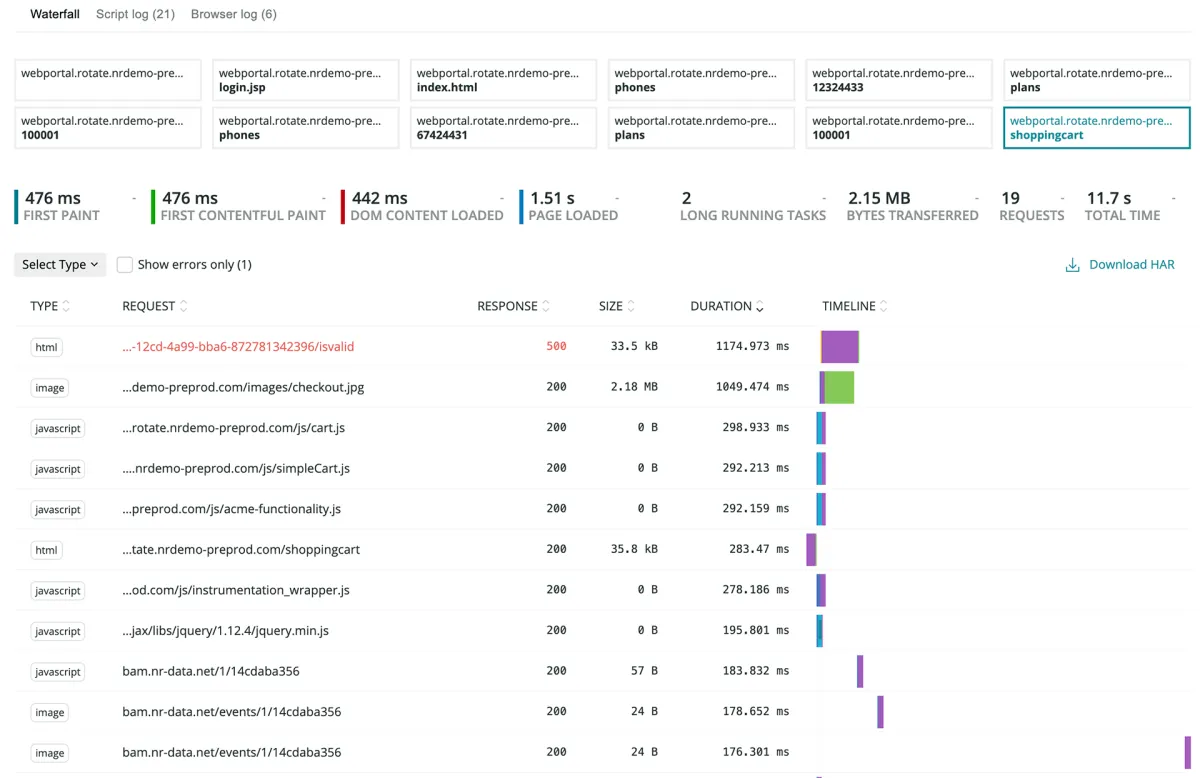
New Relic is an application monitoring enterprise tool that provides a range of solutions from application monitoring and infrastructure monitoring to log management.
Newrelic Synthetics feature improves the quality of builds to ensure availability by simulating the traffic across thousands of public locations and private locations to proactively detect and resolve issues. It also provides alerts on the performance of APIs.
It allows you to troubleshoot the API endpoint failures link to the health of your applications, services, and environments faster and eliminate errors and issues with your code to optimize performance across the application.
Sauce Labs
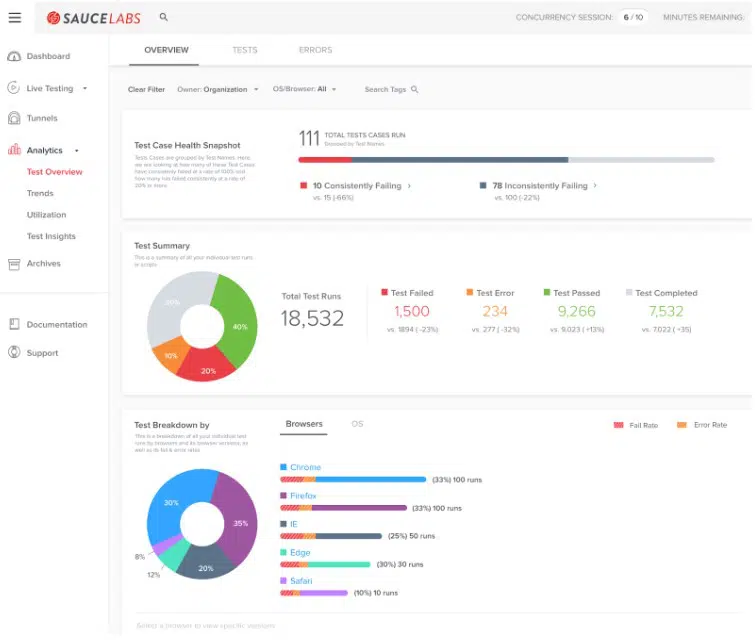
Sauce Labs provides an all-in-One API Testing Platform that ensures quality at speed across all microservices which can be automated with a CI/CD pipeline.
Some of the features it provides are:
Functional API Testing and Monitoring: Transform functional testing, business logic testing, and dynamic data-driven testing with API test automation.
Integration Testing: API integration testing with Sauce Labs is very fast. It allows you to collaborate on integration tests with other teams easily.
Performance Monitoring and Load Testing: Reuse functional tests as performance monitors or functional load tests that run in any environment.
Contract Testing with Mocking: You can increasingly depend on specification files to define their API program and also, it's easy to start with a contract test and extend that test to also include functional elements.
SmartBear(AlertSite)
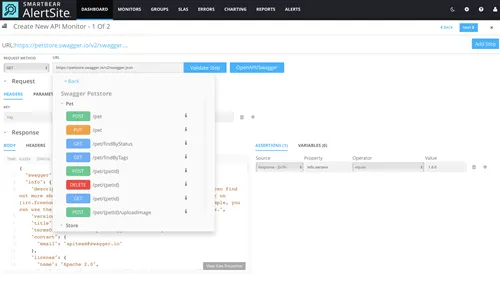
SmartBear provides software tools to developers across the software development lifecycle in a very low friction, low-cost manner. One of the products of SmartBear, AlertSite, is the 'Early Warning System' you can trust to monitor your websites, web apps, and APIs from all over the world and within your private networks.
They also claim that AlertSite outmatches Runscope and Postman in monitoring capabilities, alerting, and support.
Some of the main features of SmartBear are:
Ensuring Complete API Quality: It monitors the functionality, performance, correctness, and speed of every API call.
Alerting the Right Team: It routes alerts by error code, step level, and team and gets instant actionable insights to isolate the root cause and reduce downtime.
Visibility into API Transactions: It offers comprehensive, actionable insights into everything from availability, redirects, and authentication, to sequenced API calls that require the passing of variables pulled from the previous API responses.
Monitor Private APIs and Web Services: It monitors internal APIs that serve your internal customers from within your private network & microservices.
Moesif
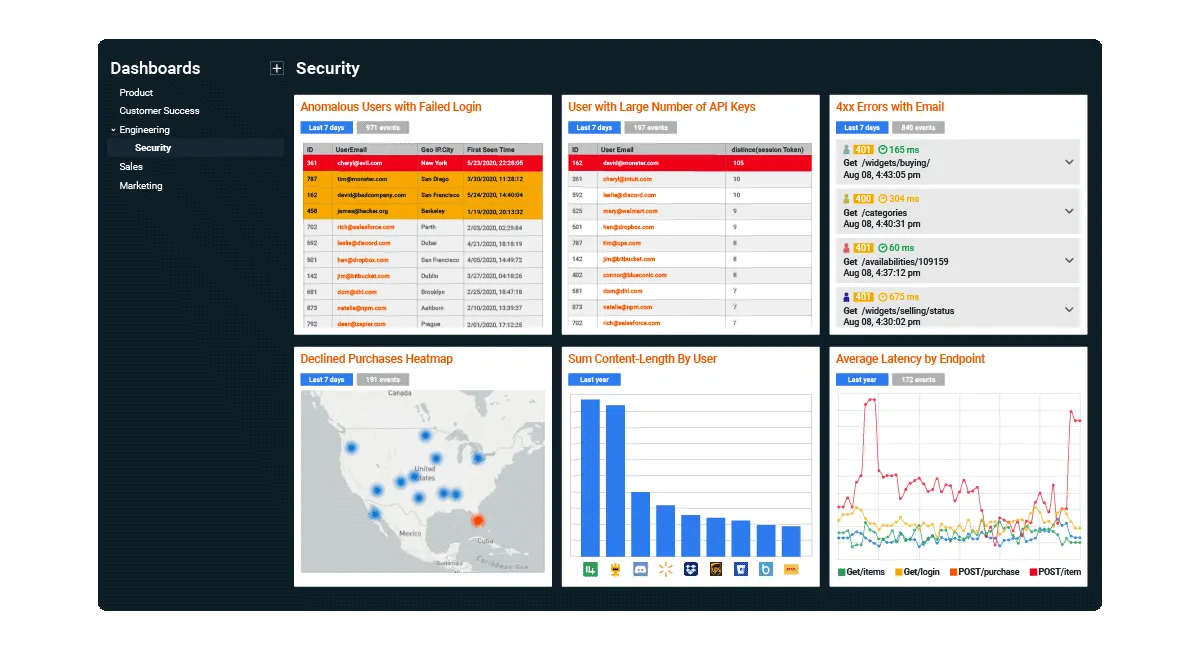
Moesif API Monitoring and Observability tool monitors end-to-end user experience and automatically gets alerted on API performance issues, security threats, and more.
Unlike the other synthetic tools, Moesif's user-centric API observability tracks how your actual users experience your APIs and applications. Leverage advanced anomaly detection to detect unknown unknowns with an easy-to-install monitoring agent.
Some of the main features of Moesif are:
Getting notified of API issues and threats: You can create real-time alert rules on any chart in Moesif with one click, even high-dimensional alerts.
Gaining control over notifications: Moesif's correlation engine and rating system adapts to consolidate multiple alerts and filter uninteresting ones.
Taking action on key customers: You can receive notifications when key customers exhibit certain behavior such as who got successfully activated today.
AppDynamics
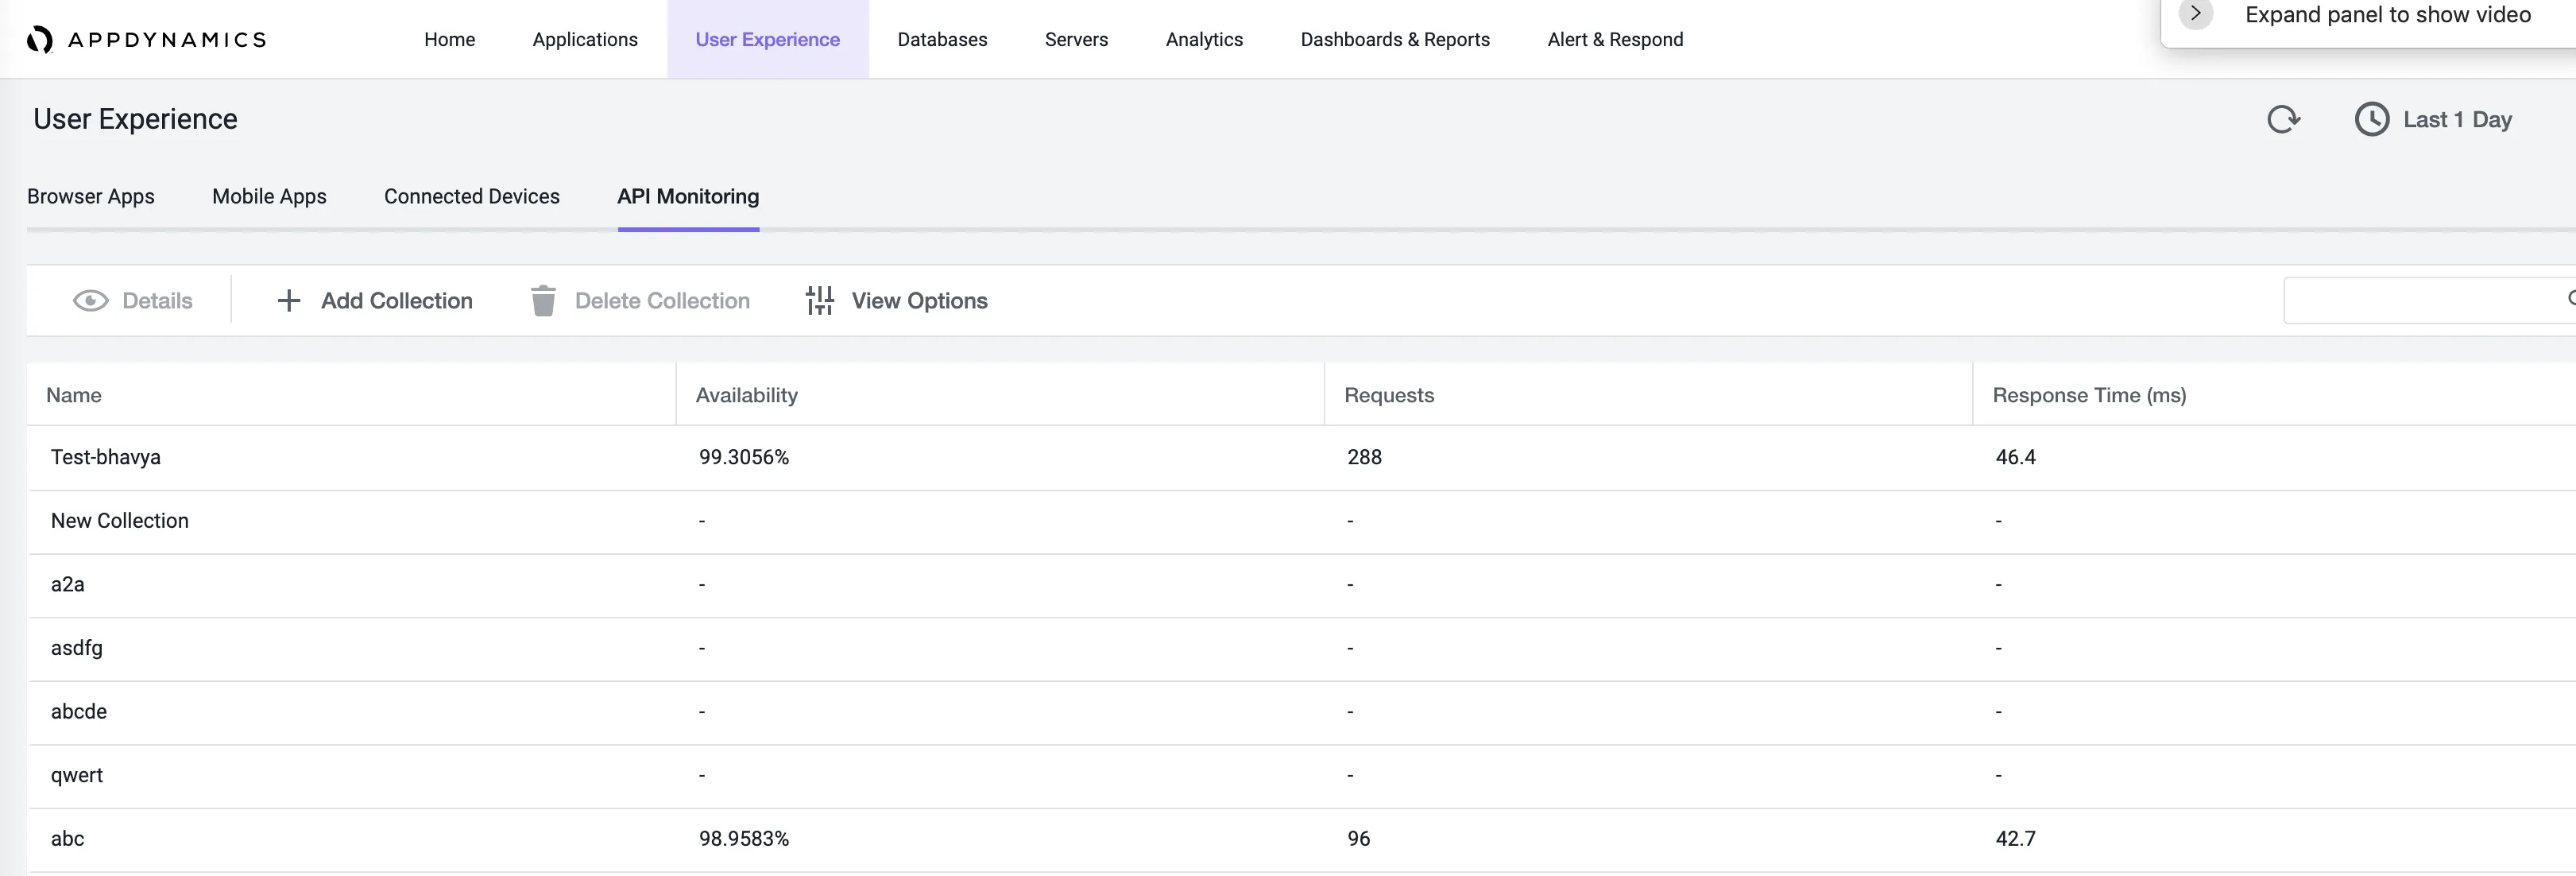
AppDynamics is a full-stack application monitoring tool that provides solutions for Observability, Monitoring, Log Management, etc. Synthetic API monitoring feature enables you to monitor the performance and availability of HTTP(s) based APIs. These APIs can be external, internal, or third-party APIs and from different geo-locations across the globe. You can monitor private and public APIs in these scenarios:
- Private APIs
- APIs are exposed by microservices or web services.
- APIs are used for communication between client and server.
- Public APIs
- APIs are exposed to end-users.
- Third-party APIs such as payment gateways and maps.
- Partner APIs.
Sematext
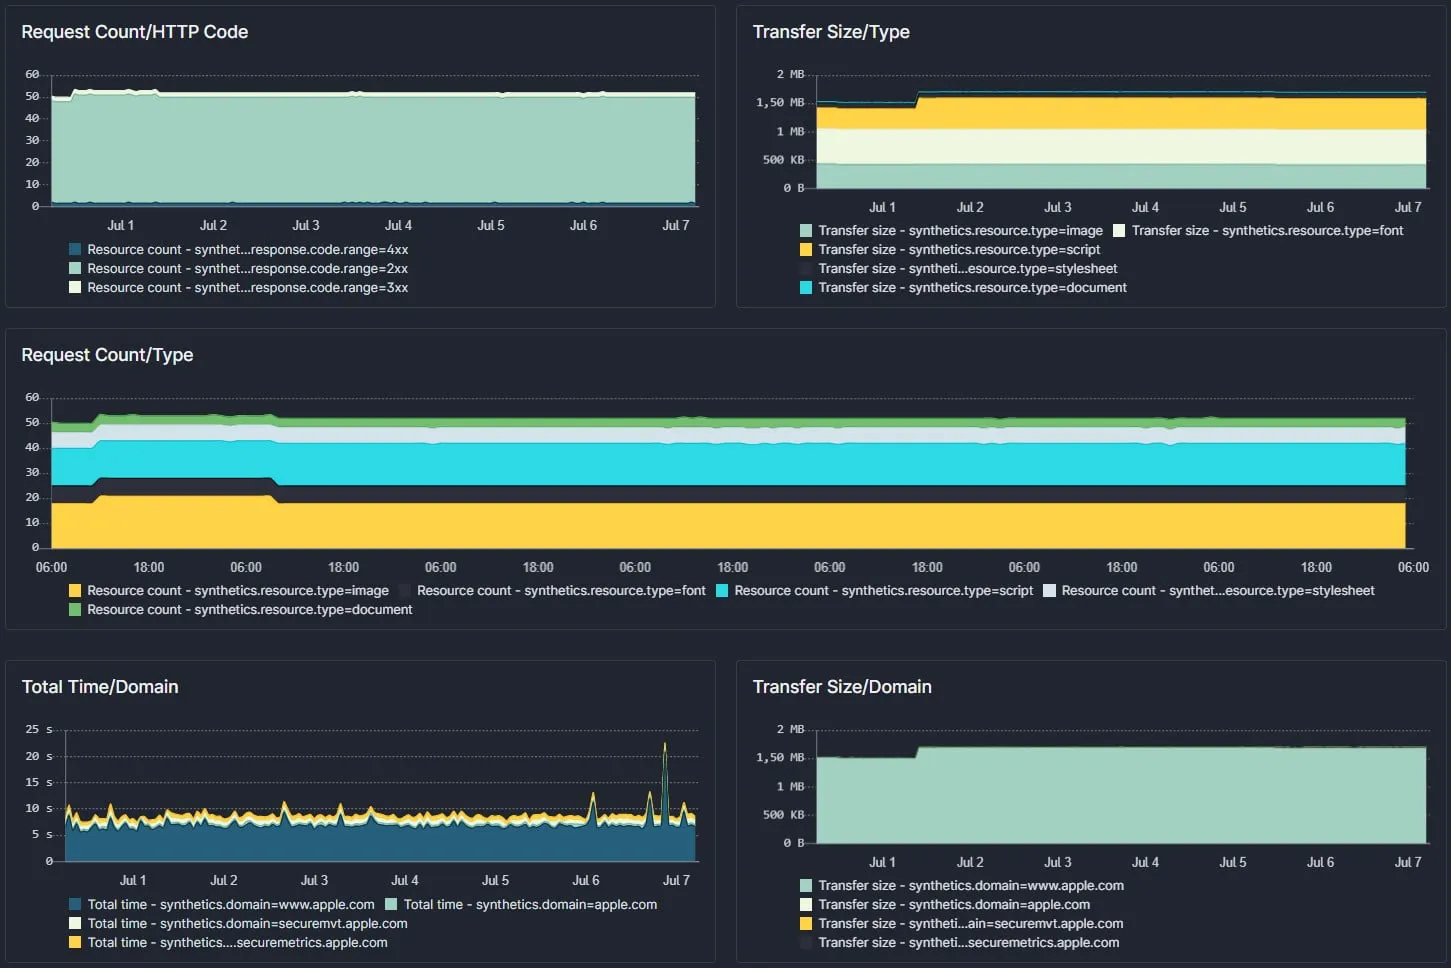
Sematext provides monitoring tools for full-stack monitoring, metrics & logs, alerts, events, etc for DevOps teams that want to move faster.
API monitoring is a tool that ensures the performance, health, and availability of APIs and web services with reliable and intuitive API monitoring tools.
Some of the features it provides are:
API Uptime Monitoring: It is used to monitor, get an advanced breakdown of API, Track Core Web Vitals, and check the response of your APIs from different locations around the world.
Web Services and API Performance Monitoring: It can monitor and track API performance and availability, use waterfall charts to identify performance bottlenecks, and collect custom API metrics.
API Data Validation: It can monitor and validate the response headers, codes, etc of all your APIs.
Real-Time API Alerting and Reporting: It can track and set up custom API monitoring dashboards and alerts in real-time.
RapidAPI
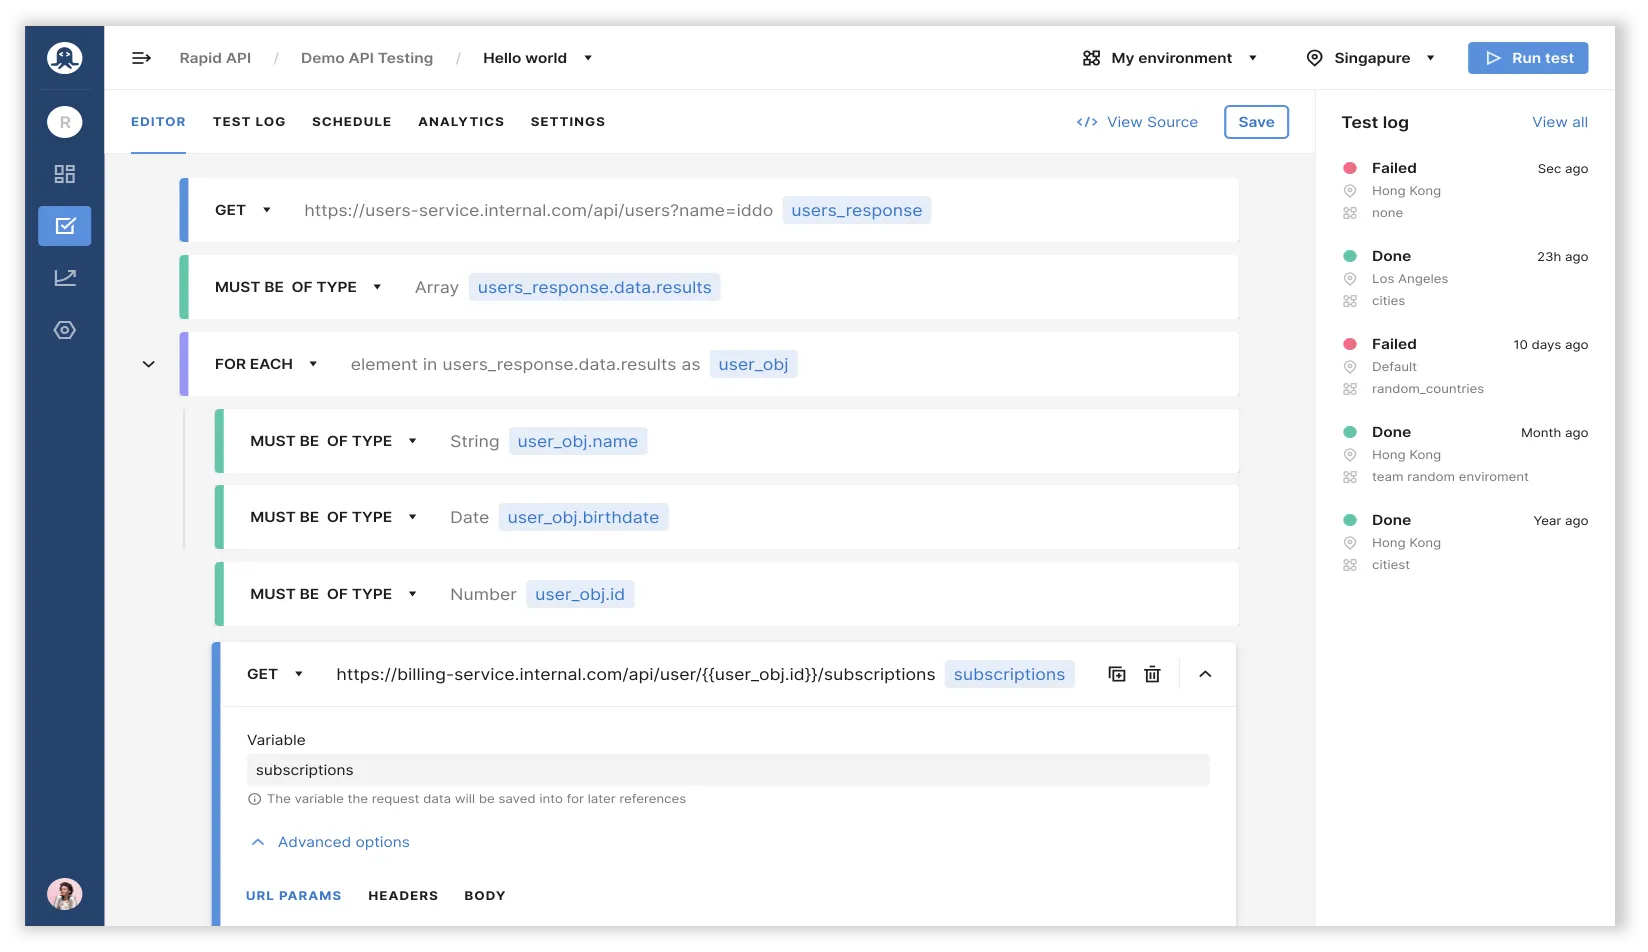
RapidAPI is the world’s largest API Hub, it makes it easier to find, connect to, and manage APIs across multiple cloud environments. RapidAPI Testing is a functional API testing and monitoring solution that provides an intuitive UX, support for any API type, and integration with RapidAPI Hub and RapidAPI Enterprise Hub.
Some of the features it provides are:
Ensure API Functionality: It can easily create functional tests for deep validation of APIs
Centralize Monitoring: It can monitor and manage API tests across multiple geographies
Improve Efficiency: It can be integrated into the CI/CD pipeline, collaborate across teams, and natively integrate with RapidAPI Hub and RapidAPI Enterprise Hub
AWS Cloudwatch
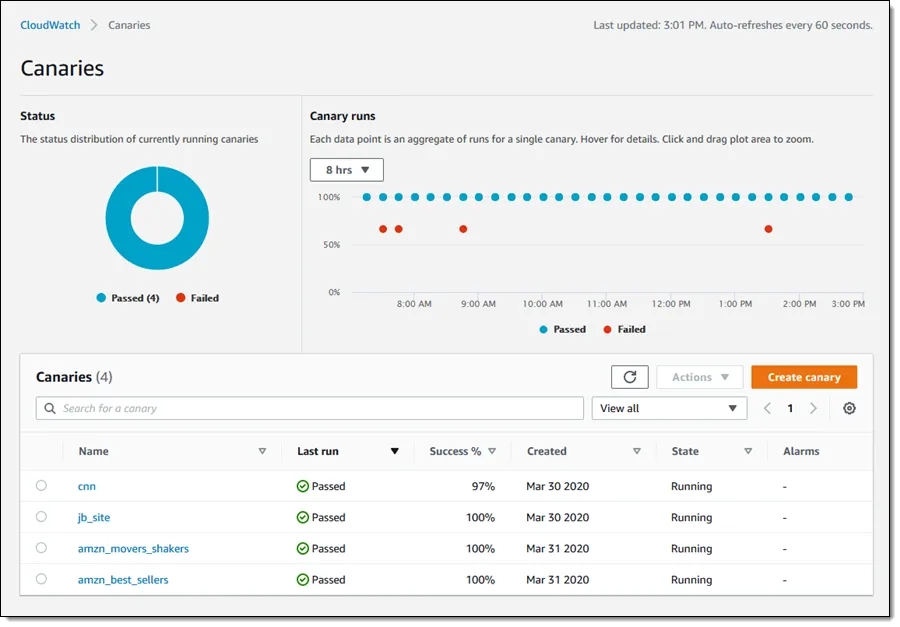
CloudWatch is a monitoring and management service that provides data and actionable insights for AWS, hybrid, and on-premises applications and infrastructure resources. It collects and processes raw data from API Gateway into readable, near-real-time metrics. These statistics are recorded for a period of 15 months so you can access historical information and gain a better perspective on how your web application or service is performing.
The metrics reported by API Gateway provide information that you can analyze in different ways. It can monitor the metrics to measure the responsiveness of the backend, measure the overall responsiveness of your API calls, and optimize cache capacities to achieve the desired performance.
Postman
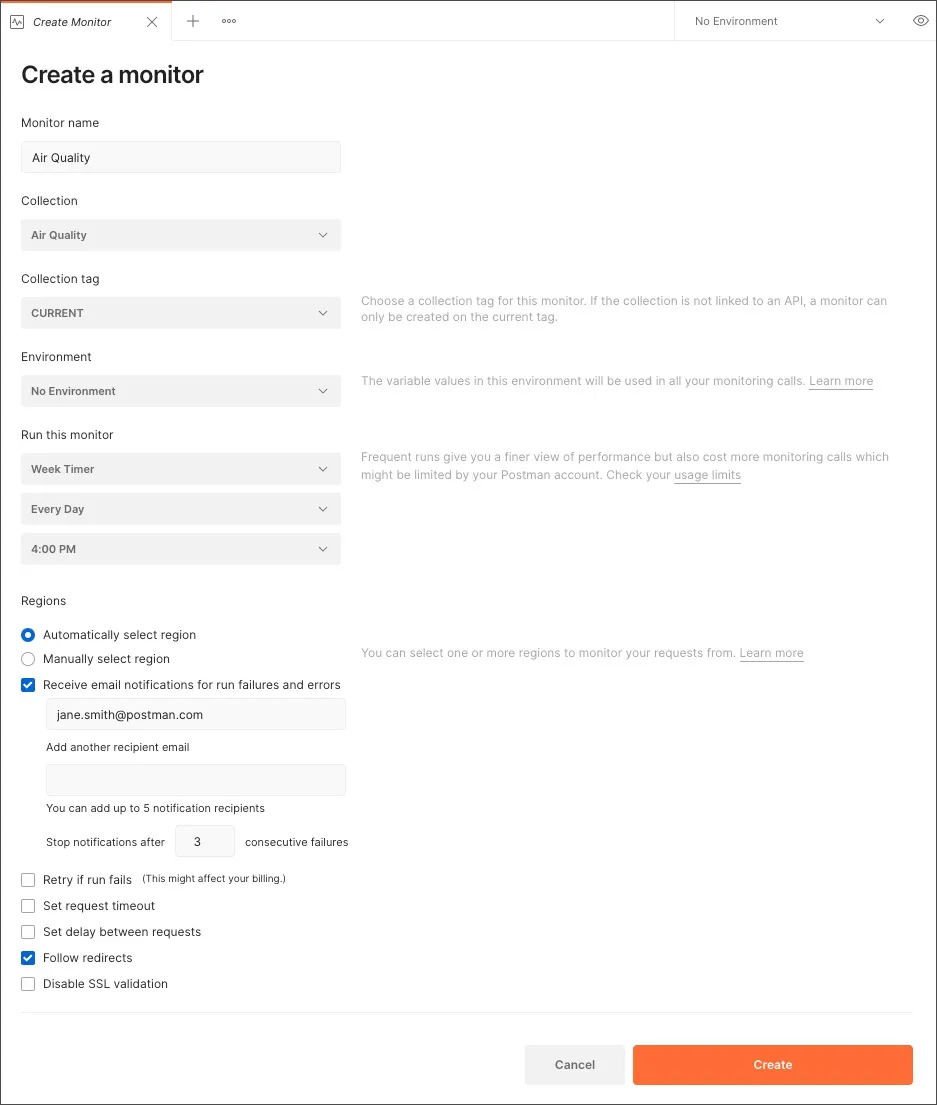
Postman Monitors give you continuous visibility into the health and performance of your APIs. Uptime monitors (open beta) enable you to keep watch on a single API endpoint, while collection-based monitors enable you to run API test scripts, chain together multiple requests, and validate critical API flows.
Once the monitor is running you’ll be alerted to any system outages or test failures, so you can identify and address issues before your API’s consumers are affected.
Types of monitors:
- Uptime monitors - Uptime monitors (open beta) enable you to track the availability of an API or website.
- Collection-based monitors - A collection-based monitor runs a series of requests from the Postman cloud on a schedule you set.
Assertible

Assertible is a reliable and intuitive tool for API performance and uptime monitoring.
Some of the features it provides are:
Validate more than just up or down: You can create tests that define how your API should respond by using industry-standard patterns for validating response data, writing functional test cases, and setting up synthetic monitoring.
Collaborative API monitoring: Invite your whole team to create tests, debug errors, and keep track of your API performance with Assertible's first-class support for organizations.
No code required: Unlike other services, you don't need to write any code to validate your APIs with Assertible. Our built-in assertions and single-click monitoring make it possible to start monitoring in minutes.
Meaningful alerts and notifications: It gives you the most important details of your test failures so your team can make quick decisions on how to respond to downtime. When a test fails, it's critical that notifications and alerts are specific and actionable.
APIMetrics
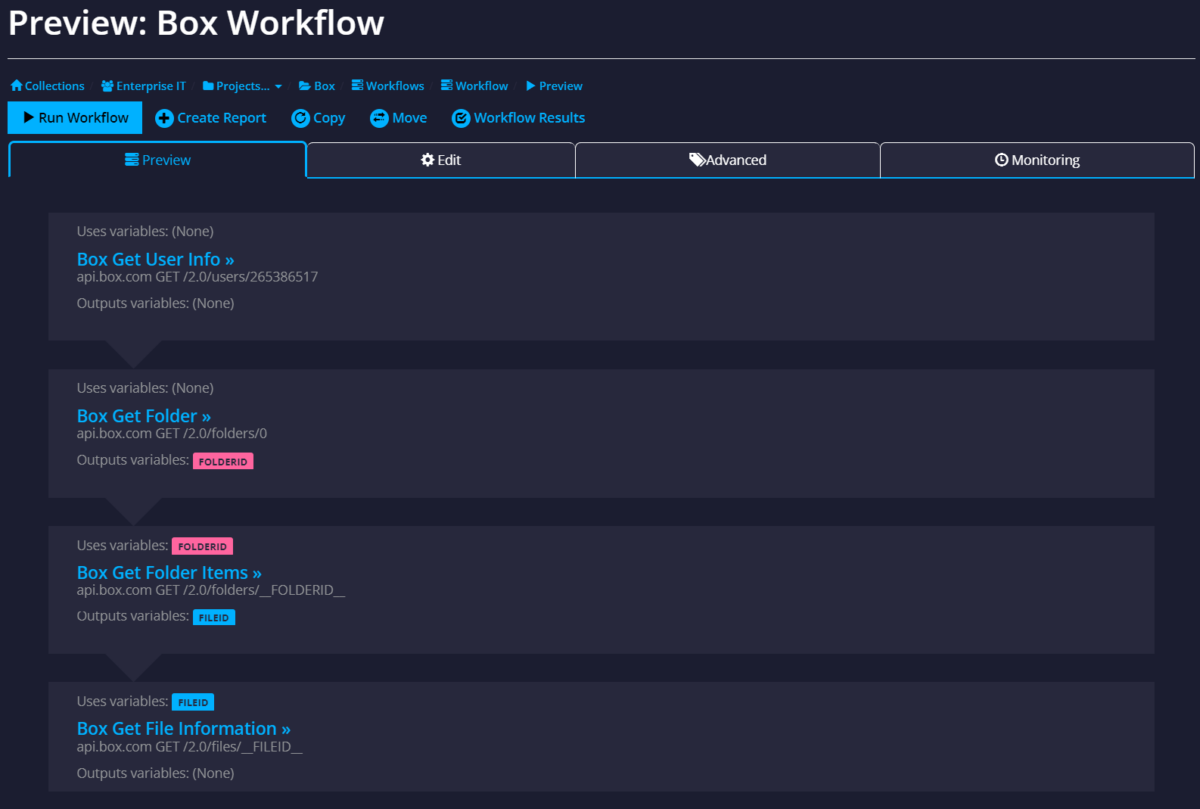
APIMetrics is an elegant, powerful, functional API measurement & monitoring tool that is used to measure performance, see the quality, get trusted, and independent measurements of the APIs you provide or rely on.
Setting up API monitoring is as simple as entering a URL. The APImetrics user-friendly interface lets you make any type of HTTP call, and test it right there in the browser – or from 80+ locations around the world and the cloud. You can create complex sequences of calls for API monitoring workflows, Configure alerts and assertions, and easily manage variables across different calls and call types.
API Science
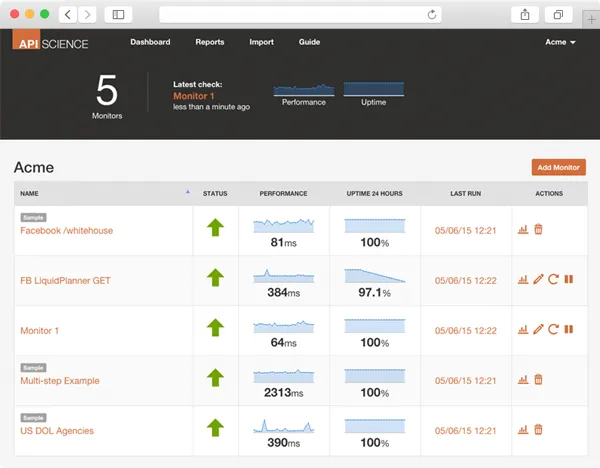
API Science can help keep track of a web API’s health, availability, and performance and alerts you when something goes wrong. The monitors are simple to set up, and you can build multiple-step monitors in a short amount of time.
APIscience was developed with the sole purpose of supporting and monitoring REST-based API services. You can expect a quality UI and quick access to analytics from the reporting dashboard. APIscience monitors the APIs from several locations worldwide and informs you on how they are doing in various places.
Atatus
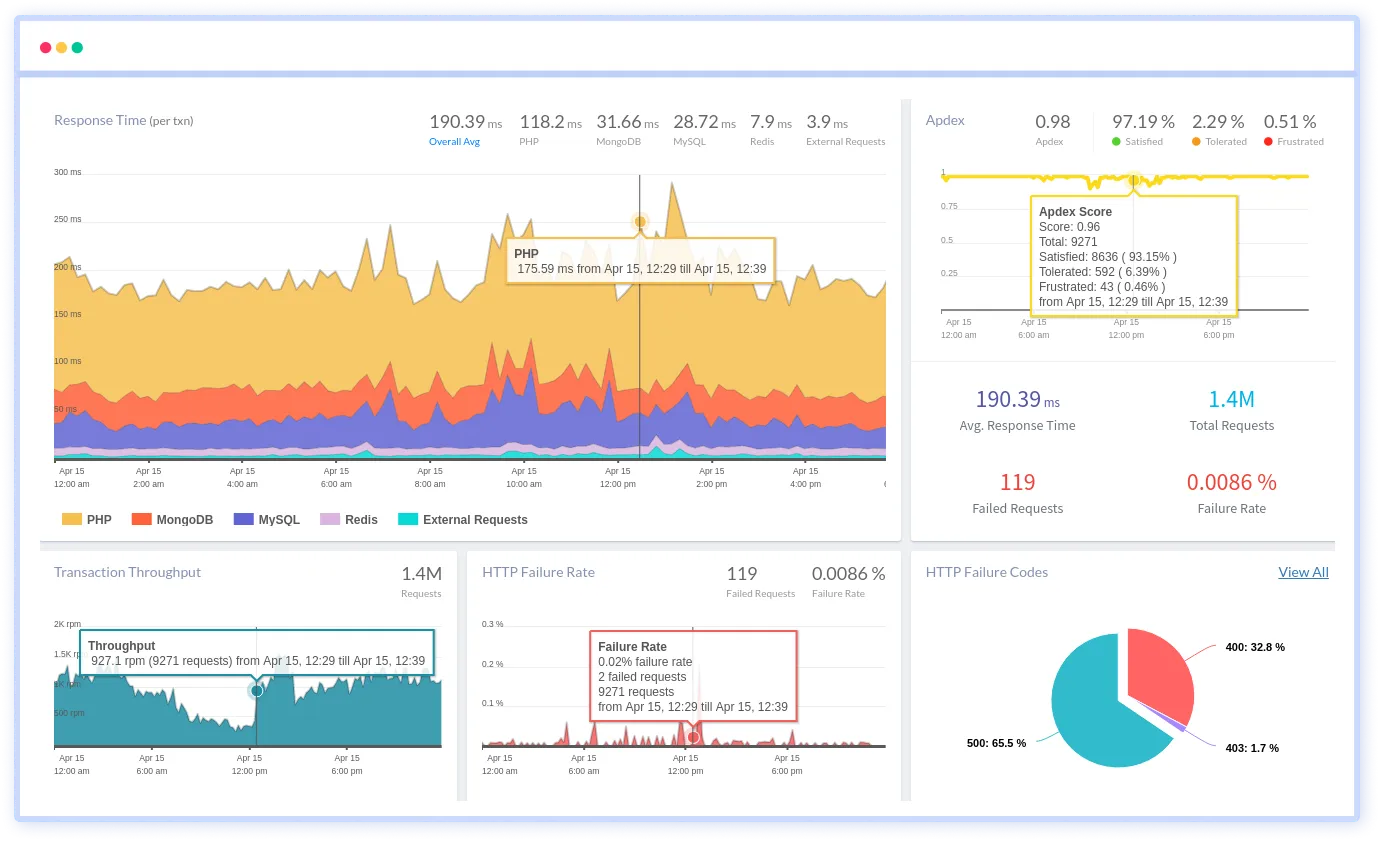
Atatus Synthetic Monitoring tool ensures availability and uptime across endpoints with synthetic monitoring and simulates user API calls on your applications.
Some of the features it provides are:
In-depth visibility into back-end performance: It diagnoses, troubleshoots, and fixes the application with performance monitoring and improves reliability.
View health servers and processes: It measures system performance and gets a complete view of the health and usage of servers in real-time.
Detect and fix slow database queries: It keeps track of database calls to ensure they do not affect the application performance.
Choosing the right API monitoring tools
Selecting the appropriate API monitoring tool is pivotal for effectively monitoring and resolving issues within applications. When evaluating potential tools, users should prioritize solutions that provide comprehensive visibility into their API ecosystem. This includes real-time insights into API response times, error rates, throughput, and dependencies. The ideal tool should be able to trace requests across distributed systems and identify performance bottlenecks for efficient troubleshooting and optimization. In this regard, SigNoz stands out as a robust option.
SigNoz is a full-stack open surce APM tool designed natively for OpenTelemetry, a powerful framework for generating and collecting telemetry data (logs, metrics, and traces). This integration ensures thorough monitoring of service endpoints and offers valuable insights into key metrics like P95 and P99 latencies, service error rates, external API interactions, and individual endpoint performance.
Its distributed tracing capabilities allow for quick identification of the root causes of API failures. With just a few clicks, you can delve into the exact traces responsible for the problem, allowing you to visualize and analyze detailed flamegraphs of individual request traces. This level of granularity empowers you to identify performance bottlenecks, dependencies, and anomalies with precision and facilitates rapid troubleshooting and optimization.
Final Thoughts
There are some fundamental metrics to monitor for API performance. Response times, error percentage, and requests per second are key metrics that can give insights into API performance. You can choose tools based on your use case and needs.
Monitoring APIs in silos can be a good first step, but to debug performance issues quickly you need more context. A tool that can give you further insights into why a particular API didn’t perform well can help engineering teams identify performance bottlenecks faster.
SigNoz provides you with a service-centric view of your top endpoints. You can then visualize the API performance by analyzing all the events that were processed as part of the API call.
You can check out SigNoz Github repo here:
It is easy to get started with SigNoz. It can be installed on macOS or Linux computers in just three steps by using a simple installation script.
The install script automatically installs Docker Engine on Linux. However, you must manually install Docker Engine on macOS before running the install script.
git clone -b main https://github.com/SigNoz/signoz.git
cd signoz/deploy/
./install.sh
You can visit our documentation for instructions on how to install SigNoz using Docker Swarm and Helm Charts.


