OpenTelemetry-Native Traces,
Metrics, and Logs in a single pane
A single tool for all your observability needs - APM, logs, metrics, exceptions,
alerts, and dashboards powered by a powerful query builder.
Trusted by teams at
EXPLORE SIGNOZ
One Stop Observability
You don’t need to manage multiple tools for traces, metrics, and logs. Get great out-of-the-box charts and a powerful query builder to dig deeper into your data.
APM
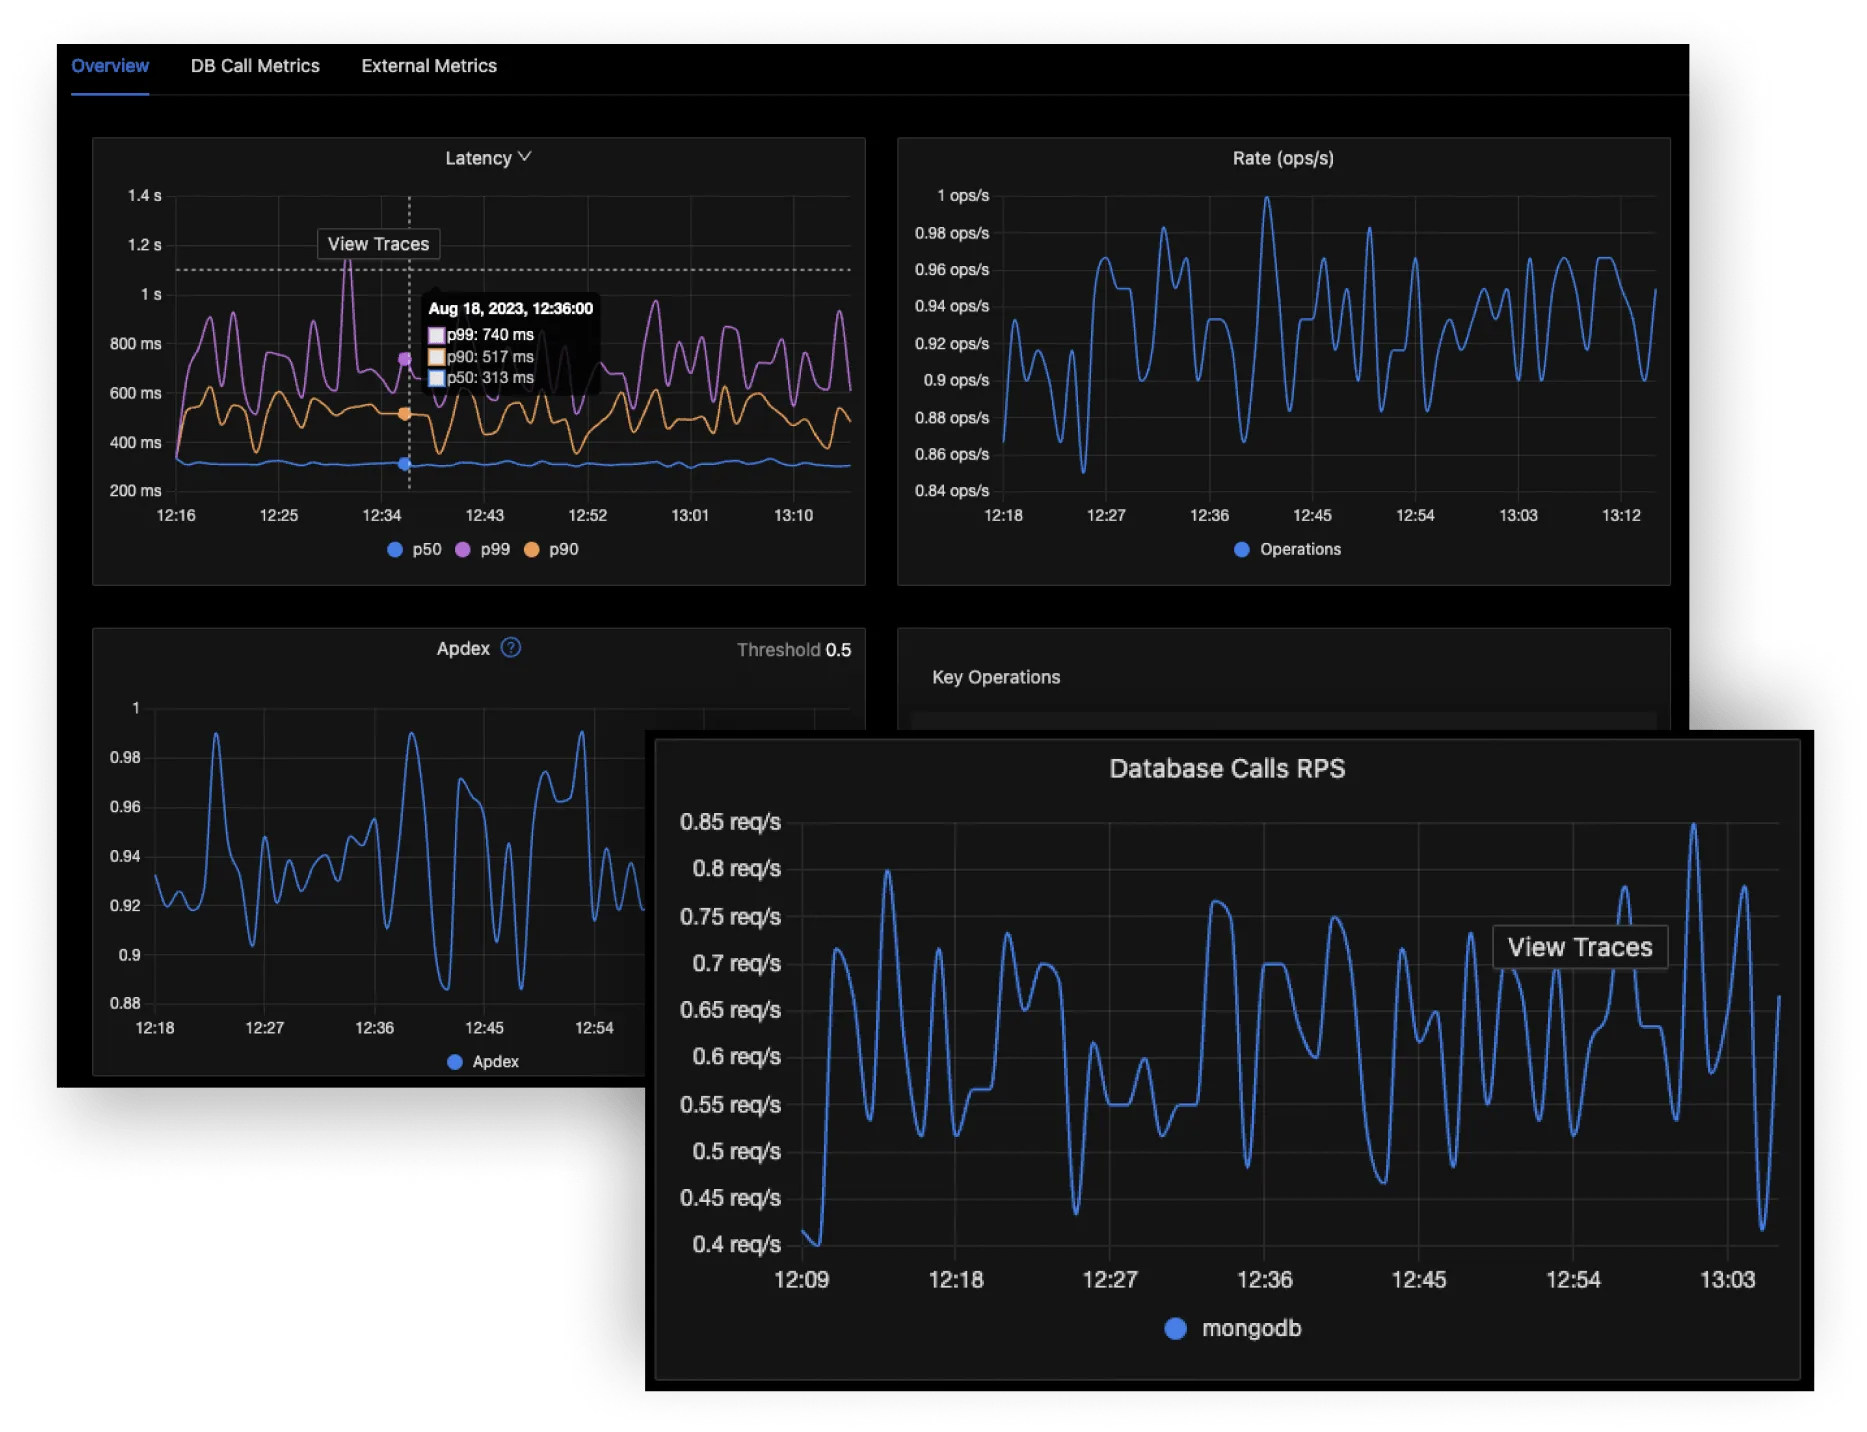
- Out-of-box charts for application metrics like p90, p99 latency, error rates, request rates, etc.
- Monitor RED metrics for key operations in any service
- Monitor database and external calls made by any service
- Service maps to show application topology
Distributed Tracing
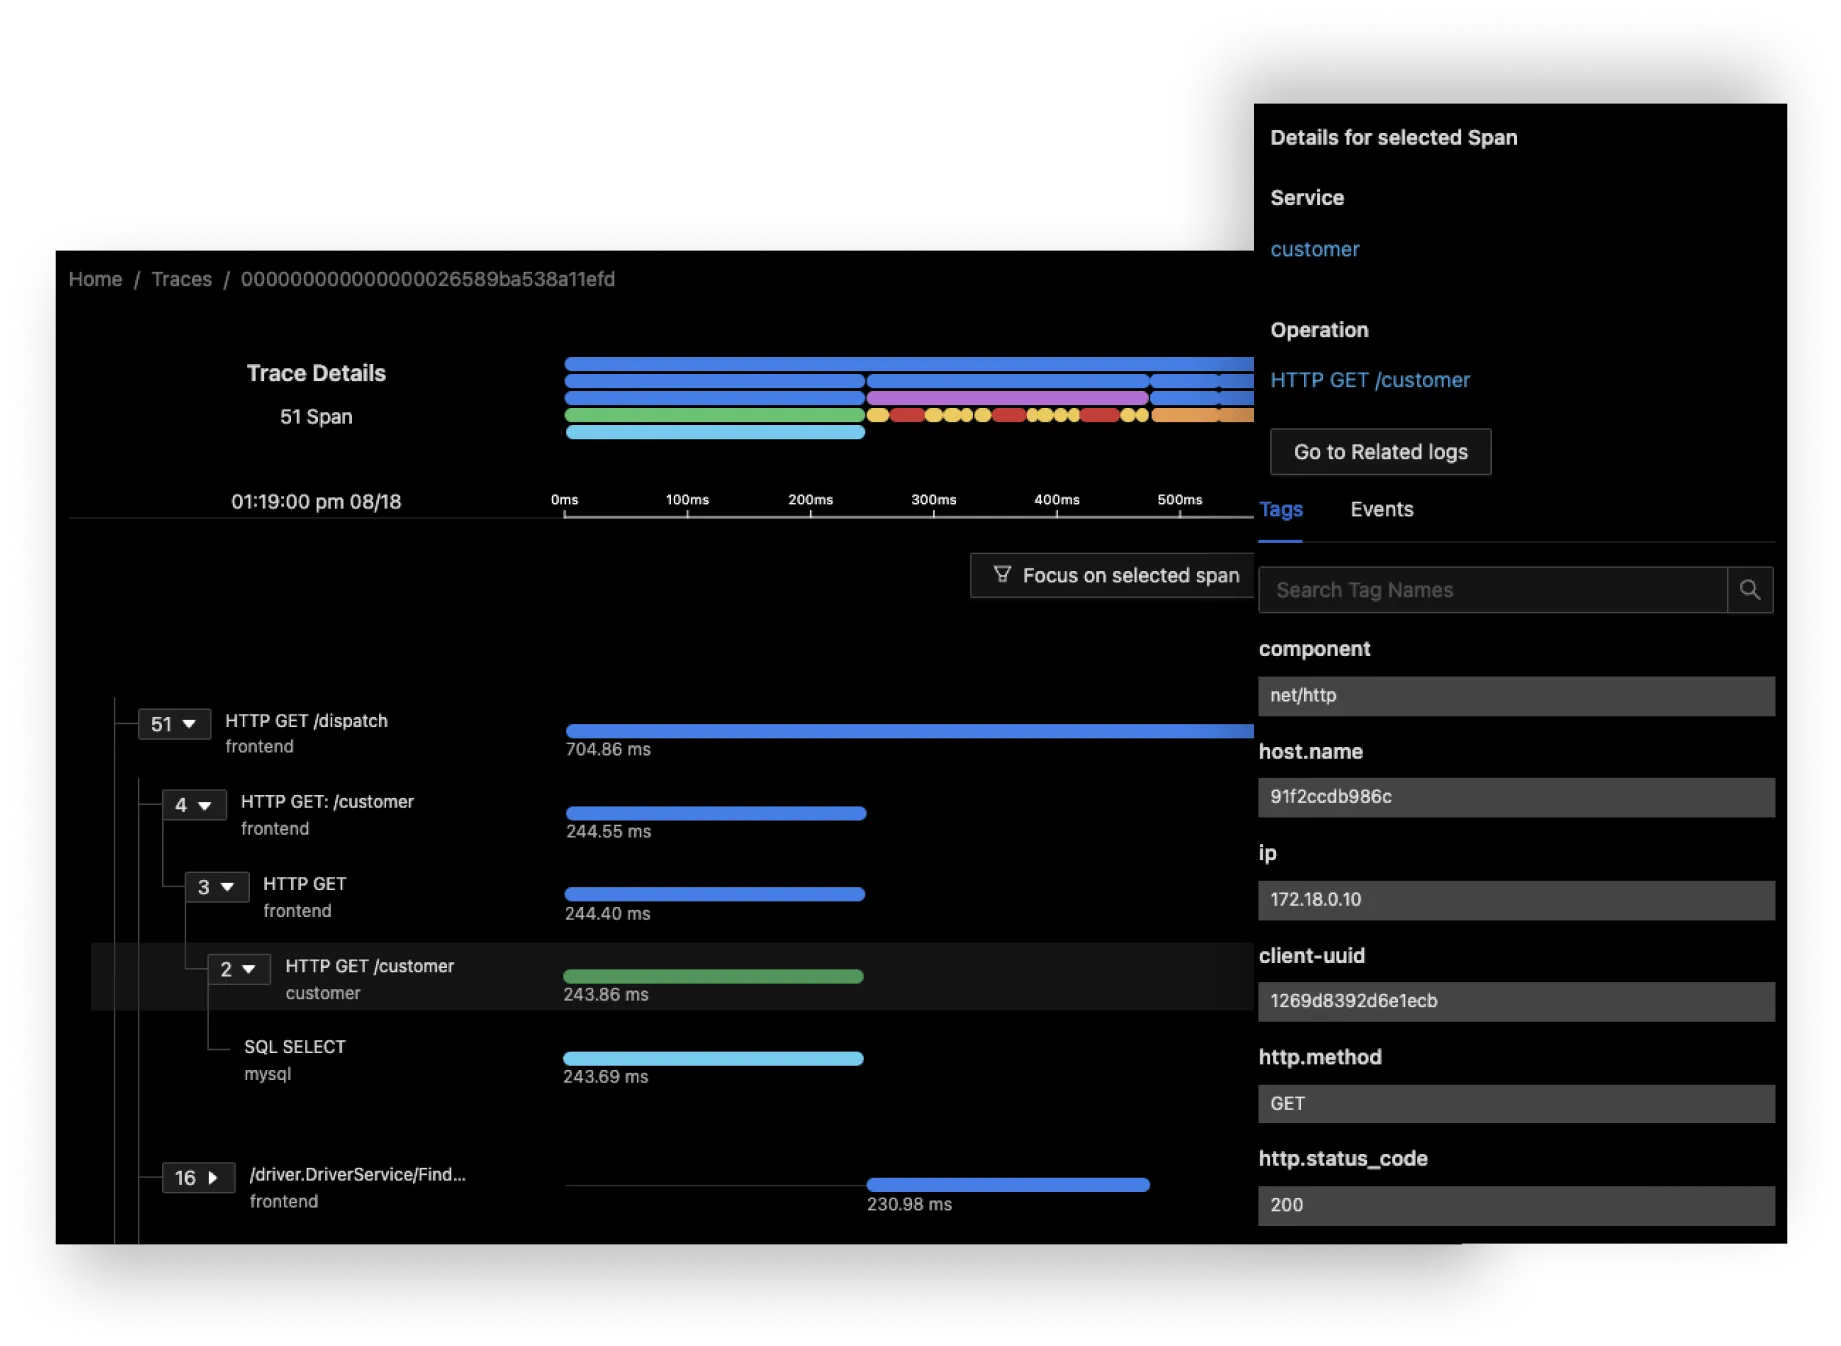
- Get end-to-end visibility of your services with rich contextual tags and attributes.
- Run aggregates on trace data like sum, avg, p99 latency, etc.
- Group your trace data by different attributes like HTTP URL, service names, etc. to find granular issues
- Flamegraphs and Gantt charts to visualize the flow of requests easily.
Metrics & Dashboards
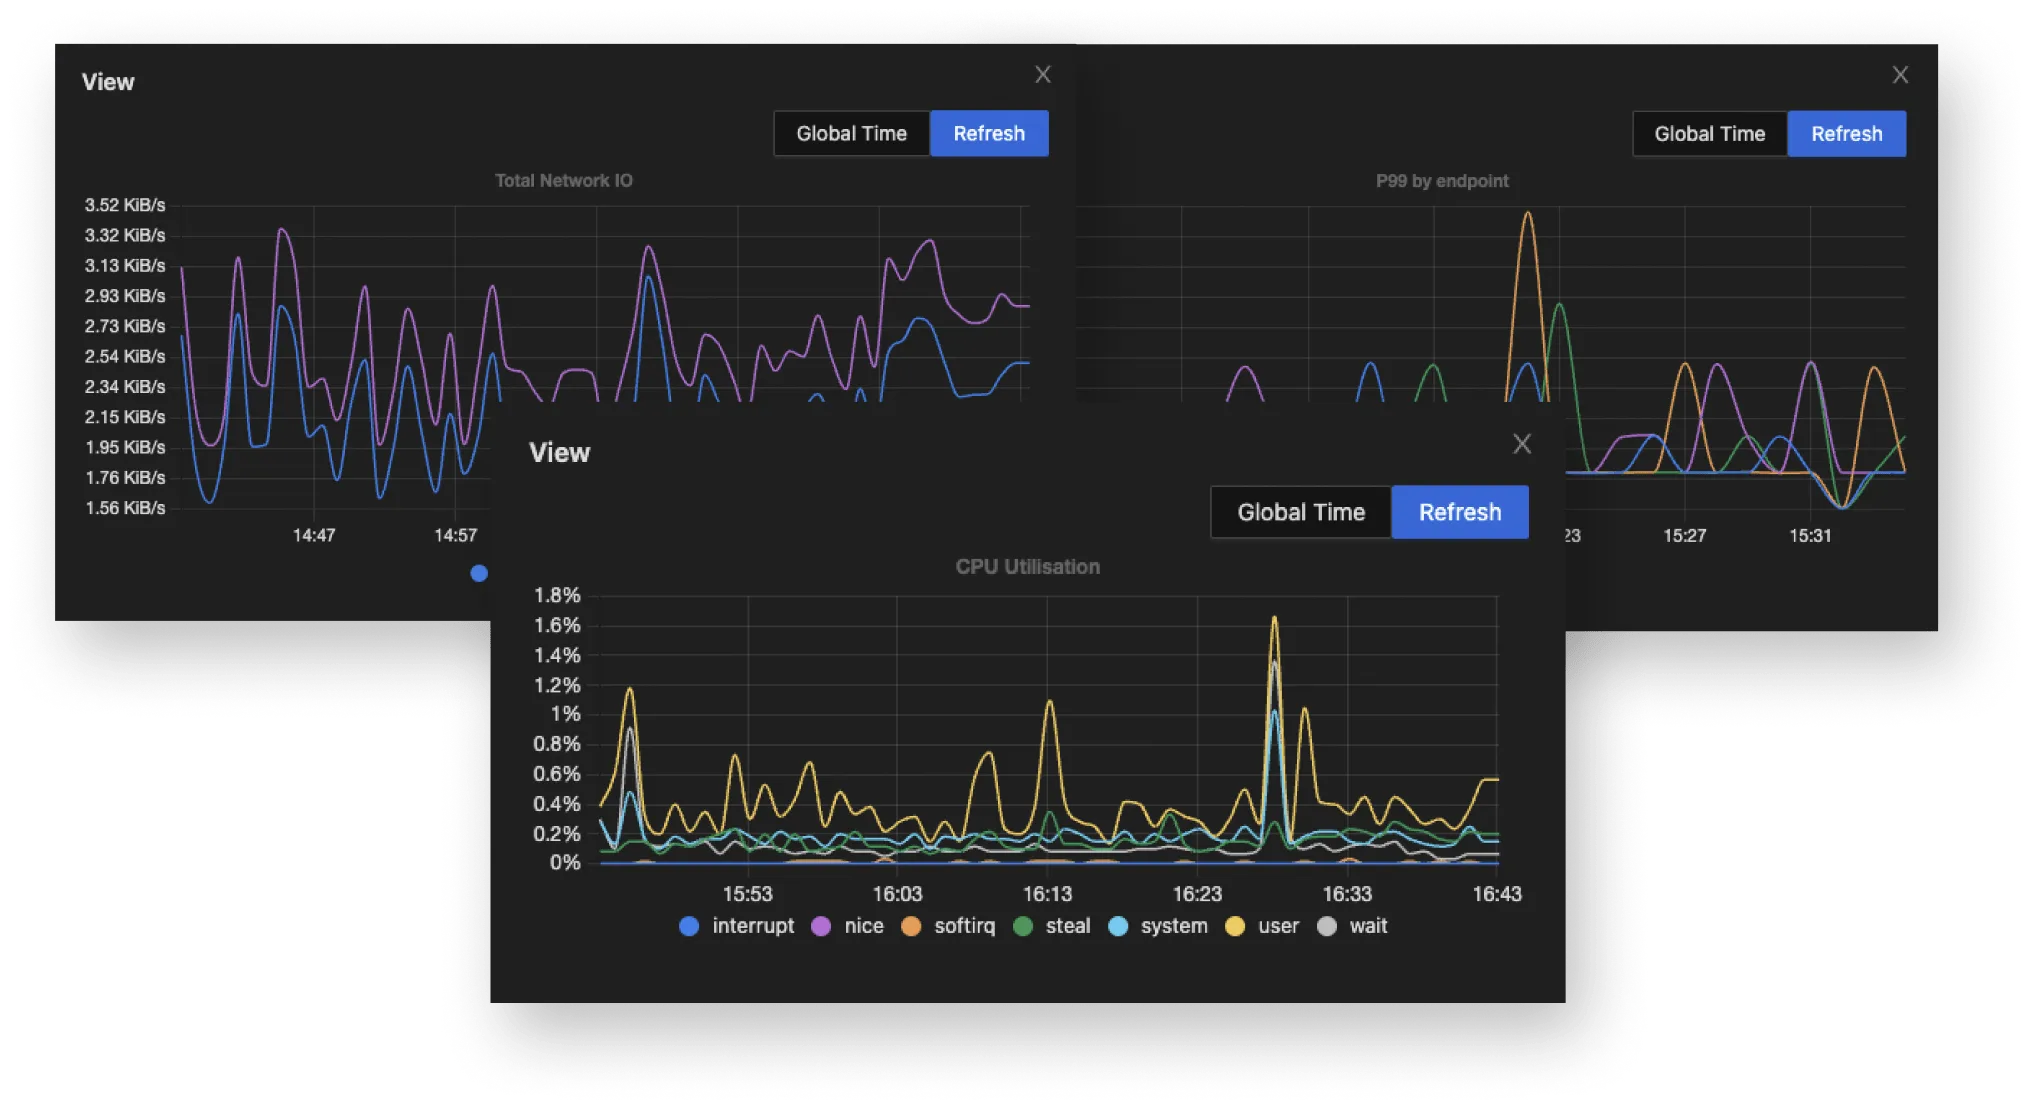
- Monitor any metrics important to you.
- Support for OpenTelemetry metrics SDK or enable a Prometheus receiver to receive any metrics exposed in a running Prometheus instance.
- Create dashboards around any use case like external calls, API endpoints, JVM metrics - there is no limit.
Logs Management
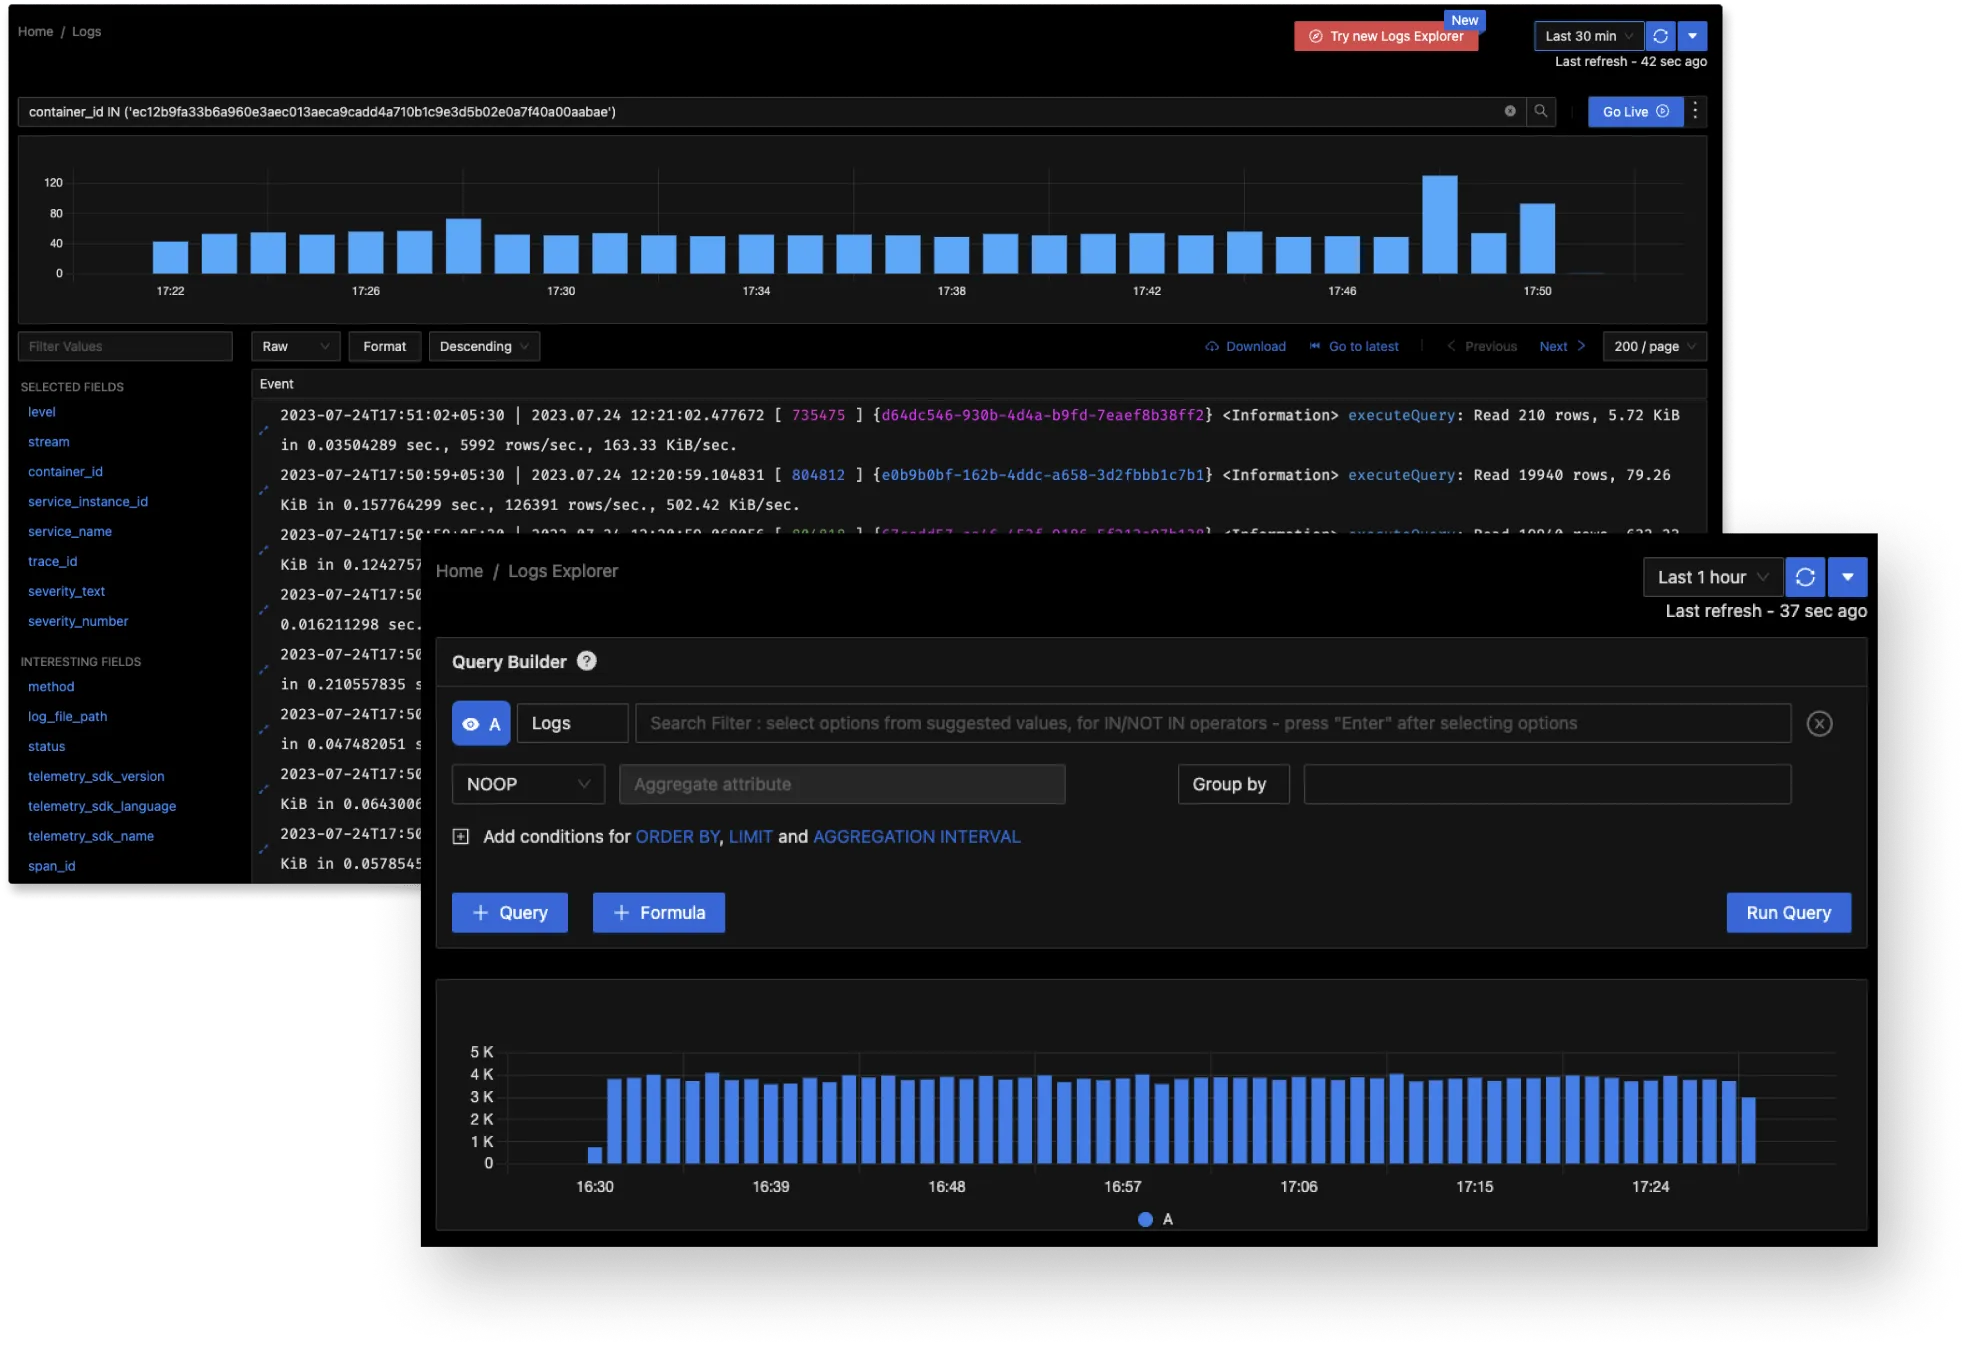
- Ingest, process, and analyze logs at any scale.
- Support for OpenTelemetry logs or any existing logging pipeline that you have.
- Live tail, easy search, and a powerful logs query builder to give you full control
- Use a columnar database to store logs which enables lightning fast log analytics.
(Logs performance benchmark)
Exceptions Monitoring
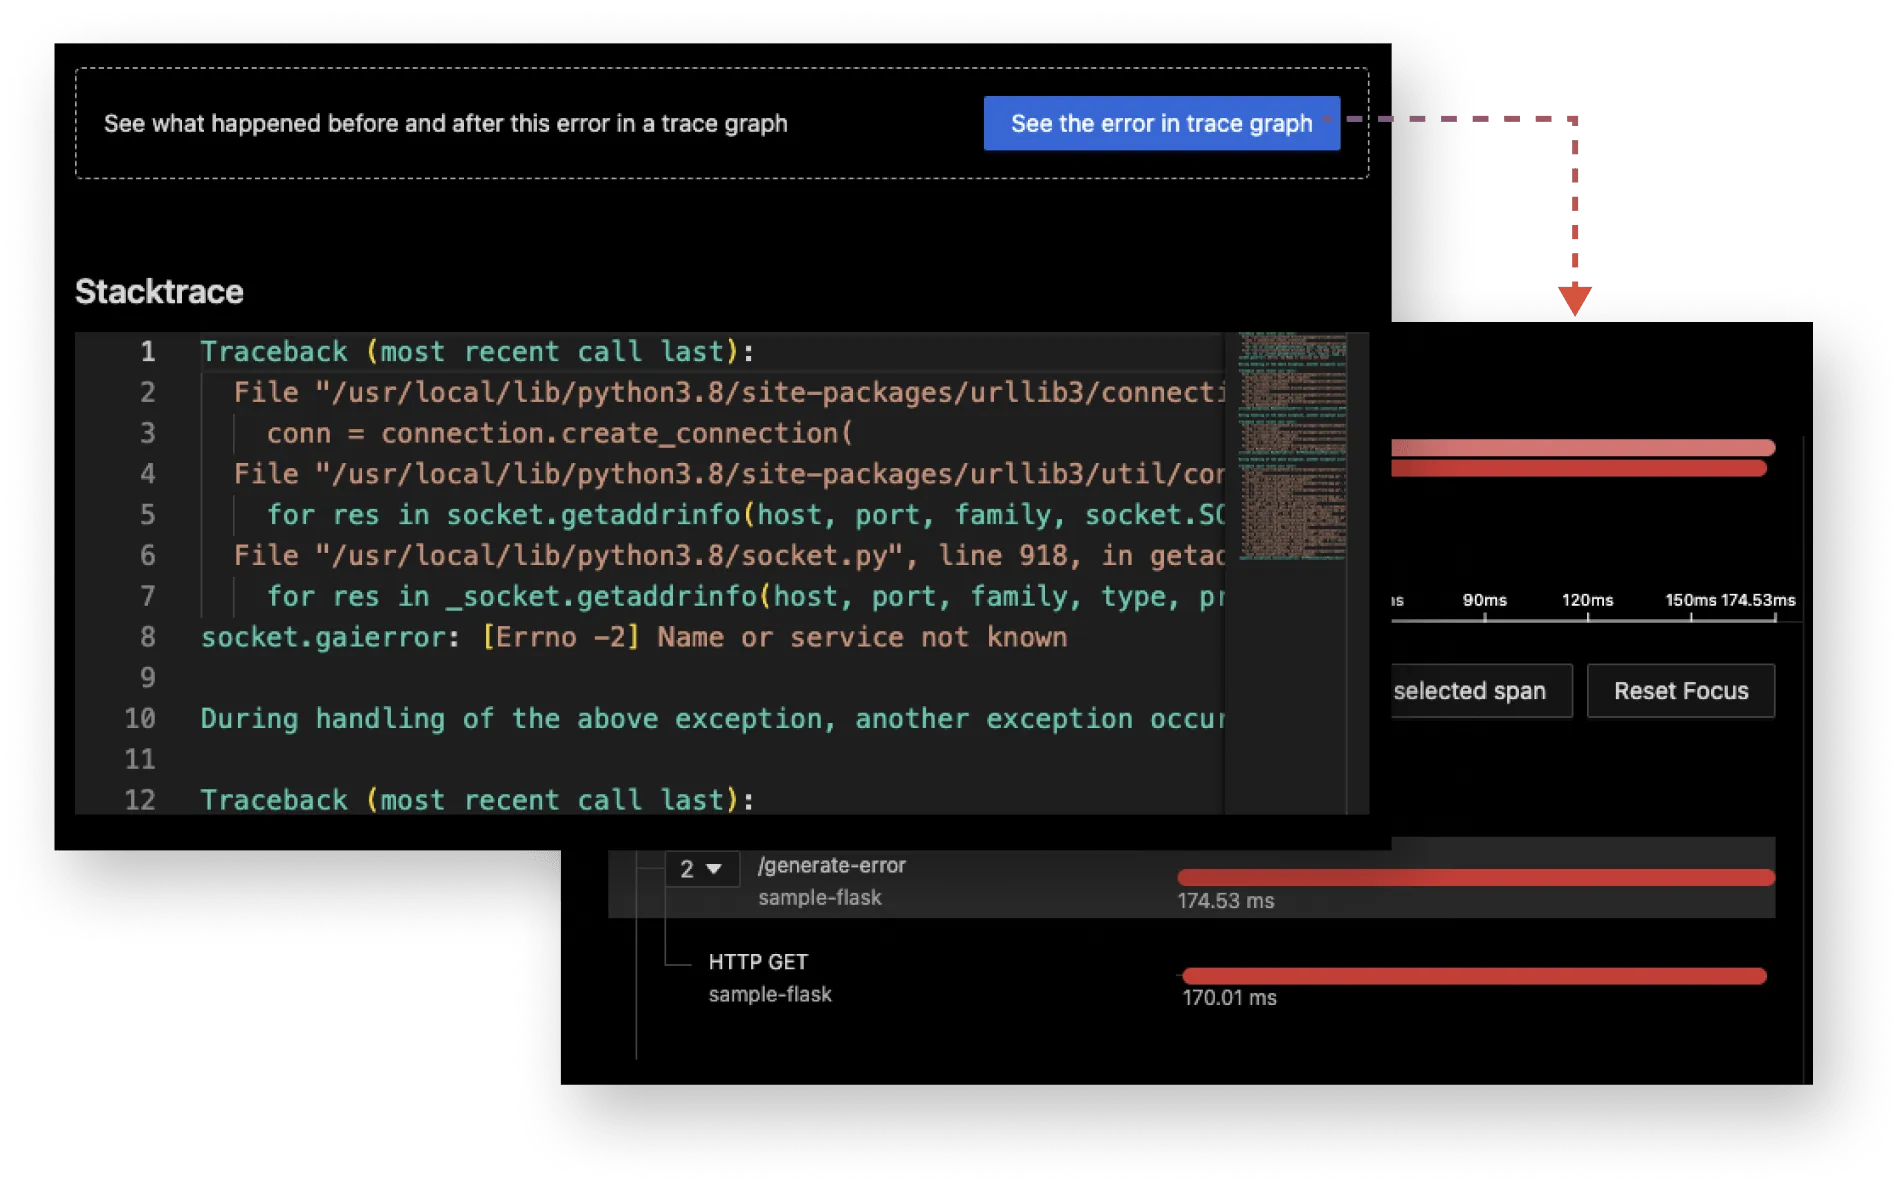
- Record exceptions automatically in Python, Java, Ruby, and Javascript
- Rich contextual data with stack trace, exceptions attributes and linked span data
- Exceptions grouping and custom exceptions
- Navigate from Exceptions to related traces to see the error in trace graph
Alerts
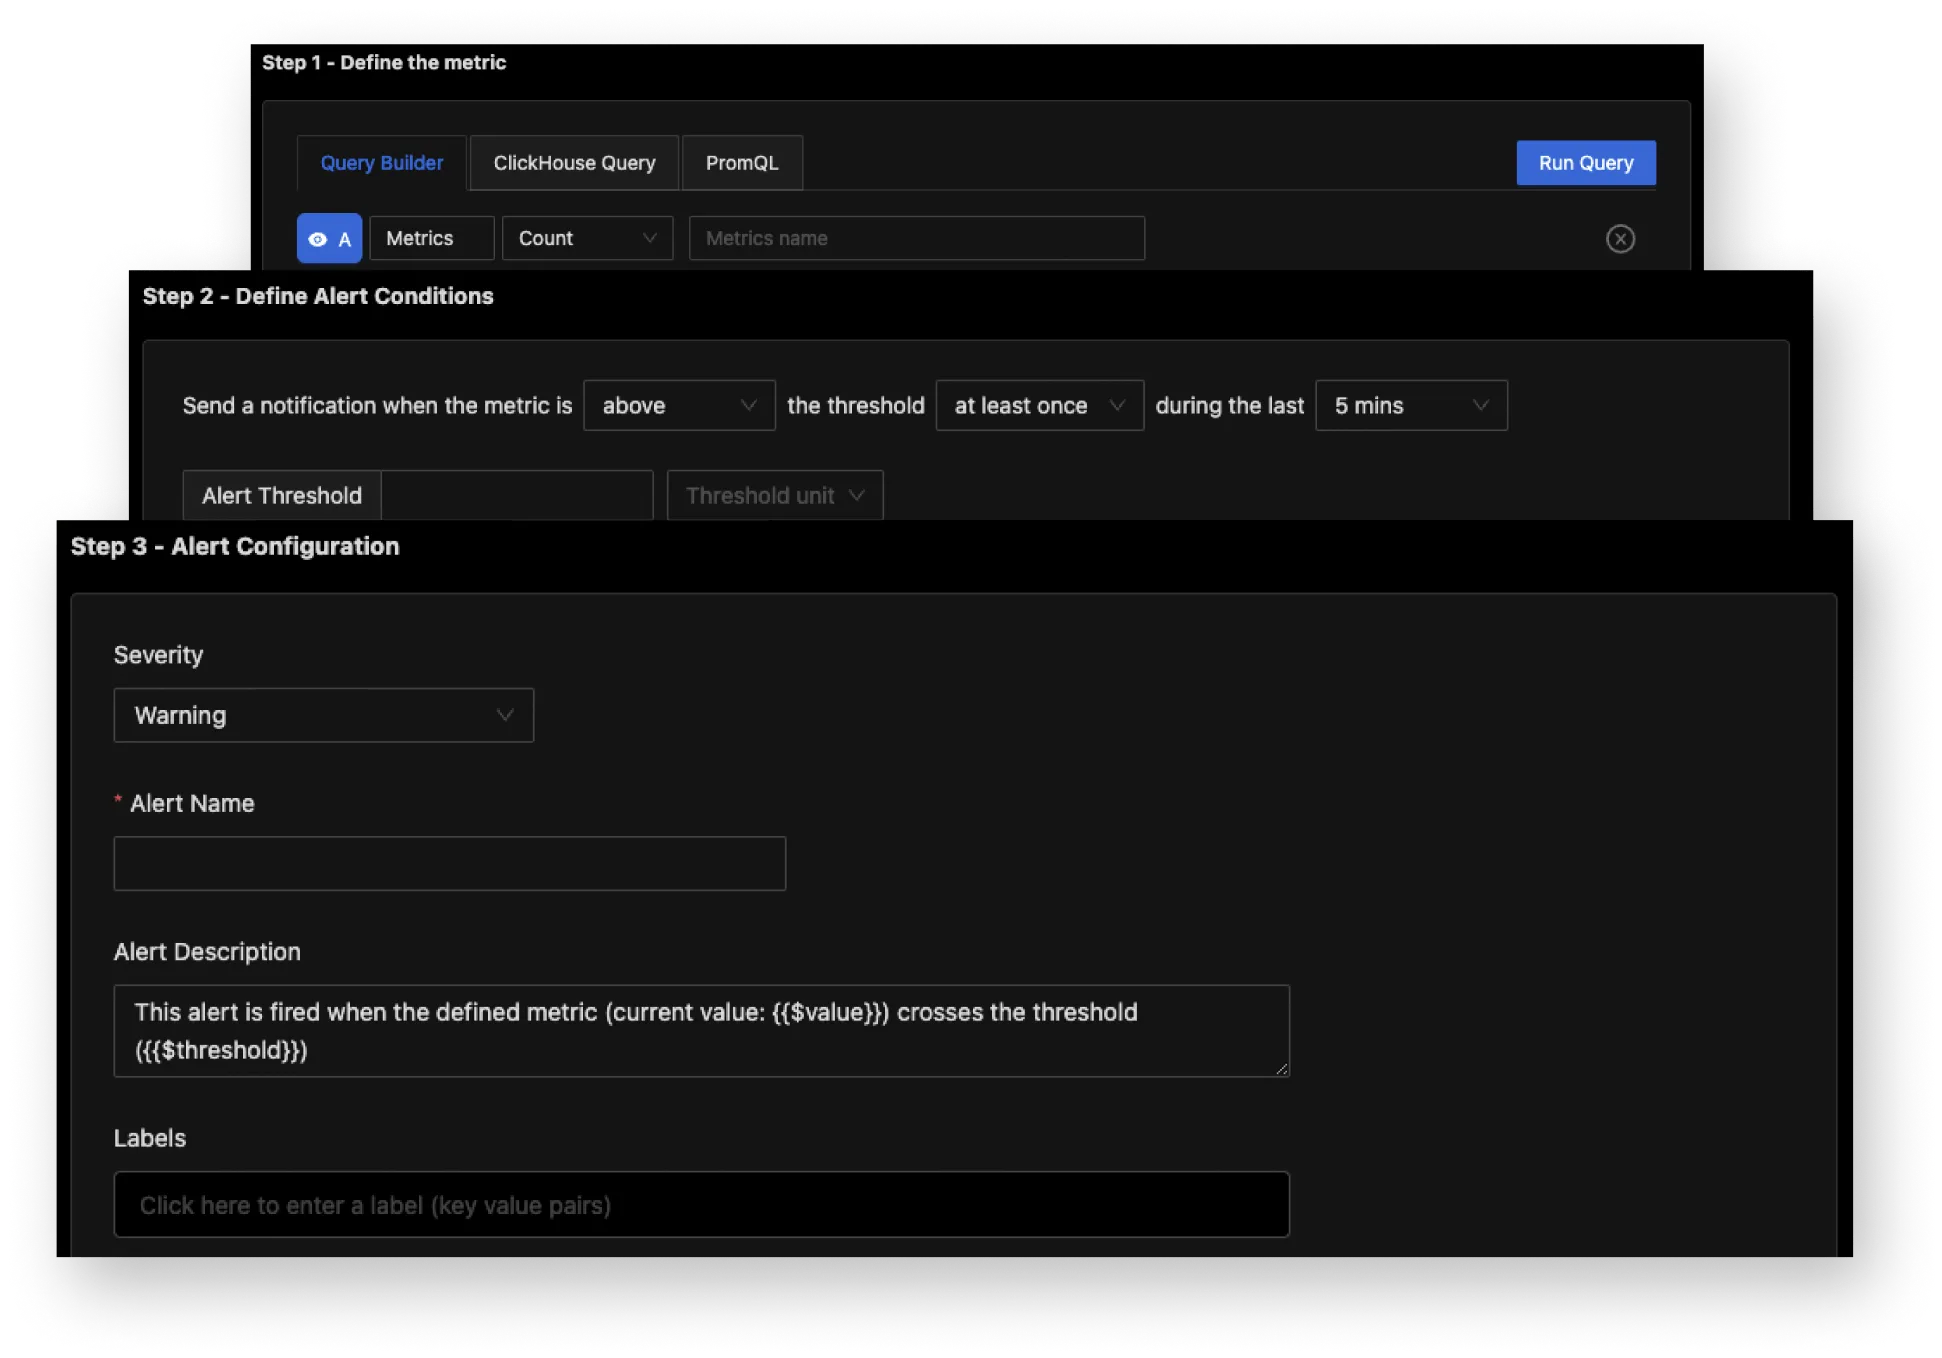
- Easy to set alerts with DIY query builder
- Support for PromQL for users familiar with Prometheus alert manager
- Support for multiple notification channels like Slack and PagerDuty
SigNoz is OpenTelemetry-Native
But why OpenTelemetry
OpenTelemetry is the second most active project in the CNCF,
with only Kubernetes being more active.

No vendor lock-in
Using an open source standard frees you from vendor lock-in.

Ease of use
Use auto-instrumentation libraries of OpenTelemetry to get started with little to no code change.

Covers all use-cases
OpenTelemetry is a one-stop solution for all your telemetry needs.

Standardize Observability
A single standard for all telemetry signals means increased developer productivity, consistency across teams.
Get granular control over your observability data.
Built for developers like you.

Query Builder
Query Builder
Write queries on all telemetry signals. Run aggregates, and apply filters and formulas to get deeper insights from your data.

Columnar Database
Columnar Database
SigNoz uses ClickHouse - a fast open source distributed columnar database. Ingestion and aggregations are lightning fast.

Telemetry Pipelines
Telemetry Pipelines
Build telemetry pipelines easily with SigNoz OTel Collector. Integrate any existing pipeline with OTel Collector to send data to SigNoz.

Source Code
Source Code
Check out the entire source code of SigNoz on GitHub. Create issues, build features & integrations, get started without contacting any sales rep.
Worried about data protection laws?
We can help.
For SigNoz Cloud
Send data to your preferred hosting location
Store your data in the US, EU or India region depending on your needs.
 US Cloud
 EU Cloud
 India Cloud
For Self-Hosted
Have your customer data in your infra
You can self-host SigNoz or opt for our managed self-hosted offerings to have complete adherence to data privacy and regulation laws.
 Data Privacy
Enterprise Grade Observability
Get access to observability at any scale
with advanced security and compliance.
- SSO and SAML support
- Query API Keys
- Advanced Security
- AWS Private Link
- VPC Peering
- Custom Integrations
Pricing you can trust.
Tired of Datadog’s unpredictable bills or New Relic’s user-based pricing?
We’re here for you.
No user-based pricing
Add as many team members as you want.
Simple usage-based pricing
Only pay for the data you send.
No special pricing for custom metrics
All metrics charged simply at $0.1 per million samples.
Developers ❤️ Open Source SigNoz
Join our huge open source community and nerd about observability
TESTIMONIALS
We love what people are saying about SigNoz
NewRelic: receiving OpenTelemetry at all takes me 1/2 day to grok, docs are a mess. Traces show up after 5min. I burn the free 100GB/mo in 1 day of light testing. @SignozHQ: can run it locally (∞GB), has a special tutorial for OpenTelemetry + Rust! Traces show up immediately.
Just deployed SigNoz to an EKS cluster.Still can't believe this is free, everything works like a charm. I am really really impressed with the documentation and dashboard.
Still in awe. Sneak peek into running the product, you can easily set retention period for metrics, traces and logs with one click and set cold storage for old logs to s3 with few config changes.
Read ABOUT
Latest in OpenTelemetry
OpenTelemetry Webinars: Getting started with OpenTelemetry.
Gathering data with the OpenTelemetry Collector.
Implementing Distributed Tracing in a NodeJS Application using OpenTelemetry


